没有合适的资源?快使用搜索试试~ 我知道了~
2023年美赛特等奖论文-C-2318982-解密.pdf
1.该资源内容由用户上传,如若侵权请联系客服进行举报
2.虚拟产品一经售出概不退款(资源遇到问题,请及时私信上传者)
版权申诉
0 下载量 22 浏览量
2024-05-06
22:06:02
上传
评论
收藏 9.42MB PDF 举报
温馨提示
试读
25页
大学生,数学建模,美国大学生数学建模竞赛,MCM/ICM,2023年美赛特等奖O奖论文
资源推荐
资源详情
资源评论
Problem Chosen
C
2023
MCM/ICM
Summary Sheet
Team Control Number
2318982
Wordle: One Letter Makes a Difference
Summary
Since its launch in early 2022, Wordle has sparked a wave of sharing yellow, green and grey
squares on social media. Wordle has simple but challenging rules that requiring only a short
attention span. Based on the Wordle dataset, we dig into the information hidden behind the number
and the percentage of reported results.
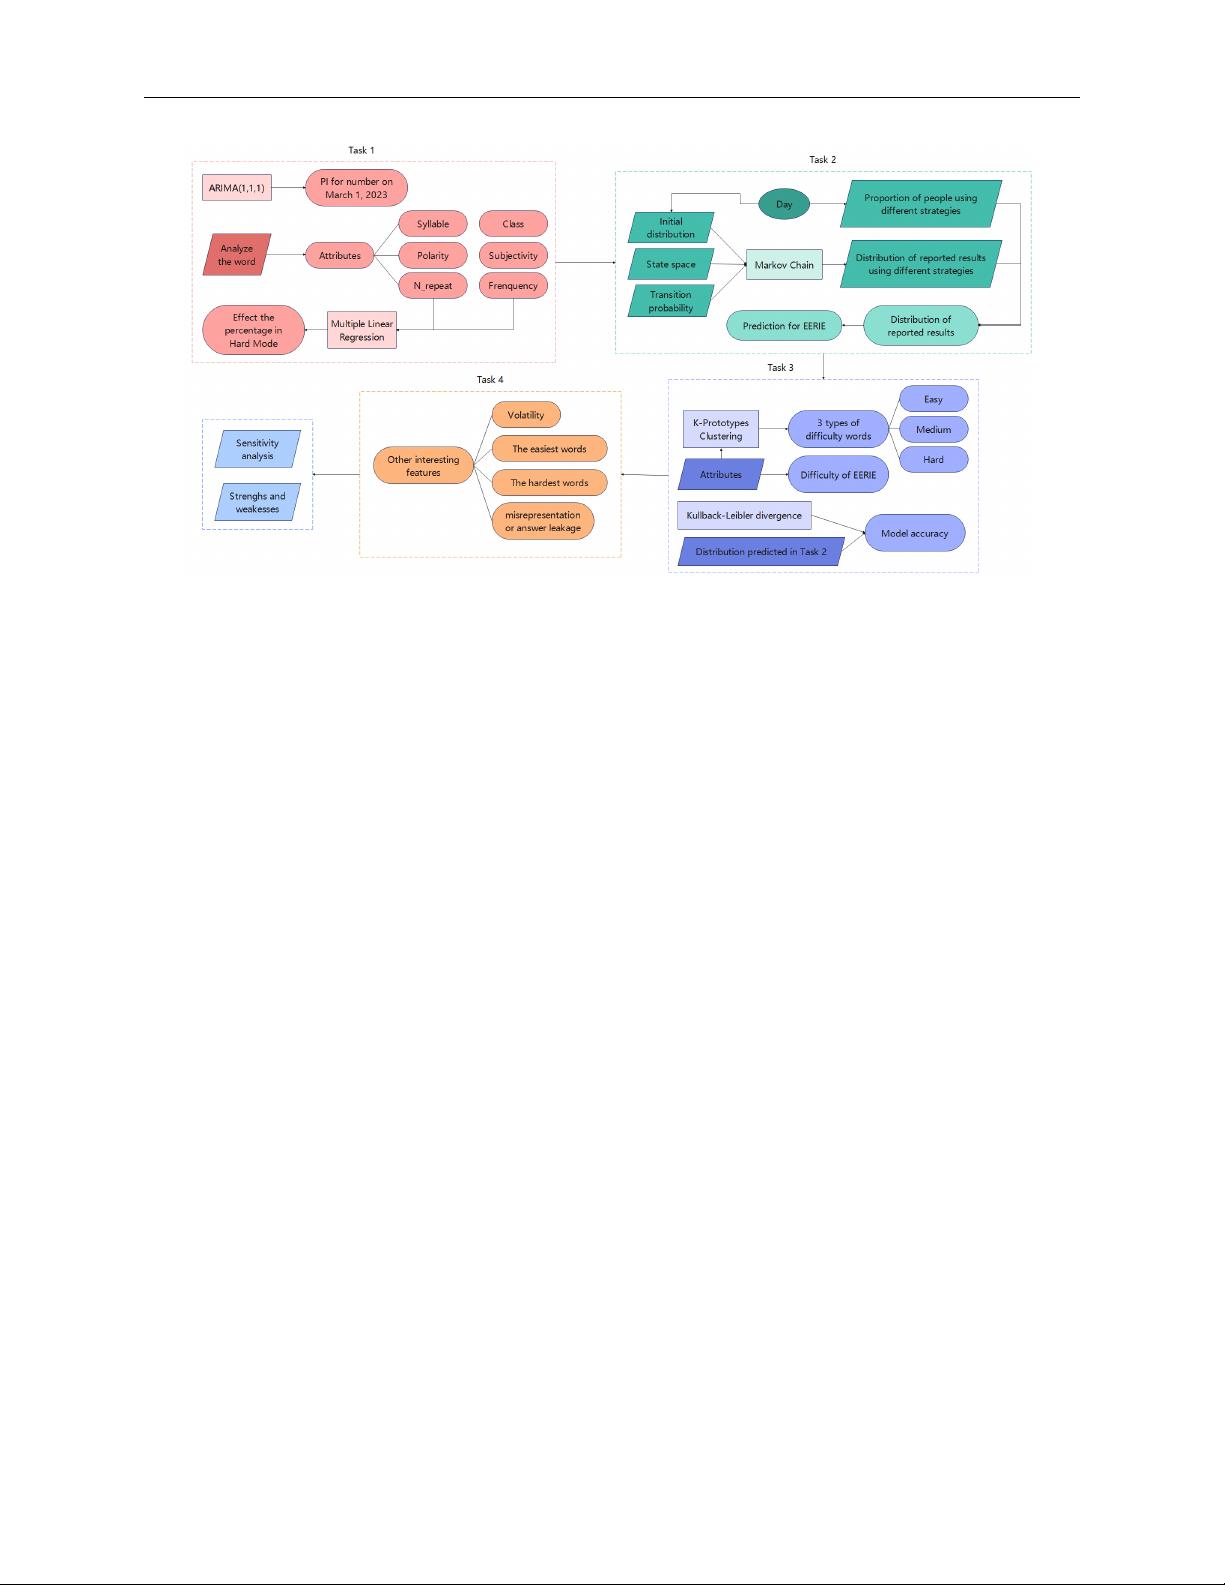
First, we focus on the number of reported results that varies over time. We try to build an
ARIMA model providing us with a prediction interval for the number of reported results on March
1, 2023. It indicates that the Wordle still maintains a high level of enthusiasm one year after
its release. Then, we explore the factors influencing the percentage of Hard Mode. By fitting a
multiple linear regression model, the results show that the number of repeated letters and the
frequency of words are correlated with the difficulty of the game. The difficulty information that
players obtained from the community in advance may influence their choice of game mode.
Next, we are curious how the distribution of the reported results would change in the future.
To simplify the model, we generalize the player’s game states to their known number of squares of
each color. Wordle can then be modeled as a Markov chain, and the problem is transformed into
solving the first-arrival distribution of it. This requires knowledge of the initial distribution
and transfer probabilities relying on the strategies chosen by players. In addition, the transfer
probability is assumed to depend on the difference in the amount of information between states. So
we propose a method to measure the current amount of information in the states. Based on this, we
model the entire Markov chain and solve the first reach-time distribution under different strategies.
To make the model more reasonable, it is assumed that the proportion of people choosing the
above two strategies varies with time. Accordingly, a method based on historical data is proposed
to estimate this proportion. Finally, we combine the estimated proportion with a Gaussian process
regression model to predict the future proportion of player strategy choices. This is then combined
with the Markov chains model to predict the distribution of future reported results. We finally
obtain the distribution of EERIE, which is (0.00, 0.15, 11.05, 28.44, 35.46, 21.16, 3.76).
Finally, we want to classify words according to their difficulty. Since word difficulty is only
related to the word itself, it is believed that clustering according to word attributes can reflect the
difficulty level of words. For this idea, K-Prototypes clustering is performed and reasonable word
difficulty index is set. Then, we extract the difficulty information of each category, and then plot
the density function and calculate Kullback-Leibler divergence. Both of results show that words
with different attributes have different difficulty levels. It proves that our idea is reasonable and the
classification model is accurate. Further, we classify the EERIE into “hard” class by its attributes,
which is consistent with the percentage distribution obtained above. In addition, we discuss other
information about the dataset, such as the difficult words, the easy words and the unexpected words.
Finally, the sensitivity analysis of the model shows the good robustness of our model.
Keywords: ARIMA; multiple linear regression; Markov chains; K-Prototypes clustering
Contents
1 Introduction 3
1.1 Background . . . . . . . . . . . . . . . . . . . . . . . . . . . . . . . . . . . . . . 3
1.2 Restatement of The Problem . . . . . . . . . . . . . . . . . . . . . . . . . . . . . 3
1.3 Our Work . . . . . . . . . . . . . . . . . . . . . . . . . . . . . . . . . . . . . . . 3
2 Model Assumptions and Notations 4
2.1 Assumptions and Justification . . . . . . . . . . . . . . . . . . . . . . . . . . . . . 4
2.2 Notations . . . . . . . . . . . . . . . . . . . . . . . . . . . . . . . . . . . . . . . 4
3 Data Preprocessing 5
4 Task 1: Number Prediction and Word Attributes 5
4.1 Number Prediction Based on ARIMA Model . . . . . . . . . . . . . . . . . . . . . 5
4.2 Effect of Word Attributes . . . . . . . . . . . . . . . . . . . . . . . . . . . . . . . 10
4.2.1 Attributes of The Word . . . . . . . . . . . . . . . . . . . . . . . . . . . . 10
4.2.2 Multiple Linear Regression . . . . . . . . . . . . . . . . . . . . . . . . . . 12
5 Task 2: Distribution based on Markov Chain Model 14
5.1 State Space . . . . . . . . . . . . . . . . . . . . . . . . . . . . . . . . . . . . . . 15
5.2 Initial Distribution . . . . . . . . . . . . . . . . . . . . . . . . . . . . . . . . . . . 16
5.3 Transfer Probability . . . . . . . . . . . . . . . . . . . . . . . . . . . . . . . . . . 17
5.4 Distribution of Reported Results . . . . . . . . . . . . . . . . . . . . . . . . . . . 18
5.5 Proportion of Two Strategies Used . . . . . . . . . . . . . . . . . . . . . . . . . . 19
5.6 Predicting The Distribution of Future Reporting Results . . . . . . . . . . . . . . . 19
6 Task 3: Classification of Solution Words 20
6.1 Difficulty Score . . . . . . . . . . . . . . . . . . . . . . . . . . . . . . . . . . . . 20
6.2 K-Prototypes Clustering . . . . . . . . . . . . . . . . . . . . . . . . . . . . . . . . 20
6.2.1 Solving Steps . . . . . . . . . . . . . . . . . . . . . . . . . . . . . . . . . 20
6.2.2 Results . . . . . . . . . . . . . . . . . . . . . . . . . . . . . . . . . . . . 20
6.3 Difficulty Classification of Solution Words . . . . . . . . . . . . . . . . . . . . . . 21
6.4 Difficulty of The Word EERIE . . . . . . . . . . . . . . . . . . . . . . . . . . . . 21
7 Task 4: Other Interesting Features 21
8 Sensitivity Analysis 23
9 Modle Evaluation and Further Discussion 23
9.1 Strengths . . . . . . . . . . . . . . . . . . . . . . . . . . . . . . . . . . . . . . . . 23
9.2 Weaknesses . . . . . . . . . . . . . . . . . . . . . . . . . . . . . . . . . . . . . . 23
10 A Letter to The Puzzle Editor 24
References 25
1
Team # 2318982 Page 3 of 25
1 Introduction
1.1 Background
Wordle is a popular five-letter puzzle game offered daily by the New York Times, where players
try to guess the right words in 6 tries or less, getting feedback with each guess. It’s available in
over 60 languages and has two levels: regular and Hard Mode. In Hard Mode, the letters that were
correctly guessed must be used in subsequent guesses. After a guess, tiles change color: yellow =
letter in wrong place, green = letter in right place and gray = letter not included.
1.2 Restatement of The Problem
Considering the background information and related conditions given in the title, we need to
solve the following problems:
• Develop a model to explain daily variations of reported results, and use it to create a prediciton
interval for the number of results on March 1, 2023. Is the percentage of Hard Mode scores
affected by the word properties? If yes, how? If no, why not?
• Develop a model to predict the solution’s (1,2,3,4,5,6,X) distribution for a specific future
word. Discuss the uncertainties associated with the prediction. Provide an example of the
predictions for EERIE on March 1, 2023, and the confidence in the model.
• Create a classification model to classify the words based on their difficulty, and describe
the particular attributes for each. How difficult is the word EERIE according to the model?
Evaluate the model’s accuracy.
• Lastly, describe other interesting features in the dataset.
1.3 Our Work
Considering the background and the problems, our work mainly includes the following:
• We hypothesized that the number of reported results on March 1st, 2023 could be predicted
through building an ARIMA model with optimal parameters. To gain further insight into the
word attributes, we ran a multiple linear regression to examine the effect of word attributes
on the percentage of scores reported in the difficulty model.
• We modeled the process of playing wordle games as a discrete-state Markov chain and derived
two game strategies based on the derived information. We then estimated the distribution of
reported outcomes for the two strategies, using theoretical tools such as information entropy
and Markov chain properties. The obtained outcomes were subsequently combined to make
predictions regarding the distribution of reported outcomes at a future date.
• Furthermore, the difficulty of any given word is determined by its attributes. As such,
clustering words by their attributes could provide valuable insight into the difficulty of each
respective category.
• Finally, after a close analysis of the dataset, we observed several noteworthy characteristics.
In order to avoid complicated description, intuitively reflect our work process, the flow chart is
shown in Figure 1.
Team # 2318982 Page 4 of 25
Figure 1: Flow chart of our work
2 Model Assumptions and Notations
2.1 Assumptions and Justification
To simplify the problem and facilitate our modelling of the wordle game, we have made the
following basic assumptions, each with appropriate justification.
(1) Players always make locally optimal choices based only on the information they currently
know when playing wordle games.
(2) Most of the time, the correct answers to wordle games come from the more common words.
(3) Players are rational when playing wordle games and generally do not discard known infor-
mation easily.
(4) Players play wordle by selecting fill-in words from a roughly identical word bank, and they
hold the same subjective probability of whether a word is the correct answer.
(5) The higher the information gain of an event, the lower the probability of its occurrence
(6) Measuring the information content of a word on different sized thesauri gives roughly the
same result.
(7) The proportion of players using each strategy does not change significantly throughout the
day.
2.2 Notations
Team # 2318982 Page 5 of 25
Table 1: Notations
Symbols Description
A
i
The set of states that are reachable in one step of state i.
S The state space of the Markov chain.
W All the words a player may fill in.
p
x
The subjective probability that word x is the correct answer.
freq
x
The word frequency of word x.
I
x
The amount of information obtained by filling in the word x at the opening.
x
(r)
true
The correct word of the r th day.
G
i
The set of words that the player has guessed when he is in state i
p
(r)
k
(i, j) The transfer probability from state i to j in Markov chain on day r.
T
(r)
j
The number of steps to first reach state j from state i on the Markov chain at day r.
C
(r)
k
The set of absorbing states of Markov chains on day r.
T
(r)
absorbed
Number of steps before falling into an absorbing state on Markov chain at day r.
q
k
(r) The proportion of all players using strategy k on day r.
where we define the main parameters while specific value of those parameters will be given later.
3 Data Preprocessing
Since we are only allowed to use the datasets “Problem_C_Data_Wordle.csv” by COMAP
official, we need to pre-process the dataset before solving the problem. An initial inspection of the
dataset showed that there are some outliers and missing values.
• In the word column, we find that the length of some words are not equal to five,such as
“rprobe”, “clen” and “tash”. As mentioned by COMAP official, in line 18, for contest 545,
the word listed is “rprobe” while it should be “probe”. By looking up the solution word of
the day published by wordle, we also get that “clen” should be “clean” and “tash” should be
“trash”.
• Additionally, in line 34, for contest 529, the number of reported results listed is “2569”, while
the correct number should be “25569”.
4 Task 1: Number Prediction and Word Attributes
In this section, we predicted the number of reported results on March 1, 2023 by building an
ARIMA model and choosing the optimal parameters. Then we summarize the word attributes and
then explore the effect of word attributes on the percentage of scores reported in the difficulty model
by building a multiple linear regression.
4.1 Number Prediction Based on ARIMA Model
Autoregressive integrated moving average, which is known as ARIMA, is a statistical analysis
model that uses time-series data to predict the future trend. The basic idea of ARIMA is that
the data sequence formed by the prediction over time is regarded as a random sequence and a
剩余24页未读,继续阅读
资源评论
阿拉伯梳子
- 粉丝: 1654
- 资源: 5735
上传资源 快速赚钱
- 我的内容管理 展开
- 我的资源 快来上传第一个资源
- 我的收益 登录查看自己的收益
- 我的积分 登录查看自己的积分
- 我的C币 登录后查看C币余额
- 我的收藏
- 我的下载
- 下载帮助
安全验证
文档复制为VIP权益,开通VIP直接复制
信息提交成功