没有合适的资源?快使用搜索试试~ 我知道了~
2023年美赛特等奖论文-C-2314151-解密.pdf
1.该资源内容由用户上传,如若侵权请联系客服进行举报
2.虚拟产品一经售出概不退款(资源遇到问题,请及时私信上传者)
版权申诉
0 下载量 12 浏览量
2024-05-06
22:05:56
上传
评论
收藏 2.13MB PDF 举报
温馨提示
试读
25页
大学生,数学建模,美国大学生数学建模竞赛,MCM/ICM,2023年美赛特等奖O奖论文
资源推荐
资源详情
资源评论
Problem Chosen
C
2023
MCM/ICM
Summary Sheet
Team Control Number
2314151
Breaking the Wordle
Summary
As Wordle has become popular on social media, more and more users have played the scrabble
game. How do time and word attributes affect the number of reports, distribution of attempts, and
other report-related information? Therefore, a modeling analysis was conducted using the game data
from 2022.
Before building the model, we cleaned and normalized the given data and identified word at-
tributes such as the number of repeated letters, number of vowel letters, number of consonant letters,
commonness, and frequency. Preliminary preparations were made for model building and solving.
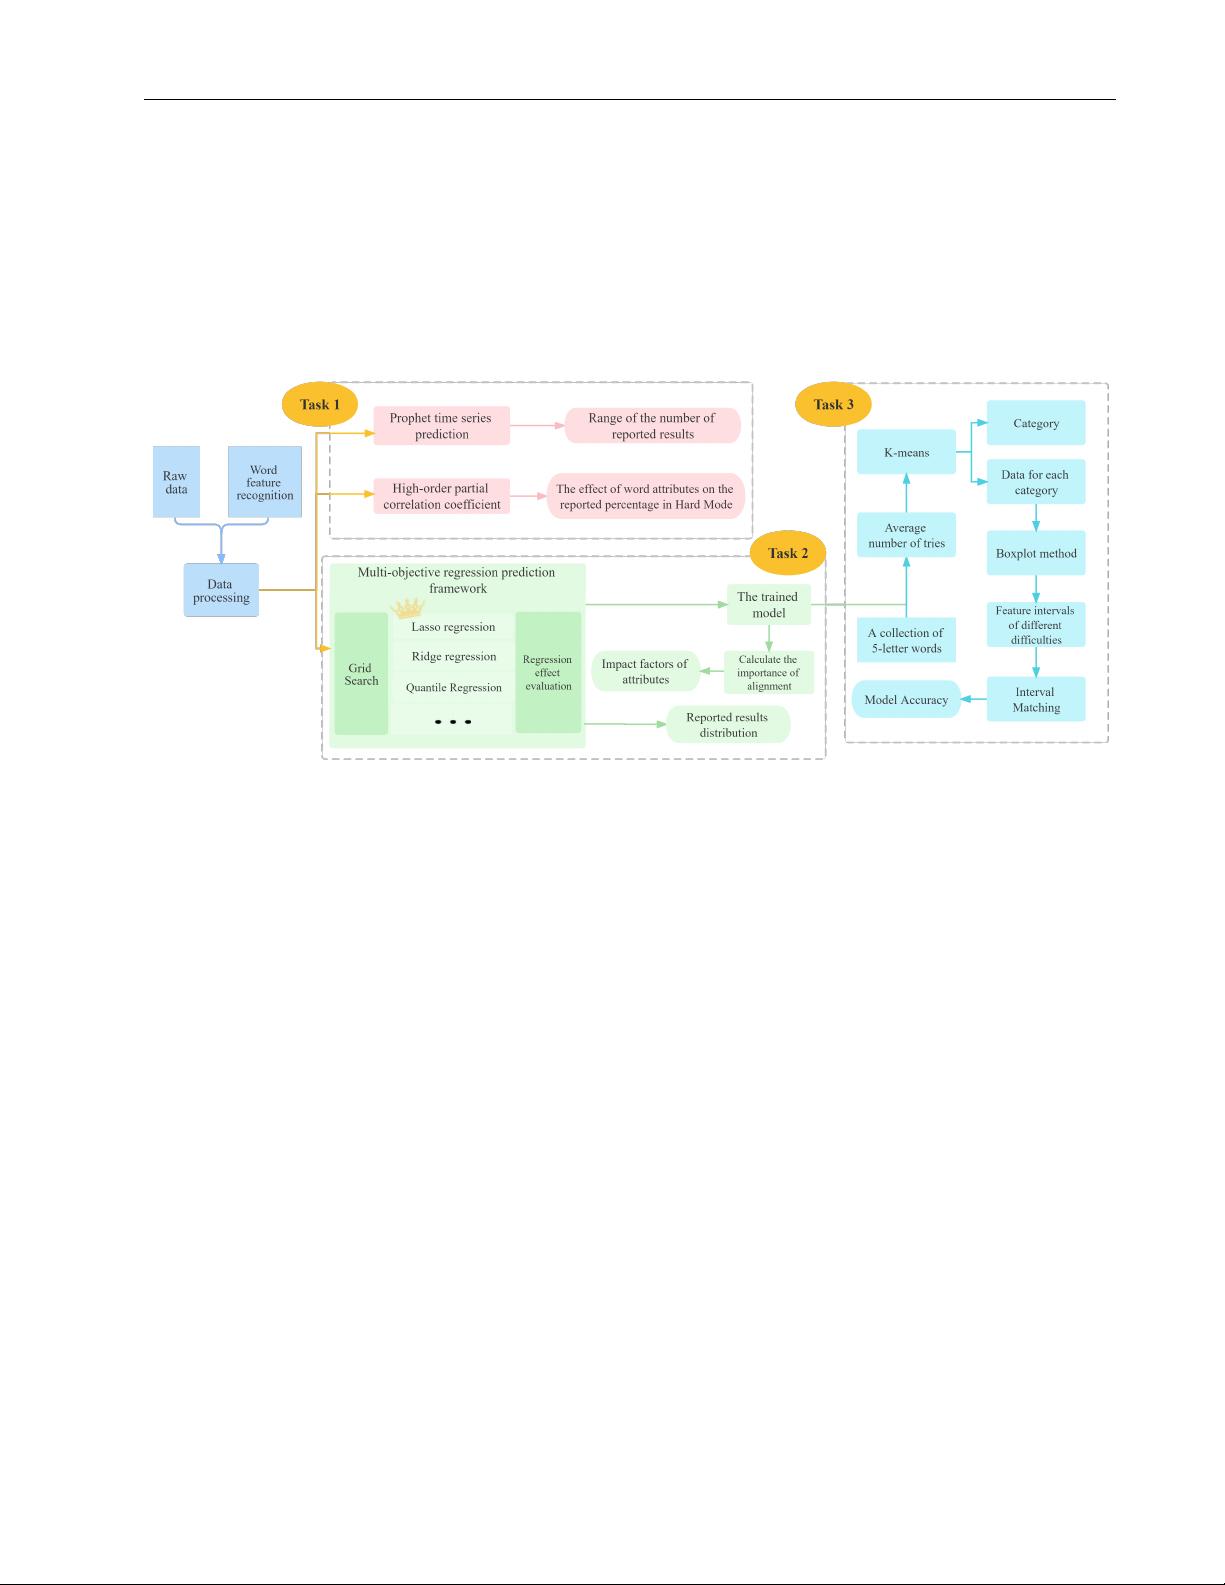
First, to predict the number of future reports, a prophet-based time-series prediction model was
built, considering the effects of trends, seasonality, and holidays. The predictions yielded a range
of report numbers for March 1, 2023: [10355,18742]. Regarding the variation of report numbers,
during the week, the number of reports tends to be highest on Wednesdays and lowest on weekends.
In exploring the effect of word attributes on the proportion of difficulty reports, we calculated higher-
order partial correlation coefficients for both, controlling for the interaction between word attributes,
and found that the number of vowel letters, the number of non-repeats, and word commonness were
negatively correlated. The number of consonant letters and the number of non-repeats was positively
correlated.
Secondly, an optimized multi-objective regression prediction framework was developed to
explore the effects of word attributes on the distribution of reported outcomes. The framework chose
the optimal lasso regression to predict the test set with an RMSE of 0.80. The distribution of the
number of attempts to predict ’EERIE’ was (0, 4, 17, 34, 30, 13, 2). The ranking importance of each
attribute was calculated, and it was found that the number of consonant letters, number of vowel letters,
and frequency had a more significant influence on the distribution of reported results with the influence
factors of 4.226, 3.993, and 1.253, respectively.
Next, the above model was used to predict the distribution of reported outcomes for each word in
the 5-letter word set. Then, K-means was used to classify the words into high (≥4.37), medium (4.13-
4.37), and low (<4.13) difficulty categories based on the average number of attempts, and it was found
that the Number of duplicates, Maximum of repeats, Prevalence and Frequency differed significantly
across categories. Moreover, the interval of each attribute was divided. According to the established
model, ’EERIE’ is difficult. The model’s accuracy is 91.36 %by matching the attribute intervals for
different difficulty words, and it can be inferred that the established model and the divided attribute
intervals are reasonable.
Finally, the sensitivity analysis results demonstrate that our model is robust and reliable. In addition,
The study of the data set also revealed the declining popularity of Wordle and the increasing percentage
of difficult mode challenges, and provided the New York Times with suggestions for restoring the
game’s popularity.
Keywords: Wordle analysis, Prophet, High-order partial correlation, Multi-objective regression
forecasting, K-means
Team # 2314151 Page 1 of 24
Contents
1 Introduction 2
1.1 Problem Background . . . . . . . . . . . . . . . . . . . . . . . . . . . . . . . . . . . 2
1.2 Restatement of the Problem . . . . . . . . . . . . . . . . . . . . . . . . . . . . . . . . 2
1.3 Our Works . . . . . . . . . . . . . . . . . . . . . . . . . . . . . . . . . . . . . . . . . 2
2 Preparation of the Models 3
2.1 Assumptions . . . . . . . . . . . . . . . . . . . . . . . . . . . . . . . . . . . . . . . 3
2.2 Notations . . . . . . . . . . . . . . . . . . . . . . . . . . . . . . . . . . . . . . . . . 4
3 Data Processing 4
3.1 Data Cleaning . . . . . . . . . . . . . . . . . . . . . . . . . . . . . . . . . . . . . . . 4
3.2 Outlier rejection and standardization . . . . . . . . . . . . . . . . . . . . . . . . . . . 4
3.3 Word attribute determination . . . . . . . . . . . . . . . . . . . . . . . . . . . . . . . 5
4 Task 1 7
4.1 Prophet algorithm . . . . . . . . . . . . . . . . . . . . . . . . . . . . . . . . . . . . . 7
4.2 Higher-order partial correlation analysis model . . . . . . . . . . . . . . . . . . . . . 9
5 Task 2 12
5.1 Multi-objective regression prediction framework . . . . . . . . . . . . . . . . . . . . . 12
5.2 Establishment of prediction model . . . . . . . . . . . . . . . . . . . . . . . . . . . . 13
5.3 Word prediction - EERIE . . . . . . . . . . . . . . . . . . . . . . . . . . . . . . . . . 14
5.4 Feature influence degree analysis . . . . . . . . . . . . . . . . . . . . . . . . . . . . . 15
5.5 Model reliability analysis . . . . . . . . . . . . . . . . . . . . . . . . . . . . . . . . . 15
6 Task 3 16
6.1 K-means clustering algorithm . . . . . . . . . . . . . . . . . . . . . . . . . . . . . . . 17
6.2 Selection of parameters . . . . . . . . . . . . . . . . . . . . . . . . . . . . . . . . . . 17
6.3 Clustering results . . . . . . . . . . . . . . . . . . . . . . . . . . . . . . . . . . . . . 18
6.4 Word interval identification - EERIE . . . . . . . . . . . . . . . . . . . . . . . . . . . 18
6.5 Model reliability analysis . . . . . . . . . . . . . . . . . . . . . . . . . . . . . . . . . 19
7 Interesting aspects of the data 20
8 Sensitivity Analysis 21
9 Strengths and Weaknesses 22
9.1 Strength . . . . . . . . . . . . . . . . . . . . . . . . . . . . . . . . . . . . . . . . . . 22
9.2 Weakness . . . . . . . . . . . . . . . . . . . . . . . . . . . . . . . . . . . . . . . . . 22
10 Letter 22
1
Team # 2314151 Page 2 of 24
1 Introduction
1.1 Problem Background
Crossword puzzles have always seemed inseparably linked to the media. Since January 2022, Wor-
dle, the New York Times’ digital crossword, has become more and more popular in many countries[1].
How do players play Wordle? They are permitted to select five letters from a pool of 26 to construct
a five-letter word that can be solved in no more than six attempts to conclude the Wordle puzzle
successfully. After the player submits the word, the sticker’s color will change. Green is the correct
letter, and yellow is the letter in the word but in the wrong place. There are two modes of play: normal
mode and hard mode. Hard mode is where the correct letter (green or yellow) is found in the previous
attempt and must be used in subsequent attempts.
Wordle updates the puzzle once a day, and many players report their scores on social media. As
a result, data such as the number of people reporting their scores that day, the number of players
participating in hard mode, and the percentage of players completing the puzzle on different attempts
are all collected and counted. By using the available data wisely, we can solve some interesting
problems.
1.2 Restatement of the Problem
Considering the background information, constraints outlined in the problem statement and addi-
tional guidance, we need to solve the following problems:
• Task 1: Establish a model that can explain and predict changes in the number of reported results
and provide a prediction interval for the number of reported results on March 1, 2023. In addition,
an examination of the impact of word attributes on the proportion of reports filed by players in
the hard mode is necessary, accompanied by a rationale for this phenomenon.
• Task 2: Develop a model that predicts reported outcomes’ distribution and explore the uncer-
tainties the model and predictions have.
• Task 3: Build a model for classifying words according to difficulty and determine the factors
associated with word classification. This model is used to determine the difficulty of EERIE and
to discuss the accuracy of the classification model.
• Task 4: Enumerate and explicate additional noteworthy characteristics inherent in this dataset.
• Task 5: Present a concise summary of the study findings in a letter addressed to the Puzzle
Editor of the New York Times.
1.3 Our Works
Based on the analysis of the problem, we propose the model framework shown in figure 1, which
is mainly composed of the following parts:
Data analysis: processes the reported data and identifies the characteristics of the words.
2
Team # 2314151 Page 3 of 24
Predictive modeling: Prophet algorithm was chosen to build a time-series regression prediction
model, and a higher-order partial correlation analysis was used to find the degree of influence of each
attribute.
Development of a multi-objective regression prediction framework: use this framework to help
us select a Lasso regression prediction model.
Difficulty interval division: the word difficulty was classified into three categories using the
K-means algorithm and the classification results were validated by Lasso regression prediction.
Figure 1: Model framework
2 Preparation of the Models
2.1 Assumptions
• Assumption 1. Assume that the user data given in the question is independently and identically
distributed.
Reason 1: this assumption ensures that the individual samples are independent of each other to
avoid the influence of the modeling process due to the association between the samples.
• Assumption 2. Assume that the pre-processed data is reliable.
Reason 2: this assumption is made to ensure the accuracy of the model solution.
• Assumption 3. Assume that the external environment associated with the game does not change
abruptly
Reason 3: external factors remain steady to ensure stable prediction models.
3
Team # 2314151 Page 4 of 24
2.2 Notations
Table 1: Notations
Symbol Definition
s
j
Timestamp
k Growth rate
δ
j
The amount of change in the growth rate on the timestamp
m Offset amount
ϵ Error term
N Number of cycles in the seasonality model
D
i
Period before and after a holiday
κ
i
Range of holiday effects
P Significance level
3 Data Processing
3.1 Data Cleaning
Topic C reports on the use of Wordle in the past year. However, we found a lot of dirty data in this
report.
Table 2: Dirty data
Contest number Word Number of reported results Number in hard mode 1 try 2 tries 3 tries 4 tries 5 tries 6 tries 7 or more tries (X)
525 clen 26381 2424 1 17 36 31 12 3 0
314 tash 106652 7001 2 19 34 27 13 4 1
540 na
¨
ıve 21947 2075 1 7 24 32 24 11 1
473 marxh 30935 2885 0 9 30 35 19 6 1
207 favor 137586 3073 1 4 15 26 29 21 4
In the data shown above, the two words numbered 525, and 314 do not match the game because they
are only 4 in length, so we inferred that the dataset blundered by under-entering the letters. To solve
such a problem, we found the most similar letters to them instead by comparing them with artificial
intelligence algorithms. The word numbered 540 is due to a misspelling of the letter, which should
be ”naive.” We searched the word database and found that the word ”marxh,” numbered 473, did not
exist. We then compared the shapes of the words with database analysis and concluded that the correct
spelling should be ”marsh.” The word numbered 207 has an extra space in the input, so it is also an
outlier. We can delete the extra space to get the correct data.
3.2 Outlier rejection and standardization
We use the 68–95–99.7 rule (3σ criterion) to screen and reject outliers[2]. We found an anomaly
in the Number of reported results data for the word ’study’ on 2022/11/30, and we zeroed it to bring it
4
剩余24页未读,继续阅读
资源评论
阿拉伯梳子
- 粉丝: 1654
- 资源: 5735
上传资源 快速赚钱
- 我的内容管理 展开
- 我的资源 快来上传第一个资源
- 我的收益 登录查看自己的收益
- 我的积分 登录查看自己的积分
- 我的C币 登录后查看C币余额
- 我的收藏
- 我的下载
- 下载帮助
安全验证
文档复制为VIP权益,开通VIP直接复制
信息提交成功