没有合适的资源?快使用搜索试试~ 我知道了~
2023年美赛特等奖论文-C-2318036-解密.pdf
1.该资源内容由用户上传,如若侵权请联系客服进行举报
2.虚拟产品一经售出概不退款(资源遇到问题,请及时私信上传者)
版权申诉
0 下载量 163 浏览量
2024-05-06
22:06:00
上传
评论
收藏 1.08MB PDF 举报
温馨提示
试读
24页
大学生,数学建模,美国大学生数学建模竞赛,MCM/ICM,2023年美赛特等奖O奖论文
资源推荐
资源详情
资源评论
Problem Chosen
C
2023
MCM/ICM
Summary Sheet
Team Control Number
2318036
Exploring Wordle: Insights into Puzzle Solving and Tweet Shares Pattern
Summary
Wordle, a word puzzle that has attracted millions of people, is now owned by The New York
Times. For the company’s game editor, how the game is solved and shared on social media is critical
information, as it can be used to guide future puzzle design and ultimately maximise the total number
of players. This paper aims to build a quantitative model based on word attributes and result
reports on Twitter to predict the future pattern of players.
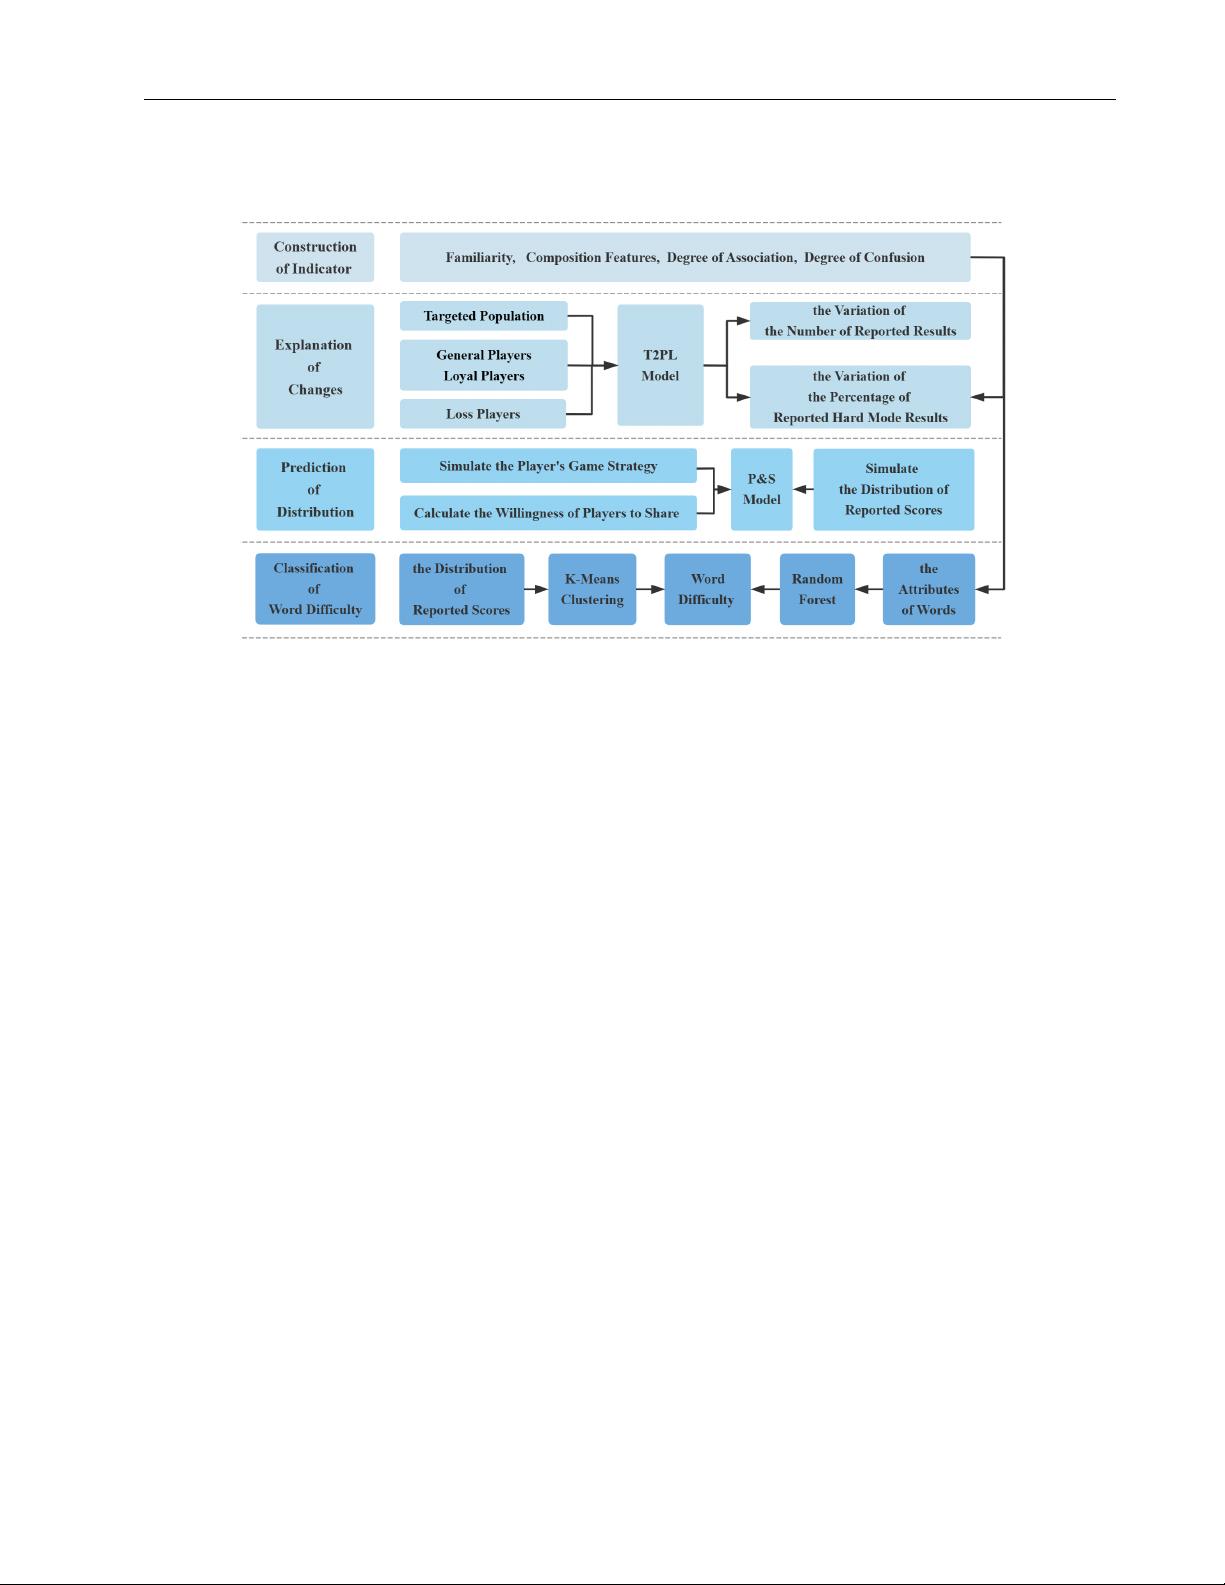
After examining and cleaning the raw data, we first define 12 attribute indicators measuring its
familiarity (how often used), degree of association, degree of confusion and word composition
features. They are computed in advance because the following models will frequently use these
indicators.
For Problem 1, we build a dynamic system called Target-two-Players-Lost (T2PL) based on the
SIR Model to explain the daily fluctuation of Wordle reports. Players are additionally divided into two
categories: general players and loyal players, each with a different attrition rate. This allows the model
to simulate unequal decline rates over different time periods better. The relationship between word
attributes and the number of hard mode players is also explored, and it is found that certain attributes
affect the percentage of Hard Mode reports.
For Problem 2, we develop a P&S Model, which is a model that uses simulation algorithms and
gradient descent to mimic the behavior of players in guessing words and sharing the game results. The
simulator works by eliminating all unsatisfactory words using observable information, then randomly
sampling words from the remaining word list using word frequency as the weight. However, we found
that the simulation result could not perfectly match the true distribution. Therefore, we rescaled the
distribution with 7 variables representing how players are likely to share their score when given different
scores. They are optimised by gradient descent, and better distribution predictions could be generated.
Using the P&S Model, we predict the distribution of the word EERIE on March 1, 2023 is (0, 0,
9%, 29%, 45%, 14%, 3%).
For Problem 3, we are required to classify puzzles by difficulty. We perform a cluster analysis
on all reported trial distributions using 3 clusters K-means, with each cluster labelled easy, medium
and hard. We fit a Random Forest Model to divide the words into these three categories using the
attribute indicators defined at the beginning. The correlation coefficient between each indicator and
the difficulty is calculated, showing the direction in which these indicators affect the difficulty of the
puzzles. The sensitivity of the clustering is discussed as well. Based on our model, the difficulty of
EERIE is hard.
For Problem 4, we further explore the effects of word difficulty. Using Linear Regression, we
found that word difficulty has an obvious effect on the number of results reported: harder puzzles
lead to fewer reports. Difficulty also correlates with the percentage of people choosing Hard Mode, as
we mentioned earlier. Through this part of the study, we find that the correlation is formed by word
difficulty affecting the number of Normal Mode players.
With all the uncovered interactions between word attributes, puzzle difficulty, and game report pat-
terns, Wordle operators could gain a deeper understanding of their players. Several sensible suggestions
could also be made based on this discovery.
Keywords: Wordle; Dynamic system; Simulation; K-means; Random Forest
Team 2318036
Contents
1 Introduction 3
1.1 Background and Literature Review . . . . . . . . . . . . . . . . . . . . . . . . . . . . 3
1.2 Restatement of the Problem . . . . . . . . . . . . . . . . . . . . . . . . . . . . . . . . 3
1.3 Our Work . . . . . . . . . . . . . . . . . . . . . . . . . . . . . . . . . . . . . . . . . 4
2 Assumptions and Notations 4
2.1 Model Assumptions . . . . . . . . . . . . . . . . . . . . . . . . . . . . . . . . . . . . 4
2.2 Notations . . . . . . . . . . . . . . . . . . . . . . . . . . . . . . . . . . . . . . . . . 5
3 Data Preprocessing 5
4 Task 1: Word Attribute Indicators 6
5 Task 2: Predicting Daily Reports & Hard Mode Percentage 8
5.1 Problem Analysis . . . . . . . . . . . . . . . . . . . . . . . . . . . . . . . . . . . . . 8
5.2 Establishment of the Model . . . . . . . . . . . . . . . . . . . . . . . . . . . . . . . . 8
5.3 Solving the Model . . . . . . . . . . . . . . . . . . . . . . . . . . . . . . . . . . . . . 10
5.4 Solution and Result . . . . . . . . . . . . . . . . . . . . . . . . . . . . . . . . . . . . 10
5.5 Hard Mode Percentage Estimation . . . . . . . . . . . . . . . . . . . . . . . . . . . . 11
6 Task 3: Predicting Report Distribution 13
6.1 Problem Analysis . . . . . . . . . . . . . . . . . . . . . . . . . . . . . . . . . . . . . 13
6.2 Establishment of the Model . . . . . . . . . . . . . . . . . . . . . . . . . . . . . . . . 13
6.3 Predict Confidence and Uncertainties . . . . . . . . . . . . . . . . . . . . . . . . . . . 15
7 Task 4: Word Difficulty Classification 16
7.1 Cluster Analysis . . . . . . . . . . . . . . . . . . . . . . . . . . . . . . . . . . . . . . 16
7.2 Difficulty Classification . . . . . . . . . . . . . . . . . . . . . . . . . . . . . . . . . . 17
7.3 Sensitivity Analysis . . . . . . . . . . . . . . . . . . . . . . . . . . . . . . . . . . . . 19
8 Task 5: Other Features 20
8.1 Fluctuations in the Number of Reported Results . . . . . . . . . . . . . . . . . . . . . 20
8.2 Effect of Word Difficulty on Hard Mode Reports Percentage . . . . . . . . . . . . . . 20
9 Strengths and Weaknesses 21
9.1 Strengths . . . . . . . . . . . . . . . . . . . . . . . . . . . . . . . . . . . . . . . . . 21
9.2 Weaknesses . . . . . . . . . . . . . . . . . . . . . . . . . . . . . . . . . . . . . . . . 22
9.3 Further Discussion . . . . . . . . . . . . . . . . . . . . . . . . . . . . . . . . . . . . 22
9.3.1 Model Improvement . . . . . . . . . . . . . . . . . . . . . . . . . . . . . . . 22
9.3.2 Model Extension . . . . . . . . . . . . . . . . . . . . . . . . . . . . . . . . . 22
Team 2318036 Page 3 of 24
1 Introduction
1.1 Background and Literature Review
The word puzzle Wordle invented by Josh Wardle has attract millions of people due to its simplicity
and myriad variation. Beyond the game, perhaps the major factor that cause Wordle went viral is its
integrated sharing format consists of emoji squares, which spread widely through Twitter. In January
2022, Wordle was purchased by The New York Times Company and operated by them ever since. Only
one piece of puzzle is released every day at the game’s official website and this scarcity is also believed
to contribute to Wordle’s success.
In Wordle, player aim to crack a five-letter word within six guesses. Feedback is given after each
guess is submitted: Letters highlighted in green indicates that the answer has the same letter at the
same location. Yellow indicates this letter appears in the answer, but at another place. Grey indicates
the letter is absent in the answer. Generally, it requires three to five tries for an average player, but it
could vary significantly among different words. Addition to the normal version, there is also a Hard
Mode Wordle, stipulating each discovered correct word (in Yellow or Green) must be maintained in
the following guess[11].
Much research has focused on finding optimal strategy on solving the puzzle[1][4]. However, it
seems that player’s pattern is worthy to explore as well. As a major product under The New York Times
Games, its operator would like to trace and predict the number of shared games on Twitter. Besides,
released word should be well-considered, since easy problems could not challenge experienced player,
while rare word like ”rebus” or ”tapir” make most fans frustrated[10]. Therefore, a quantitative model
to predict distribution of attempts according to a given word is also expected.
1.2 Restatement of the Problem
Considering the background, in this paper we are required to solve the following problems:
• Task 1: Combine the game mechanics of Wordle to build a set of indicators that reflect the
attributes of words, and apply them to the subsequent model.
• Task 2: Develop a model that explains the trends in the number of reported results and the
percentage of scores reported that were played in Hard Mode, and use it to predict the number of
reported results on March 1, 2023. Further, analyze the effect of word attributes on the percentage
of scores reported that were played in Hard Mode.
• Task 3: Develop a model that can predict the distribution of the reported results based on words
and use it to predict the distribution for the word EERIE on March 1, 2023. In addition, illustrate
the uncertainty and accuracy of the model.
• Task 4: Classify words according to their difficulty and explain the relationship between the
attributes of the words and the difficulty of the words.
• Task 5: Perform a comprehensive analysis of the dataset, and give some interesting conclusions.
Team 2318036 Page 4 of 24
1.3 Our Work
Figure 1: Flow chart of our work
Firstly, we constructed four types of indicators that can measure the familiarity, composition
features, degree of association and degree of confusion of words, and used these indicators to reflect
the attributes of words.
Secondly, we developed the T2PL Model based on the SIR model, a dynamic model that can well
explain the overall trends in the number of reported results and the percentage of reported Hard Mode
results. Based on this, we explored the effect of word attributes on the percentage of reported Hard
Mode results.
Thirdly, we used the algorithm to simulate the strategies of wordle players when guessing words,
so as to simulate the initial distribution of results. Considering the psychological characteristics of
players, we added parameters indicating players’ willingness to share their scores, and simulated the
final distribution of reported results.
Fourthly, we clustered the words according to the distribution of scores and classified the words
into 3 classes based on difficulty. The clustering results were used as labels to construct a Random
Forest Model for classifying words’ difficulty based on their attributes.
Finally, based on the results of the above model, we conducted further exploration and found some
interesting conclusions.
2 Assumptions and Notations
2.1 Model Assumptions
Considering the conditions required for modeling, we make following assumptions:
Team 2318036 Page 5 of 24
• Assumption 1: There will not be a shift in the general trend of Wordle’s daily user number.
Justification:This is required to predict future trend based on observed daily usage.
• Assumption 2: Most players use rational strategies.
Justification: To establish a mathematic model for potential player, it is necessary to assume
that they are actually using a strategy and will not take unessential moves. Otherwise, it would
become meaningless to simulate result based on potential strategies.
• Assumption 3: There is no significant change in players’ skill along time.
Justification: As Wordle is played for a period, players are expected to improve their strategies
which might affect attempt times distributions at different date. However, experienced players
are giving up Wordle while rookies are joining simultaneously, producing an opposite effect. It
would be too complicated to consider these possibilities.
• Assumption 4: In task 2 (T2PL Model), player and those who share their result are not distin-
guished.
Justification: For convenience, players are modelled in Task 2, although Twitter report numbers
are actually used. This is because there is not enough information to distinguish between the two
categories in this step, and it makes sense to switch from modelling players to modelling players
who share their results.
2.2 Notations
Symbol Definition Symbol Definition
𝑁 Number of reported results 𝑃 Number of all players
𝐻 Number of reports in Hard Mode 𝑃
𝑙𝑜𝑦
Number of loyal players
𝑃
𝐻
Percentage of scores reported that
were played in Hard Mode.
𝑃
𝐻
= 𝐻/𝑁 × 100%
𝑃
𝑔𝑒𝑛
Number of general players
𝐷
All words of length 5 in dictionary
data
𝑊
𝑠 𝑗
Probability of sharing when
finishing with j tries
𝑇 Number of Targeted Population
𝑝
𝑖 𝑗
Probability of solving Wordle #i
with j tries
Table 1: Symbol table.
Word attribute indicators is not included, because they are explaned in detail below.
3 Data Preprocessing
The dataset Problem_C_Data_Wordle.xlsx contains 359 days of Wordle report information.
Each row consists of date, the word of the day, the number of reported results, the hard mode results,
and the distribution of each number of attempts. There are no missing values in the table, but on closer
inspection several words are misspelled. We manually correct each of these by searching for the correct
Wordle answer using the question number for that day.
剩余23页未读,继续阅读
资源评论
阿拉伯梳子
- 粉丝: 1671
- 资源: 5735
上传资源 快速赚钱
- 我的内容管理 展开
- 我的资源 快来上传第一个资源
- 我的收益 登录查看自己的收益
- 我的积分 登录查看自己的积分
- 我的C币 登录后查看C币余额
- 我的收藏
- 我的下载
- 下载帮助
最新资源
- Spring Cloud Alibaba(基础) 学习笔记
- Minitab中进行因子设计
- 一款超级简单的导航条管理工具
- vue生命周期图,vue生命周期图
- element-icons
- vs图书管理系统框架 winform + c# + sqlserver + 界面美化
- 基于Springboot的学生成绩管理系统-Java项目-毕业设计
- 基于vue+springboot在线考试系统 框架 idea + vscode + html + css + vue + jav
- shell脚本监控docker容器和supervisor 运行情况
- 图书管理系统框架 winform + c# + sqlserver + 界面美化
资源上传下载、课程学习等过程中有任何疑问或建议,欢迎提出宝贵意见哦~我们会及时处理!
点击此处反馈
安全验证
文档复制为VIP权益,开通VIP直接复制
信息提交成功