没有合适的资源?快使用搜索试试~ 我知道了~
2024年美赛35篇特等奖O奖论文-E-2400860.pdf
1.该资源内容由用户上传,如若侵权请联系客服进行举报
2.虚拟产品一经售出概不退款(资源遇到问题,请及时私信上传者)
版权申诉
0 下载量 53 浏览量
2024-05-06
11:41:26
上传
评论
收藏 1.52MB PDF 举报
温馨提示
试读
27页
大学生,数学建模,美国大学生数学建模竞赛,MCM/ICM,2024年美赛特等奖O奖论文
资源推荐
资源详情
资源评论
Veils of Uncertainty: Weaving Risk into the Tapestry of Preservation
Under the Weather's Watch
Summary
As the tapestry of nature weaves its unpredictable patterns, humanity’s quest for stability
becomes ever more pressing. In the shadow of uncertainty, we find resilience, crafting shields
against the tempests of fate.
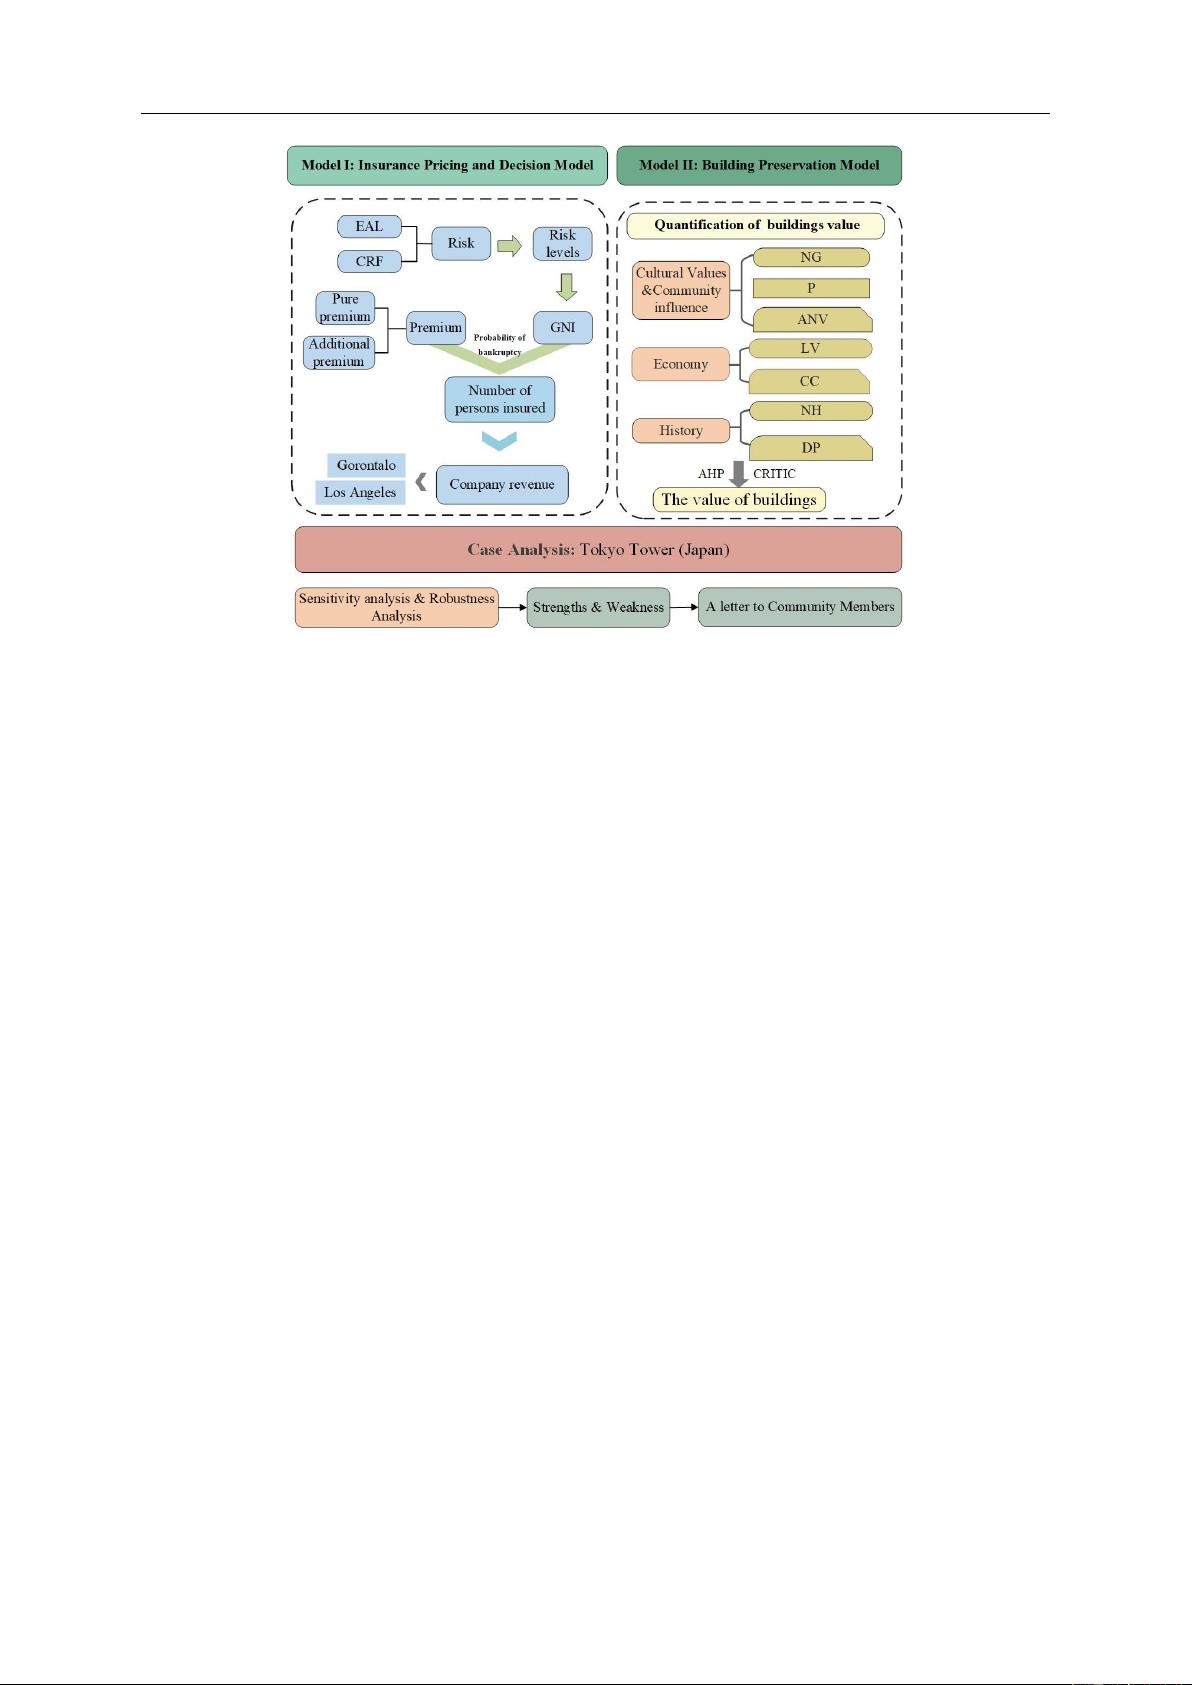
First, we establish a Risk Analysis model to comprehensively assess the Expected An-
nual Loss (EAL) from extreme weather in terms of population, building, and agriculture. The
assessment for each aspect is calculated from three perspectives: natural hazard exposure, His-
toric Loss Ratio, and the likelihood risk factor of natural hazard annualized frequency. Com-
munity Risk Factor (CRF) is calculated from social vulnerability and community resilience.
EAL and CRF are used to quantify the risk levels of various regions and rank them using the
K-means algorithm, resulting in a risk level map of the United States.
Second, we develop a Risk-incorporated Capital Asset Pricing Model (CAPM) to aid
insurance companies in underwriting decisions. This model combines market return rates, the
risk-free rate, and bankruptcy theory with a 10% bankruptcy probability to set insurance rates.
It evaluates if the region's residents can afford these premiums, providing decision-making ad-
vice for insurance companies.
More specifically, we apply our Risk-incorporated Capital Asset Pricing Model in Los
Angeles and Gorontalo. In Los Angeles, insurance companies see high profits and low risks.
However, in Gorontalo, the required premium for $10,000 coverage is $342.745, beyond local
affordability. We recommend insurance securitization and partnerships with local govern-
ments to reduce premiums. Consequently, Gorontalo residents could pay just $137.25 annually,
with companies projecting $245 million in revenue.
Third, we establish a Building Preservation Model, selecting seven secondary indicators
such as the annual number of visitors and construction cost, and three primary indicators: cul-
tural values and community influence, economy, and history. These are weighted using the
Sperman-CRITIC algorithm and AHP method to calculate building value, combined with
risk levels to determine the preservation level of buildings. Based on the preservation level, the
community's investment and measures for building protection can be determined.
Then our models inform investment and protection strategies for Tokyo Tower, acknowl-
edging its value and the necessity of preservation in an earthquake zone. We communicate these
findings and propose protection measures to the Tokyo Tower community.
Finally, we analyze the sensitivity and robustness of our models, the models can change
the insurance rate sensitively according to the change of the market predicted return and the
slight error of the risk factor calculation will not affect the models’ result, which verifies the
sensitivity and robustness of our models. In addition we analyze the strengths and weaknesses
of the models.
Keywords: Risk Analysis, Risk-Capital Asset Pricing Model, Sperman-CRITIC, AHP,
Building Preservation Model.
Problem Chosen
E
2024
MCM/ICM
Summary Sheet
Team Control Number
2400860
Team # 2400860 Page 2 of 27
Contents
1 Introduction ...................................................................................................... 4
1.1 Problem Background ....................................................................................................... 4
1.2 Restatement of the Problem ............................................................................................. 4
1.3 Our Work .......................................................................................................................... 4
2 Assumptions and Justifications ....................................................................... 5
3 Notations ........................................................................................................... 5
4 Insurance Pricing and Decision Model .......................................................... 6
4.1 Data Collection ................................................................................................................ 6
4.2 Risk Analysis ................................................................................................................... 6
4.2.1 The Expected Annual Loss(EAL) ........................................................................... 6
4.2.2 Community Risk Factor ......................................................................................... 7
4.2.3 Risk Calculation ..................................................................................................... 8
4.3 Insurance Premium .......................................................................................................... 9
4.4 Measures ........................................................................................................................ 13
4.4.1 Insurance Securitization ....................................................................................... 13
4.4.2 Co-operation with the Government ...................................................................... 13
4.4.3 The Implementation of Measures ......................................................................... 14
4.5 Real Estate Decision Making ......................................................................................... 14
5 Building Preservation Model ........................................................................ 16
5.1 Building Value Quantification ....................................................................................... 16
5.1.1 Indicators Determination ...................................................................................... 16
5.1.2 Weight Calculation ............................................................................................... 17
5.1.3 Quantitative Results of Building Values ............................................................... 19
5.2 Determination of protection measures ........................................................................... 20
5.2.1 Measure Score ...................................................................................................... 20
5.2.2 Score of Protection Measures ............................................................................... 20
5.2.3 Mentoring for Community Leaders ...................................................................... 20
6 Landmark Case Analysis ............................................................................... 21
6.1 Insurance Pricing for Tokyo Tower ................................................................................ 21
6.2 Architectural Value of Tokyo Tower .............................................................................. 21
7 Sensitivity and Robustness Analysis ............................................................. 22
7.1 Sensitivity ...................................................................................................................... 22
7.2 Robustness ..................................................................................................................... 23
Team # 2400860 Page 3 of 27
8 Model Evaluation ........................................................................................... 23
8.1 Strengths ........................................................................................................................ 23
8.2 Weaknesses .................................................................................................................... 23
References .......................................................................................................... 23
Team # 2400860 Page 4 of 27
1 Introduction
1.1 Problem Background
Extreme weather events are becoming more frequent due to climate change. As the eco-
nomic costs of disasters rise, how should the insurance industry respond to losses? Extreme
weather events cause untold human suffering but and ever-growing economic costs.
Catastrophic risks consequently cause a variety of problems for insurers. First, because
the losses arise from a small number of lumpy events, the insurer may not have sufficient re-
sources to cover the losses. Less dramatically, the firm may suffer losses well in excess of the
value of the premiums that it charged for the coverage. In the absence of adequate reinsurance,
the firm may go bankrupt or may choose to exit a state in which there is a substantial exposure
to such catastrophic risks. The unexpected catastrophes or blockbuster events maybe raise the
rate that firms charge for insurance. Thus, for any given number of policies written, the total
premiums will rise
[1]
.
The impact of natural disasters is equivalent to a $520 billion loss in annual consumption,
and forces some 26 million people into poverty each year. Given the gradual increase in the
number of extreme-weather events in the world, how to realize the sustainability of property
insurance is a great challenge we need to address.
1.2 Restatement of the Problem
Considering the background information and restricted conditions identified in the prob-
lem statement, we need to solve the following problems:
➢ Problem 1: The property insurance industry faces a crisis from increased extreme
weather events caused by climate change, leading to higher claims and premiums.
➢ Problem 2: Insurance companies must decide on underwriting policies in weather-af-
fected regions, balancing risk and long-term viability.
➢ Problem 3: Participants are tasked with creating a model to assist in underwriting deci-
sions and a preservation model for community leaders to protect significant buildings.
➢ Problem4: The models should be applied to specific areas and a historic landmark, with
recommendations for future insurance and preservation strategies.
1.3 Our Work
In order to clearly illustrate our work, we draw the flowchart Figure 1.
Team # 2400860 Page 5 of 27
Figure 1: Our work
2 Assumptions and Justifications
Considering those practical problems always contain many complex factors, first of all,
we need to make reasonable assumptions to simplify the model, and each hypothesis is closely
followed by its corresponding explanation:
Assumption: The data we use are accurate and valid.
Justification: Our data is collected from the World Bank and some other official web
sites and research papers. it’s reasonable to assume the high quality of their data.
Assumption: The regions under study will remain peaceful and stable, with no signifi-
cant events other than natural disasters occurring in the foreseeable future.
Justification: A stable capital market environment provides a predictable framework
within which we can project our expected returns. It is important to note that this as-
sumption does not negate the potential impact of natural disasters.
Assumption: The estimated figures for each region represent an average level of per-
formance or condition for that area.
Justification: For the purposes of this study, treating each region as a cohesive entity
allows for a more streamlined analysis. This methodological approach simplifies the
complexity inherent in regional studies by focusing on aggregate data, thereby provid-
ing a generalized view of each area's performance or condition.
3 Notations
The key mathematical notations used in this paper are listed in Table 1.
剩余26页未读,继续阅读
资源评论
阿拉伯梳子
- 粉丝: 1654
- 资源: 5735
上传资源 快速赚钱
- 我的内容管理 展开
- 我的资源 快来上传第一个资源
- 我的收益 登录查看自己的收益
- 我的积分 登录查看自己的积分
- 我的C币 登录后查看C币余额
- 我的收藏
- 我的下载
- 下载帮助
安全验证
文档复制为VIP权益,开通VIP直接复制
信息提交成功