没有合适的资源?快使用搜索试试~ 我知道了~
2016美国大学生数学建模特等奖论文集(ICM,含赛题)E53494.pdf
1.该资源内容由用户上传,如若侵权请联系客服进行举报
2.虚拟产品一经售出概不退款(资源遇到问题,请及时私信上传者)
版权申诉
0 下载量 23 浏览量
2024-03-17
21:57:53
上传
评论
收藏 443KB PDF 举报
温馨提示
![preview](https://dl-preview.csdnimg.cn/88982088/0001-0d27a55e57c77917fc769f6c87183ecc_thumbnail.jpeg)
![preview-icon](https://csdnimg.cn/release/downloadcmsfe/public/img/scale.ab9e0183.png)
试读
29页
美国大学生数学竞赛获奖论文,历届,单项文件,内容丰富,大学生数学,数学竞赛,参考资料,极具参考价值
资源推荐
资源详情
资源评论
![zip](https://img-home.csdnimg.cn/images/20210720083736.png)
![pdf](https://img-home.csdnimg.cn/images/20210720083512.png)
![doc](https://img-home.csdnimg.cn/images/20210720083327.png)
![](https://csdnimg.cn/release/download_crawler_static/88982088/bg1.jpg)
For office use only
T1
________________
T2
________________
T3
________________
T4
________________
Team Control Number
53494
Problem Chosen
E
For office use only
F1
________________
F2
________________
F3
________________
F4
________________
2016
MCM/ICM
Summary Sheet
(Your team's summary should be included as the first page of your electronic submission.)
Type a summary of your results on this page. Do not include the name of your school, advisor, or team members on this page.
Although readily available to many of the world’s citizens, clean water has become a scarce
resource in much of the world. Rising consumption and over-withdrawal have critically stressed the
water supply in developed and developing regions alike. The increasing frequency of droughts in
California and the massive water deficits of large Arab cities such as Dubai are both indicators of this
global problem. Continuing growth in population and the onset of climate change will only
exacerbate this crisis in the years ahead. A study conducted by the United Nations Department of
Economics and Social Affairs predicted that by 2025, approximately two-thirds of the world’s
population will be living in water-stressed regions.
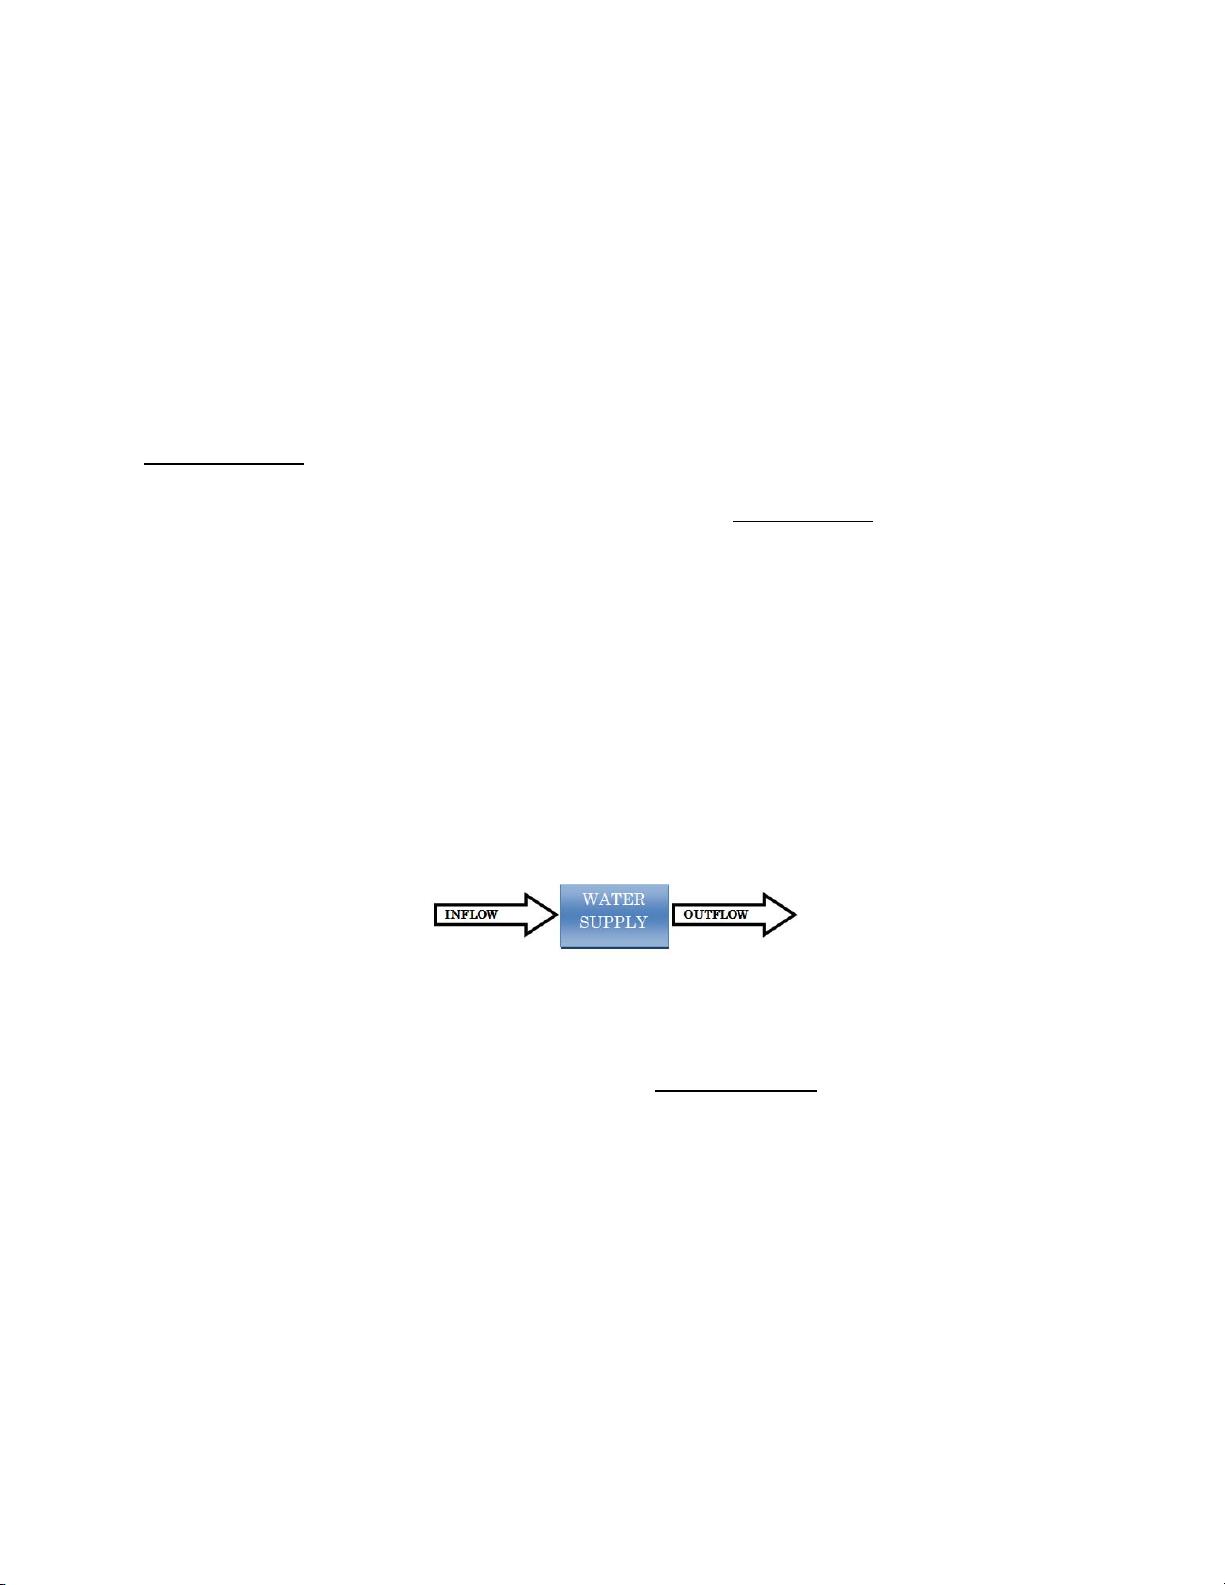
In modeling this complicated issue, we designed a flow model based on time constrained
functions of withdrawal. These functions were associated to changing populations, GDP growth, and
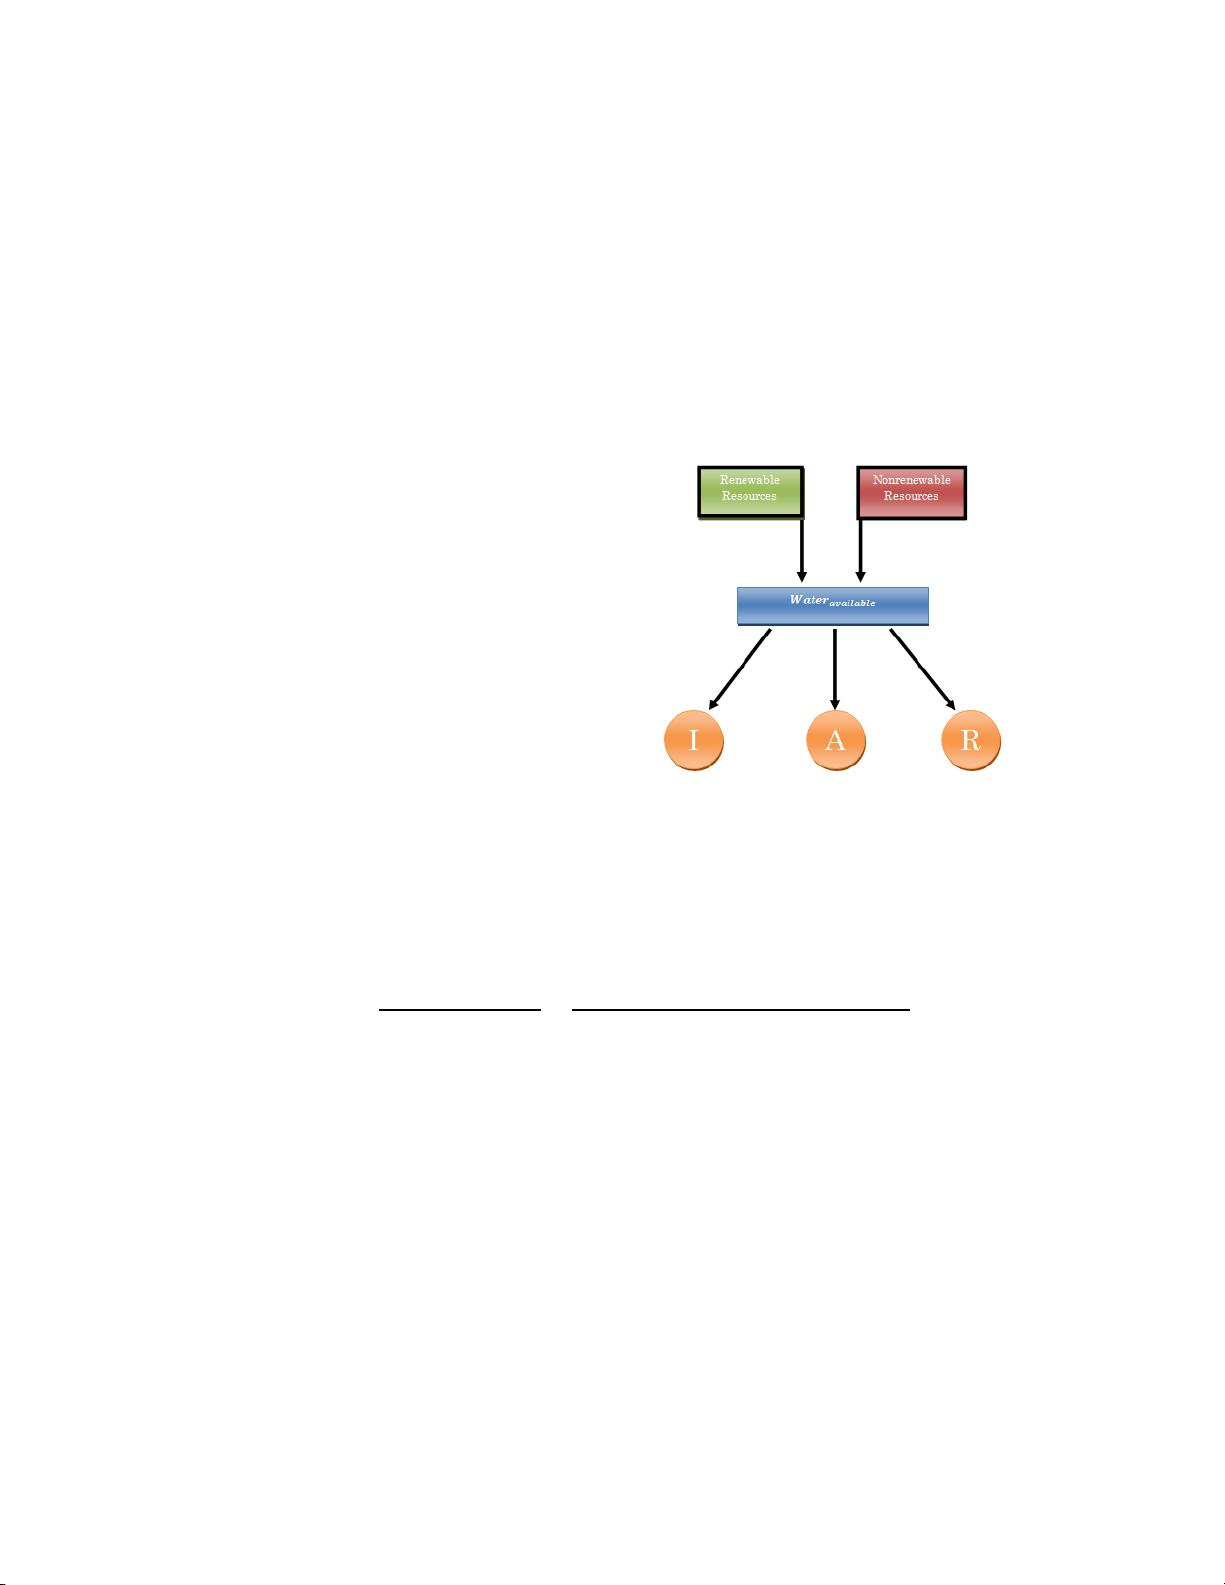
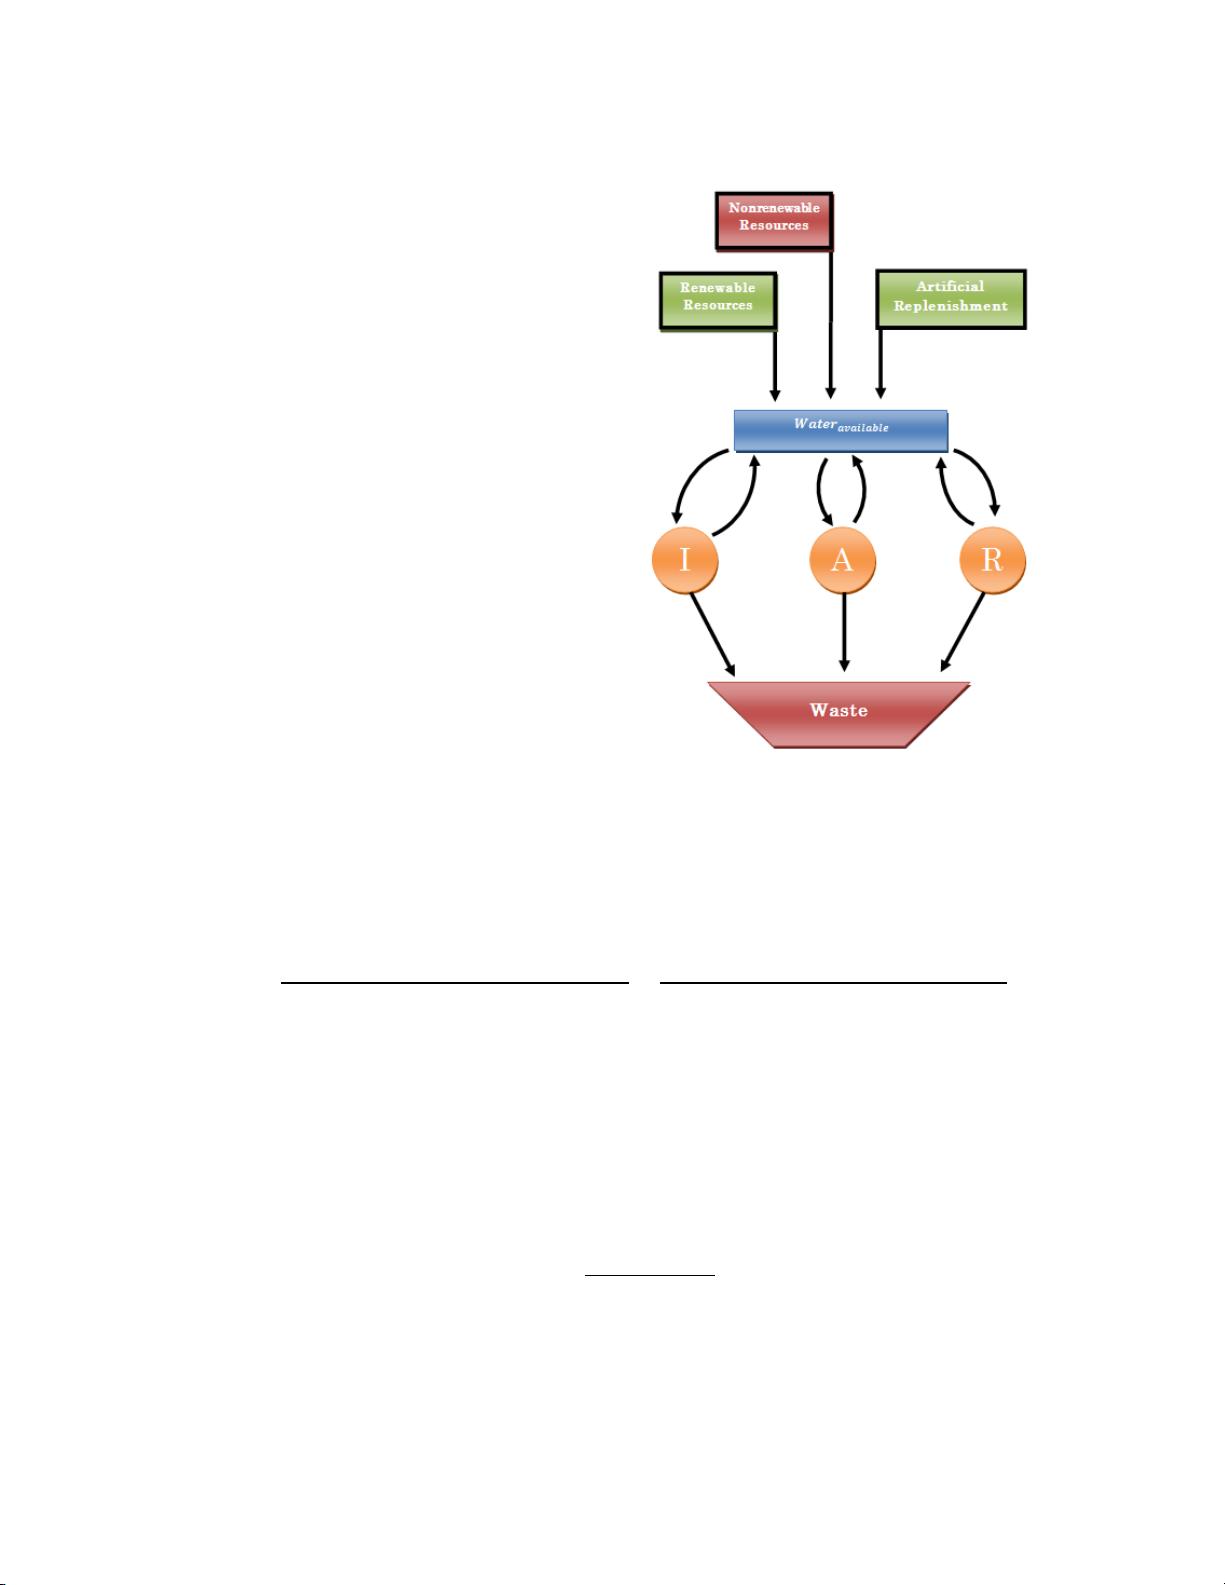
the effects of climate change. The demand functions were separated by sector (agricultural,
residential, and industrial) and the supply functions by water source. This theoretical conception of
the functions as inflow and outflow provided us with a general metric to measure water
stress/scarcity; we termed this water deficit as equal to water consumed per year over the sustainable
water resources available.
For our case study, we choose to investigate Egypt, because despite having well-developed
infrastructure and pursuing sustainability efforts, the country still experiences water scarcity. In our
research, we found Egypt’s current water deficit to be 102%. By 2030, we predict this could go as high
as 161% if no actions are taken. We believe that with Egypt’s unchecked population growth, this
scarcity has been driven by the country’s massively inefficient irrigation system and overreliance on
agriculture. Thus, we focused our intervention plan on these decisive factors. Our proposal consists
of:
1. Increasing irrigation efficiency (reducing net irrigation expenditures by 14km
3
/yr)
2. Importing 10 million tonnes of crops per year by 2024
3. Increasing residential and industrial renewal to 15km
3
/yr
4. Strengthening the Nile Basin Initiative to protect against volatility
5. Using short-term withdrawals of ~35km
3
from the Nubian Aquifer to cover the
current deficit
We predict that these measures will reduce Egypt’s water deficit to below 100% by 2020 and result in
a sustainable 78% by 2030. Additionally, this will increase the available water resources by 40km
3
in
2030 alone and will produce 484km
3
over the fifteen year period. Ultimately, accomplishing these
goals will require intensive infrastructure development and international cooperation.
![](https://csdnimg.cn/release/download_crawler_static/88982088/bg2.jpg)
Team 53494 ICM 2016 1
Contents
Introduction ……………………………………………......….…………………………….. 1
The Water Scarcity Model ...………………………………….……………………………. 2
Analysis of the Model ...……………………………………….……………………………. 8
Case Study: Egypt …………………………………………………………………………... 9
Intervention Proposal ……………………………………………………………………… 17
Conclusion……………………………………………………………………………………. 20
1 Introduction
Although inconceivable to many citizens of wealthy nations, in much of the
developing world clean, drinkable water has become a scarce resource. Across the
world, 2.4 billion people lack access to improved sanitation facilities and approxi-
mately 80% of waste water is dumped into primary water sources.
i
In addition to
pollution and economic mismanagement, many regions of the world experience the
water problems simply due the burdens of expanding populations coupled and the
decreasing water supplies caused by climate change. The United Nations defines
water stress as annual water supplies of less than 1700 m
3
per person, water scarci-
ty as less than 1000 m
3
per person, and absolute water scarcity as less than 500 m
3
per person. However, this relative lack of water available to a region’s population
may have several different causes. The Food and Agriculture Organization identi-
fies three main causes for such scarcity: a lack of fresh water of acceptable quality, a
physical shortage of water; a shortage of access to the water services, due to the
failure of responsible institutions to ensure reliable supply; a lack of adequate infra-
structure to capture the water, due to financial constraints. The first case is known
as physical scarcity; the latter two cases are known as economic scarcity.
However, despite never breaking into world headlines, the problem of water
scarcity has been developing for quite some time. The United Nations declared the
years from 2005 to 2015 to be
The Water for Life Decade
in order to raise awareness
and lead actions to address these problems.
ii
Unfortunately, many of the programs
goals were not achieved and the water scarcity problems are only expected to get
worse. One study conducted through the UN program found that by 2025 approxi-
mately two thirds of the world population will be living in water stressed regions.
iii
Thus, today it is perhaps even more urgent to find solutions to water scarcity before
the development of a global water crisis.
1.1 Problem Statement
As tasked by the International Clean Water Movement, this study focuses on
using quantitative models and predictions to find sustainable solutions to water
scarcity around the world. Specifically, we will focus on the case study of Egypt to
illuminate the problems facing much of the developing world and create potential
answers to those threats. This study has inherent challenges; not only is reliable
![](https://csdnimg.cn/release/download_crawler_static/88982088/bg3.jpg)
Team 53494 ICM 2016 2
data hard to obtain but mathematical predictions require difficult assumptions that
may not always match the full dataset. Therefore, our intervention plan and rec-
ommendations have been tempered by our research and knowledge of the real
world.
2 The Water Scarcity Model
Though the lack of clean water is viscerally real to the people living in water
stressed regions, it can be difficult to capture with quantified data. Thus to facili-
tate proper analysis, careful definitions of the terms are necessary. First, we define
water scarcity
as the inability of a region to fulfill its population’s water require-
ments in a sustainable way. This can be measured by percent renewable water
withdrawn (for our purposes we will refer to this as water deficit
), calculated by di-
viding the actual water withdrawn in a given year by a region’s available renewable
water resources.
iv
Therefore, a nation is either experiencing or heading towards wa-
ter scarcity when percent renewable water withdrawn is negative. Using this metric
we can make predictions and policy recommendations at the most simple level by
analyzing the dynamics of water available (inflow or supply) and water withdrawn
(outflow or demand).
2.1 Basic Model and Assumptions
To begin the analysis, we decided to look at water deficit in its most basic
form, as a function of inflow and outflow. This conception gives us the general model
of water withdrawal as an open flow system.
In this model, we define the inflow to be the yearly renewable and nonrenewable
water resources available
/ and the outflow to be water usage per
year
/. As stated we take the following as our indicator of water scarcity:
Because of this definition, it follows that any deficit over one is withdrawing nonre-
newable water sources and is therefore unsustainable.
In modeling the usage of water with a flow model we make several key as-
sumptions. First that consumed is removed from the system. This assumption may
seem counterintuitive, because in real life water is never really destroyed but trans-
formed through the hydrological cycle. Although on a worldwide scale water flow
would behave as a closed flow network, for an individual country it is more akin to
an open system. Secondly, we assume that the system flow continuously. Therefore
all inflow is spent as outflow and no water is saved in “supply.” This likewise may
![](https://csdnimg.cn/release/download_crawler_static/88982088/bg4.jpg)
Team 53494 ICM 2016 3
seem counterintuitive, but is valid because water not used returns to system as re-
newable water inflow.
2.2 Refinements
Using this basic model as a starting point we now add key refinements that
expand the accuracy and reliability of our model while allowing for real world data
to be used. Our goal in these refinements is to separate and clarify all sources of in-
flow and outflow, which will later be modeled as functions of time.
A. Representing Inflow and Outflow as the Sum of Several Functions
Now, we adopt a more realistic
analysis and separate inflow and out-
flow into several variables. Specifically:
where I, A, and R are industrial, agri-
cultural and residential water
withdrawal respectively. The separa-
tion of inflow by renewability allows us
to model the effects of over-withdrawal,
climate change and pollution over time. The equation for outflow is based on the de-
lineation used by the UN Food and Agriculture Organization (FAO) to study what
factors drive water withdrawal over time.
v
To return to our measure of water scarcity, we can now use this model to fur-
ther refine our calculations.
![](https://csdnimg.cn/release/download_crawler_static/88982088/bg5.jpg)
Team 53494 ICM 2016 4
B. Adding Water Recycling and Artificial Replenishment
However, the previous model
still considers all water withdrawn as
consumed (removed from the system).
To account for this we made further
refinements by acknowledging that
not all water withdrawn is wasted and
that technologies enable artificially
expanding the water supply. First, a
portion of the water withdrawn by
each sector is not fully consumed but
is recycled back into the available wa-
ter supply. These recycling ratios
depend on the consumption sector (I,
A, or R), the infrastructure of the re-
gion and, in the case of agriculture,
the climate of the region. Secondly,
through technologies such as desalina-
tion, damming rivers (creating
strategic reservoirs), and renewing
polluted waters, a region can syntheti-
cally increase its water inflow. This
broad category will be referred to as artificial replenishment. To clarify the distinc-
tion between the two, water recycling is when used water is converted back into
usable water and artificial replenishment is when an unusable water source is con-
verted to usable water.
Introducing the new model’s components into our calculations of water defi-
cit, we derive:
Where I
con
is the amount of water consumed.
2.3 Functions of Withdrawal
Our goal now is to transition the general flow system in a combination of var-
ious functions of time. To accomplish we will discuss how the variable inputs into
water deficit can be associated to the either the growth of population over time or
climate change over time. As is standard, we decided to model population with a lo-
gistic model.
1
However, because climate change will affect separate regions differently, we
cannot assume a general model that will apply in all cases. In order to incorporate
剩余28页未读,继续阅读
资源评论
![avatar-default](https://csdnimg.cn/release/downloadcmsfe/public/img/lazyLogo2.1882d7f4.png)
![avatar](https://profile-avatar.csdnimg.cn/fcd62adb0120465d9af280215b0ff722_snowtshan.jpg!1)
阿拉伯梳子
- 粉丝: 1676
- 资源: 5736
上传资源 快速赚钱
我的内容管理 展开
我的资源 快来上传第一个资源
我的收益
登录查看自己的收益我的积分 登录查看自己的积分
我的C币 登录后查看C币余额
我的收藏
我的下载
下载帮助
![voice](https://csdnimg.cn/release/downloadcmsfe/public/img/voice.245cc511.png)
![center-task](https://csdnimg.cn/release/downloadcmsfe/public/img/center-task.c2eda91a.png)
安全验证
文档复制为VIP权益,开通VIP直接复制
![dialog-icon](https://csdnimg.cn/release/downloadcmsfe/public/img/green-success.6a4acb44.png)