没有合适的资源?快使用搜索试试~ 我知道了~
2016美国大学生数学建模特等奖论文集(ICM,含赛题)F44348.pdf
1.该资源内容由用户上传,如若侵权请联系客服进行举报
2.虚拟产品一经售出概不退款(资源遇到问题,请及时私信上传者)
版权申诉
0 下载量 134 浏览量
2024-03-17
21:58:09
上传
评论
收藏 8.68MB PDF 举报
温馨提示
试读
20页
美国大学生数学竞赛获奖论文,历届,单项文件,内容丰富,大学生数学,数学竞赛,参考资料,极具参考价值
资源推荐
资源详情
资源评论
For office use only
T1
________________
T2
________________
T3
________________
T4
________________
Team Control Number
44348
Problem Chosen
F
For office use only
F1
________________
F2
________________
F3
________________
F4
________________
2016 MCM/ICM Summary Sheet
Towards A Hopeful Journey
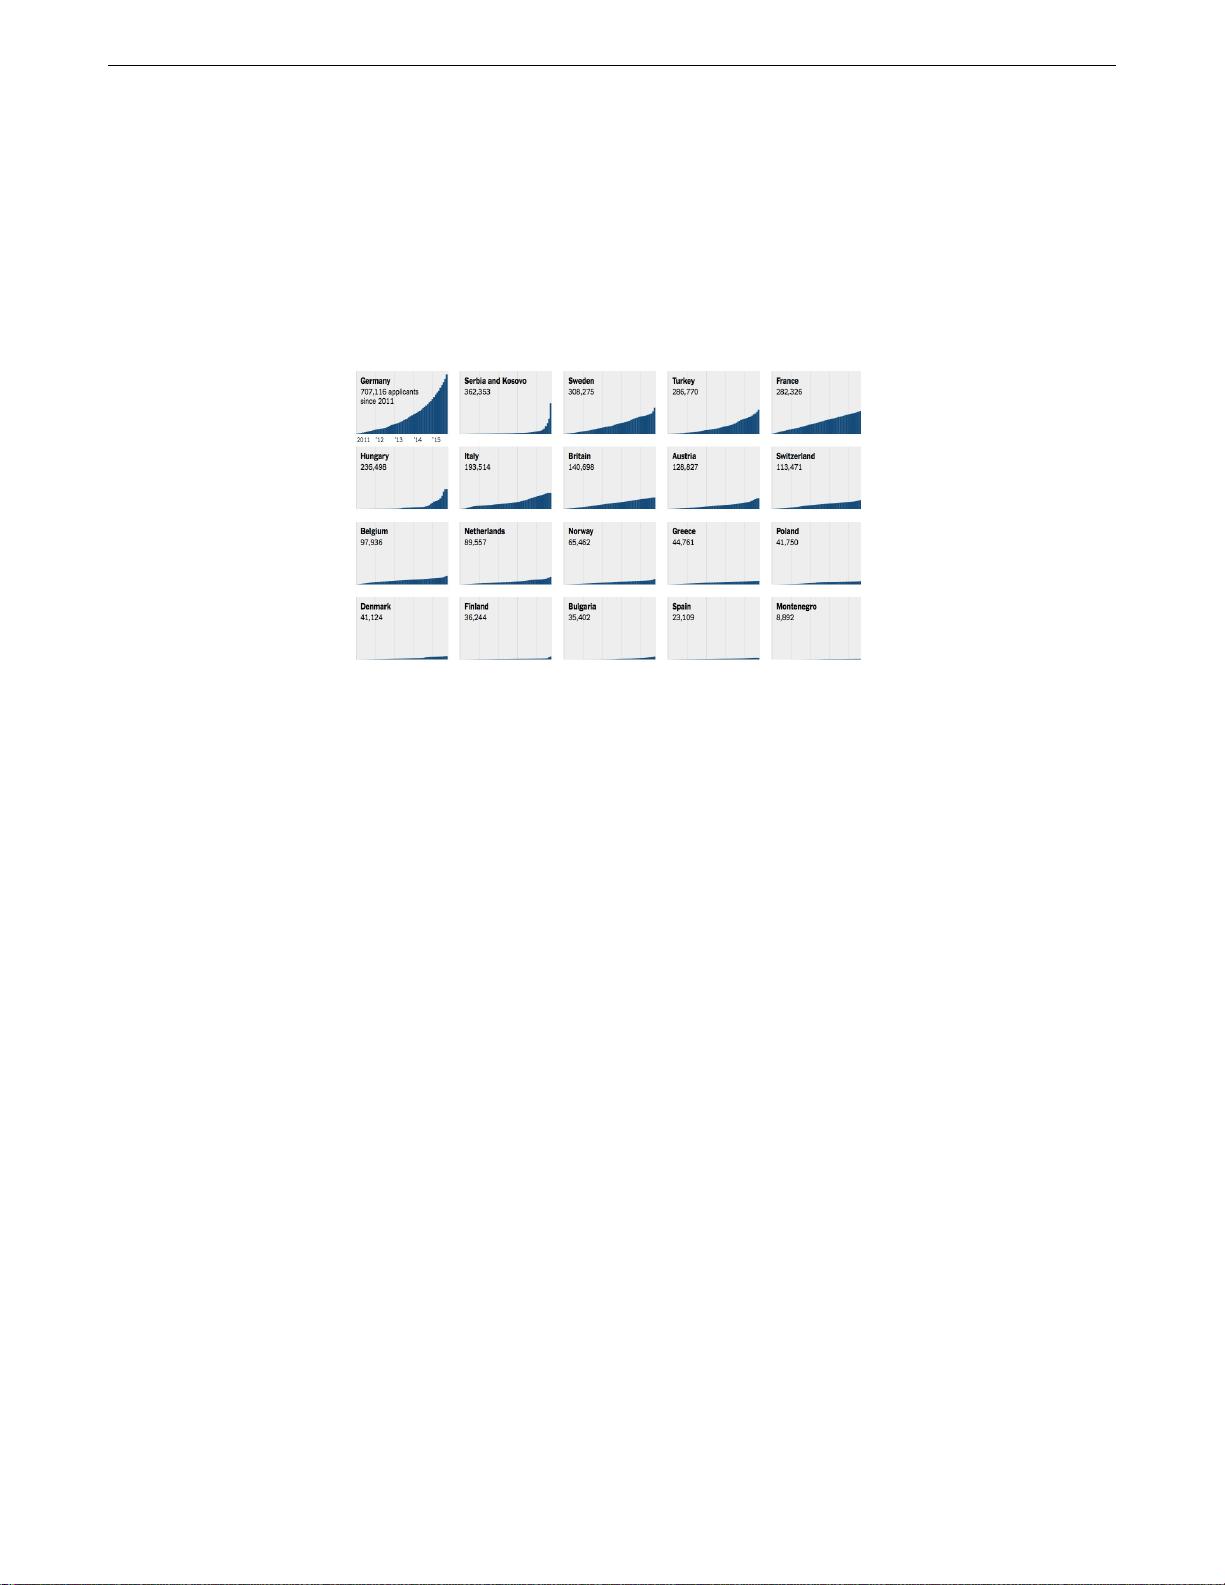
The world is witnessing the largest refugee crisis since the horrors of World War II. Modeling refugee
immigration, which is crucial to tackle the problem, is an intricate issue that should embrace the
sophistication of social interrelated systems, and take into the consideration of refugee crisis on local
conditions. Concerning the structure of refugee crisis and the routes of migration, with the official data in
2014, we construct a refugee migration model and build a feedback system using network analysis
methodology and Cellular automaton to make precise simulation aiming to help figure out a set of efficient
policies.
In the first place, we establish a set of metrics to consider the determinant factors in refugee migrations so
that we define our measures and indexes, after which we set the start points of six given routes as six nodes,
and choose 14 countries where most refugees gather to be the nodes in Africa and Central East. With the
assumption that the refugees migrate nearer and nearer to Europe, we divide the nodes into 4 layers based
on the distances from node to node using cluster analysis. In that way, the refugees migrate within the
layers.
After that, we assume that refugees get limited information and initially build a random migration model
to determine the migrating factors between 2 nodes. And by Matlab simulation we get result indicating the
main routes reaching Europe, but the numerical data is inconsistent with real data. Hence, we adjust our
presumptions and revise our model.
Next, inspired by Gravity Model, we analyze the factors that affect the migration of refugees and integrate
them into a comprehensive attraction index. By collecting and calculating the statistics, we figure out the
weight between two nodes and the ratios of population distribution at the six start points
(0.07:0.101:0.41:0.369:0.05), whose correlation coefficient with real data R=0.98. So we go on with revised
model to unravel the optimal flow distribution under different conditions and the measurement of weight
from node to node backed by single-period simulation.
In addition, we expand the scale of nodes. Given that the feedback information of refugees in different
periods and the maximum capacity in each node, we simulate the migration progress of refugees with
Cellular Automaton and C++, and the ratios of 3 nodes are 0.0362:0.537:0.427, R=1. Therefore, we get to
know about the influences of government and non-government organizations on refugee migration.
As for the policy, we attach significant importance to the empathy that the receiving population of each
country must fit the present refugee condition. By scaling up our model, we find that the routes get
saturated except for routes in North Africa and Central East, which may trigger the detention of refugees
and eventually lead to illegal immigration. Meanwhile, we work out the relations between the stability and
capacity of nodes by building a Cobweb Model. We find that the refugee flows tend to be more and more
stable in nodes with bigger capacity. So we also propose to stabilize the flows, which contributes to better
resource allocation and aid from GO and NGO.
Finally, we test the sensitivity of our model and conclude the strengths and weakness. The model is quite
reliable in small scale but still needs advancement for larger and more precise simulation.
Team #44348 page 1 of 18
Contents
1 Introduction 2
1.1 Background . . . . . . . . . . . . . . . . . . . . . . . . . . . . . . . . . . . . . . . . . . . . . . . . . . . 2
1.2 Our work . . . . . . . . . . . . . . . . . . . . . . . . . . . . . . . . . . . . . . . . . . . . . . . . . . . . 2
2 Metrics 2
3 Notations and Descriptions 3
4 Fundamental Assumptions 4
5 The Gravitational Refugee Movement Model 5
5.1 Initial Nodal weight analysis . . . . . . . . . . . . . . . . . . . . . . . . . . . . . . . . . . . . . . . . . . 5
5.2 Modified model added with gravitation theory . . . . . . . . . . . . . . . . . . . . . . . . . . . . . . . . 8
5.2.1 The relationship among the 6 routes . . . . . . . . . . . . . . . . . . . . . . . . . . . . . . . . . 8
5.2.2 Weight reanalysis and remodeling based on Gravity model . . . . . . . . . . . . . . . . . . . . . 8
5.2.3 Analysis on each factor . . . . . . . . . . . . . . . . . . . . . . . . . . . . . . . . . . . . . . . . 8
5.2.4 An optimal route . . . . . . . . . . . . . . . . . . . . . . . . . . . . . . . . . . . . . . . . . . . 10
5.2.5 Preposition Resource . . . . . . . . . . . . . . . . . . . . . . . . . . . . . . . . . . . . . . . . . . 12
6 Dynamic changes and Refugees 12
6.1 Dynamic simulation model of refugee migration based on Cellular Automaton . . . . . . . . . . . . . . 12
6.2 Non-paroxysmal factors . . . . . . . . . . . . . . . . . . . . . . . . . . . . . . . . . . . . . . . . . . . . 13
6.3 Accidental and irregular factors . . . . . . . . . . . . . . . . . . . . . . . . . . . . . . . . . . . . . . . . 14
7 Scalability 15
8 The Policy Strategy with Cobweb Model 15
9 Influence of Exogenous Events 16
9.1 The outbreak of the diseases . . . . . . . . . . . . . . . . . . . . . . . . . . . . . . . . . . . . . . . . . . 16
9.2 Terrorist attack . . . . . . . . . . . . . . . . . . . . . . . . . . . . . . . . . . . . . . . . . . . . . . . . . 16
9.3 How can our policy be resilient to Exogenous Events . . . . . . . . . . . . . . . . . . . . . . . . . . . 16
10 Sensitivity Analysis 17
11 Evaluation of the Model 17
11.1 Strengths . . . . . . . . . . . . . . . . . . . . . . . . . . . . . . . . . . . . . . . . . . . . . . . . . . . . 17
11.2 Weakness . . . . . . . . . . . . . . . . . . . . . . . . . . . . . . . . . . . . . . . . . . . . . . . . . . . . 17
12 Future Work 17
References 18
Team #44348 page 2 of 18
1 Introduction
1.1 Background
One of the most stressful and potentially destabilizing social challenges facing Europe, or in a wider scope the whole
world is the contemporary massive influx of refugees and migrants, which sparks tremendous pressure in the receiving
societies. One in every 122 people in the world is currently either a refugee, internally displaced or seeking asylum
because the ”world is a mess”[1], according to the head of the UN’s refugee agency. Despite the restrictive policies of
border control, the flows and volumes of international migrants via various routines keep on scaling up and arriving
in Europe disproportionately, as war, persecution and poverty continue to drive people away from their homes[2].
Figure 1: Total number of asylum applicants in European countries[3]
From the charts we can see that the asylum applicants in European countries are increasing strikingly over the past
5 years, leaving pressing concern.
Worse still, dozens of men, women and children have been killed especially while walking on railway lines on the long
trek through Macedonia, Serbia, Croatia and Hungary as well as taking perilous voyages over the Mediterranean
and Aegean seas in their desperation to flee ravage and reach safety. , thus the true number of arrivals is a lot
smaller than that of originals. According to the IOM (the International Organization for Migration), more than 3,
695 migrants are reported to have died trying to make the crossing in 2015[4]. Besides, among those who make way
to their destinations, only a scarce proportion of requests are granted (32% in 2014)[5]
It has become strikingly crucial to deal well with the sophisticated refugee migration, which is a social process well
structured and organized as a socio-spatial system[6, 7].
1.2 Our work
• We first elaborate reasonable metrics on various factors that affect the movement of refugees with statistics
and graphs from FRAN and UNHCR Online database, then we design our own evaluation system to measure
the factors that have been taken into consideration using clustering methodology.
• And we devise a comprehensive migration model based on the Gravity model and I. S. Lawry model to look for
an optimum refugee movement taking account the factors listed as well as dynamically adjusting with changing
refugee conditions so that they can possibly move from their countries of origin into safe haven countries, which
is validated by data from Eurostat Media and 2014 Statistical Yearbook.
• Besides, we present a policy to prioritize the optimal migration using fuzzy comprehensive evaluation method.
• Finally, we make a sensitivity analysis and discuss the merits and demerits of our model including an evaluation
on the scalability.
2 Metrics
Herein are the main factors influencing the refugee flows we take into consideration in our model.
• Safety index
Safety comes the first in terms of migration. The recent surge of popular interest in and increasing public
awareness of migrant deaths in the Mediterranean has turned the question of routine-related deaths into an
Team #44348 page 3 of 18
urgent matter. Reports of migrants threatened by smugglers, forcibly held by police or killed by criminals were
rare in the past but have been increasingly heard in the last few years. This rise appears to have coincided
with the growth in trafficking and smuggling , so too the wider use of guns.The increased instability on the
way to haven countries make many migrants panicked and threatened. On the other side, the war condition in
migratory place also contributes to this index. To propose a safety index becomes crucial.And the measurement
of this index defined as S
t
ij
(from place i to place j) is calculated by our model in the following.
• Environmental acceptance
The environmental acceptance C
ij
is undoubtedly significant as refugees whom we assume to be sensible will
compare the environment of the destination with that of the origin district i. Here, the environment acceptance
is not merely referred to living environment or maximum capacity in country j but also include three main
factors:
(1) Resource Abundance. Food supply and water availability is the basis of living. Besides,access to primary
health-care, referral systems, specialized health services, psychosocial-medical units and child health support
are all in need to cope with wound and trauma in a desired destination.
(2) Economic condition. The economic development level also determines whether the migrants can sur-
vive on.Education and communications systems, commercial installations are needed for the functioning of a
community. Many indicators such as social well-being of people, job opportunity and so on are considered. As
economist Amartya Sen points out, ”economic growth is one aspect of the process of economic development.”
In our model, we take GDP as the main indicator of economic condition.
(3) Religious and culture acceptance. Different communities have varied beliefs, which may lead to mis-
understandings, conflicts and discrimination. Whether a culture is inclusive plays a role. In addition, as official
languages, customs, ceremonies etc. vary from place to place, which might be a burden for communication
between migrants and local people, thus cultural acceptance
Migration groups especially vulnerable ones, like children, unaccompanied and separated minors, pregnant and
lactating mothers, the elderly, disabled and people look for a place of environmental acceptance, which has
been limited due to the desire by refugees and migrants to continue on with their journey and an unwillingness
to remain in unrest.
• Transportation index
To transport from place i to place j, one needs to balance a comprehensive transportation cost with regard
of time, distance and traffic condition related to the type of transportation etc..Thus a transportation index
Conv
i
is defined.
• Ratio of repatriation in period T
The quantity of refugees who get granted is limited in an entry point, thus the proportion of repatriates or
rejectees are relatively too high, then refugees are less likely to take on a routine head for that node. Therefore,
we also give a notation of B
t
representing the ratio of repatriation in a certain period T in order to better
solve the refugee crisis problem.
• Quantity of nodes
We premise that the quantity of refugees allowed to pass through an entry point is a constant, in this way, the
total number of people who get granted is determined by the number of entry points (node in model). P oint
j
i
is the i
th
entry point in place j. Evidently, the larger the number i, the larger pass probability will be for a
certain group, which affects the choice of refugees.
Taking all those parameters and measures into account, we can step further to define a set of notations in designing
a mathematical model.
3 Notations and Descriptions
Table 1.Notations and Descriptions we define in our model
剩余19页未读,继续阅读
资源评论
阿拉伯梳子
- 粉丝: 1674
- 资源: 5736
上传资源 快速赚钱
- 我的内容管理 展开
- 我的资源 快来上传第一个资源
- 我的收益 登录查看自己的收益
- 我的积分 登录查看自己的积分
- 我的C币 登录后查看C币余额
- 我的收藏
- 我的下载
- 下载帮助
安全验证
文档复制为VIP权益,开通VIP直接复制
信息提交成功