没有合适的资源?快使用搜索试试~ 我知道了~
美国农业部-美股-农业行业-饲料展望:预计在2021年会有创纪录的高产量-0514-26页.pdf
需积分: 0 0 下载量 132 浏览量
2023-07-26
14:25:05
上传
评论
收藏 257KB PDF 举报
温馨提示
试读
26页
美国农业部-美股-农业行业-饲料展望:预计在2021年会有创纪录的高产量-0514-26页.pdf
资源推荐
资源详情
资源评论
Approved by USDA’s World Agricultural Outlook Board
Feed Outlook
Tom Capehart
Olga Liefert
David Olson
Record-High Crop Projected For 2020/21
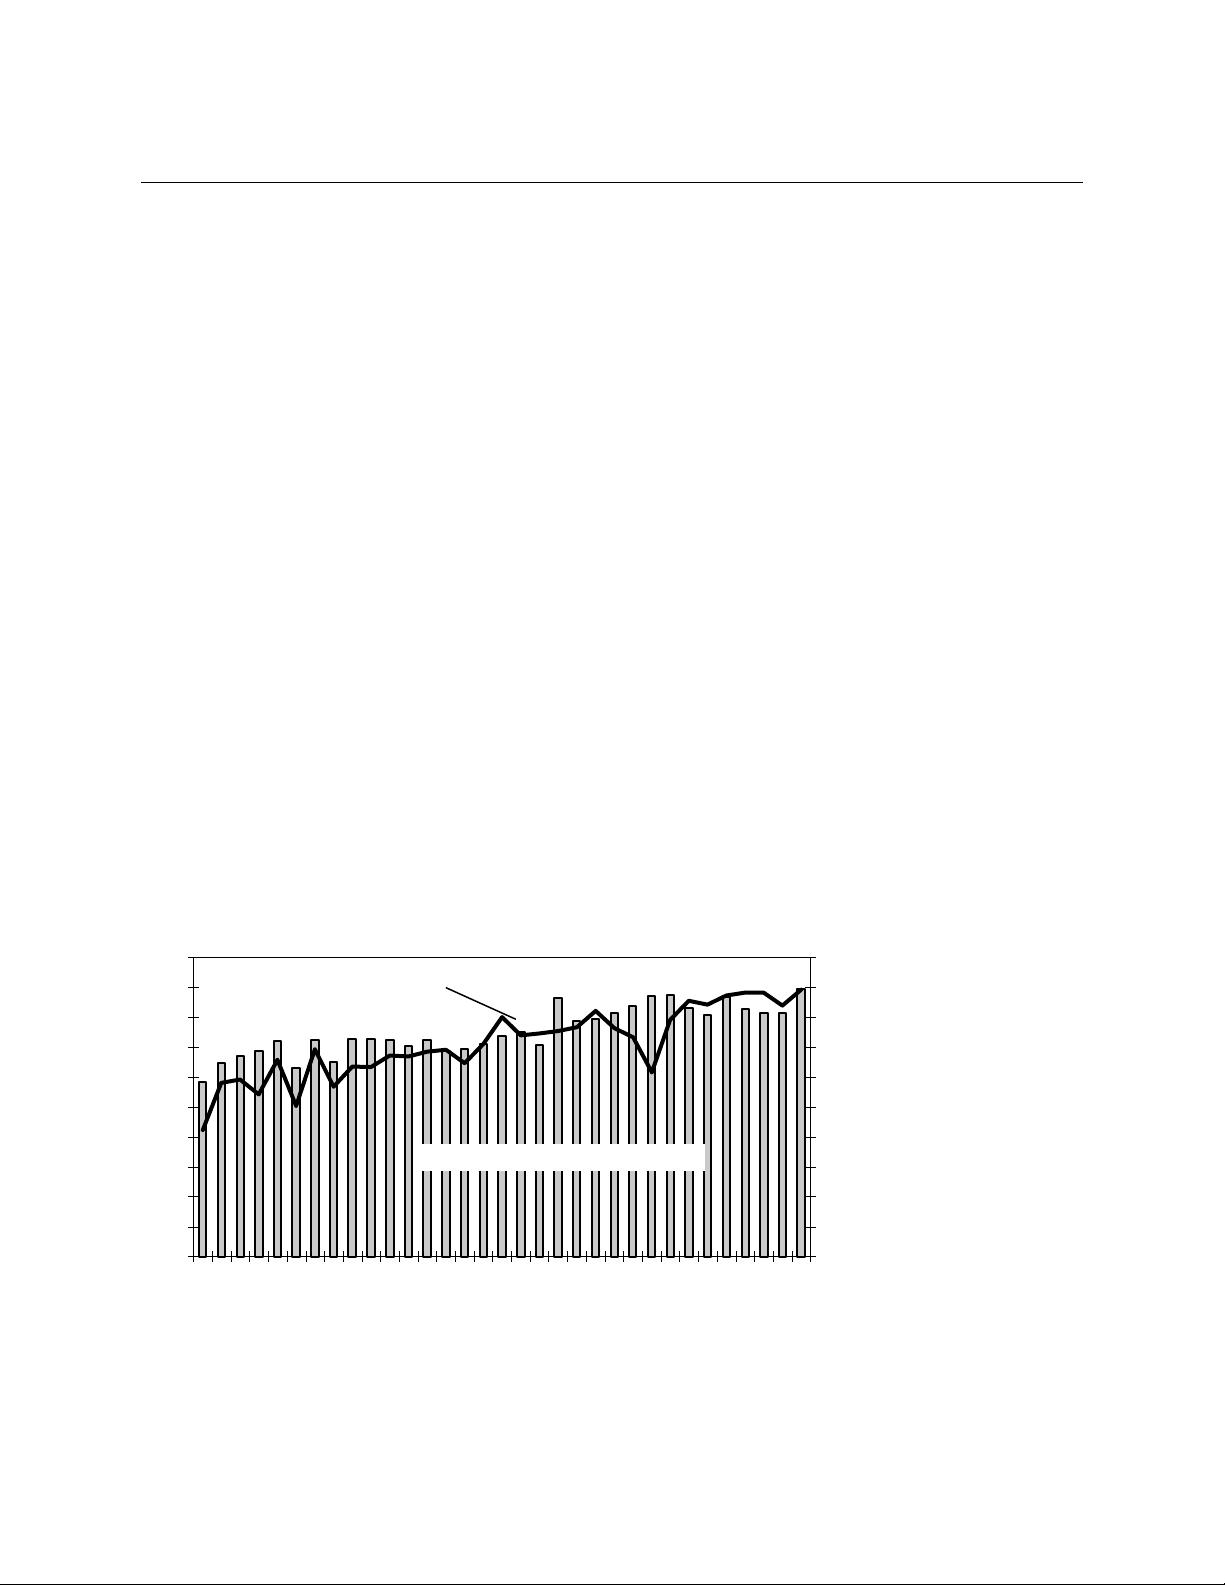
The 2020/21 U.S. corn crop is forecast to be a record high 16.0 billion bushels. In spite of lower carryin,
supplies will still reach a record 18.1 billion bushels. Corn use is also projected at a record level as
food, seed, and industrial (FSI) use, feed and residual use and exports all increase from the 2019/20
COVID-19 impacted levels. Total use is projected at 14.8 billion bushels. Ending corn stocks of 3.3
billion bushels are up 1.2 billion bushels from last year and, if realized, would be the highest since
1987/88. The stocks-to-use ratio is the highest since 1992/93, contributing to a $0.40 per bushel
reduction in the projected season average price of corn to $3.20.
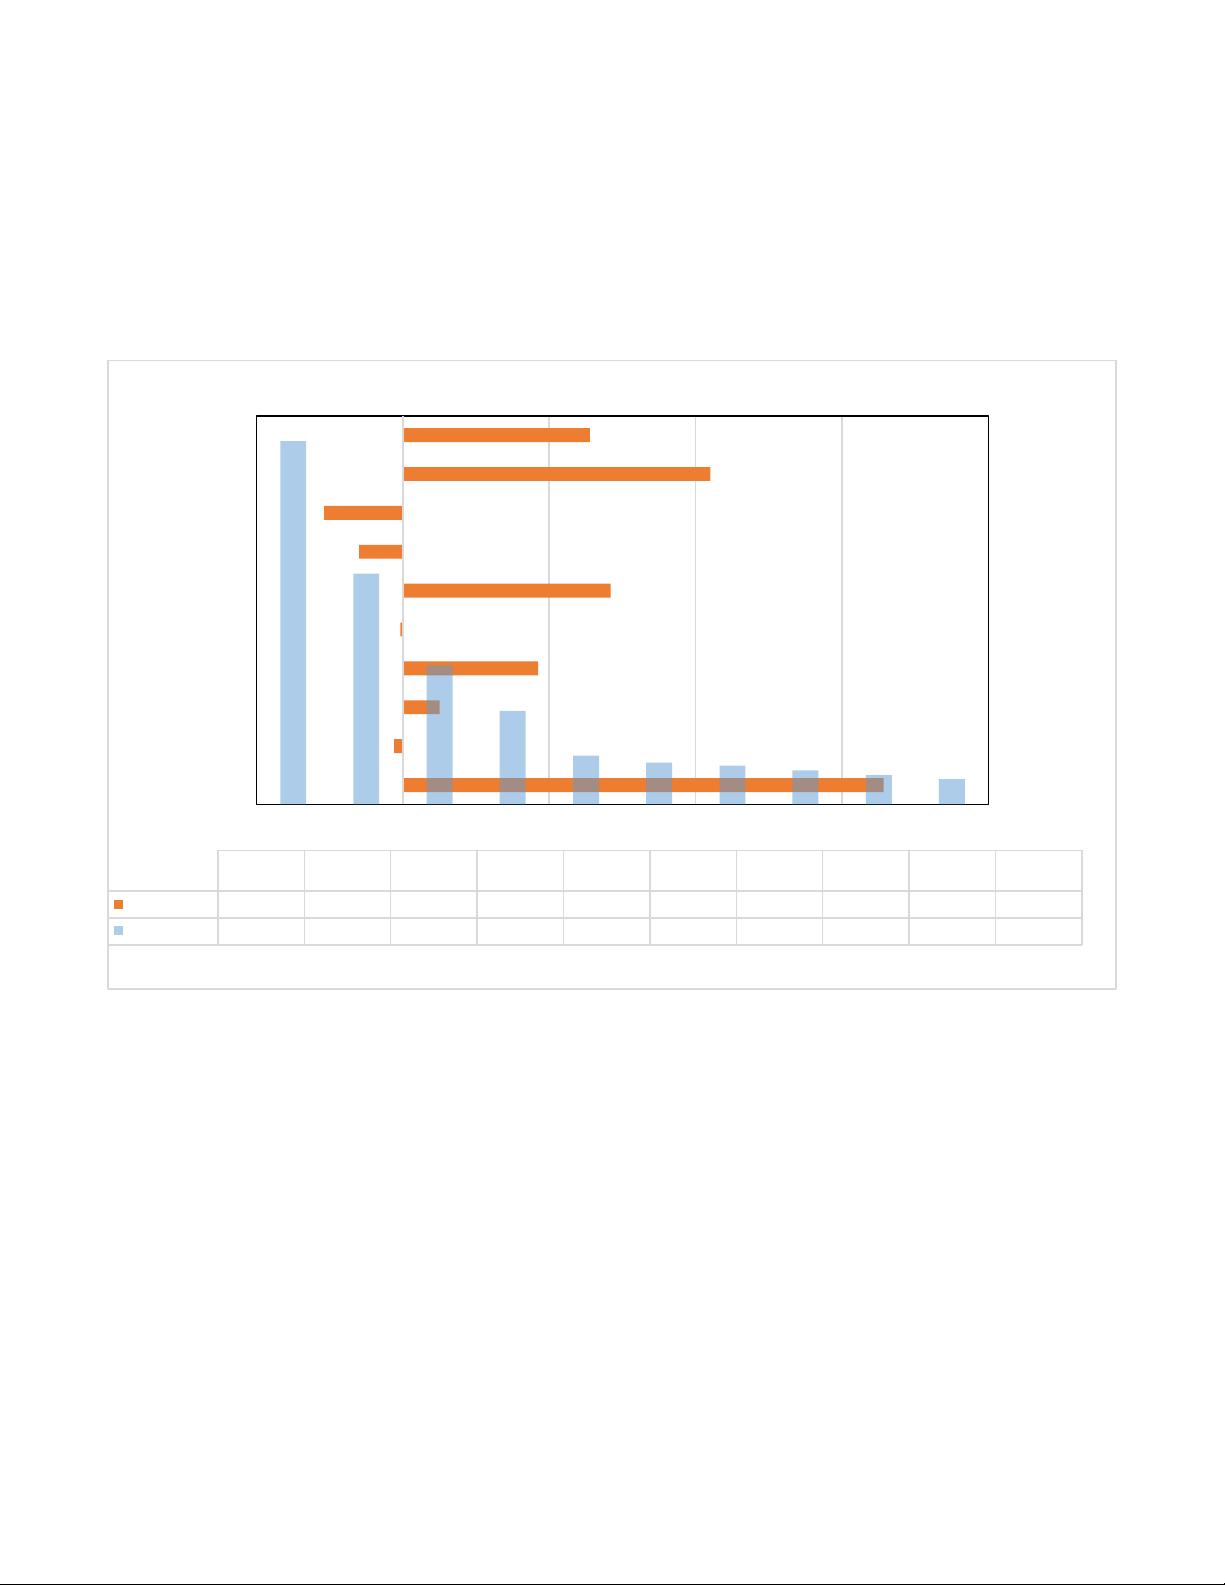
Global 2020/21 coarse grain production is projected at a new record of 1.5 billion tons, with a rebound
in the United States and large crops in Brazil, Argentina, and Ukraine. Despite record-high corn
production prospects, U.S. 2020/21 corn exports face tough competition and are projected at a mere 30
percent of global corn trade, while Brazil, Argentina, and Ukraine are expected collectively to have a 58
percent export share. Sorghum exports are boosted for both 2020/21 and 2019/20, based on growing
demand from China. Coarse grain use affected by the pandemic in 2019/20 is projected down, but
recovering in 2020/21.
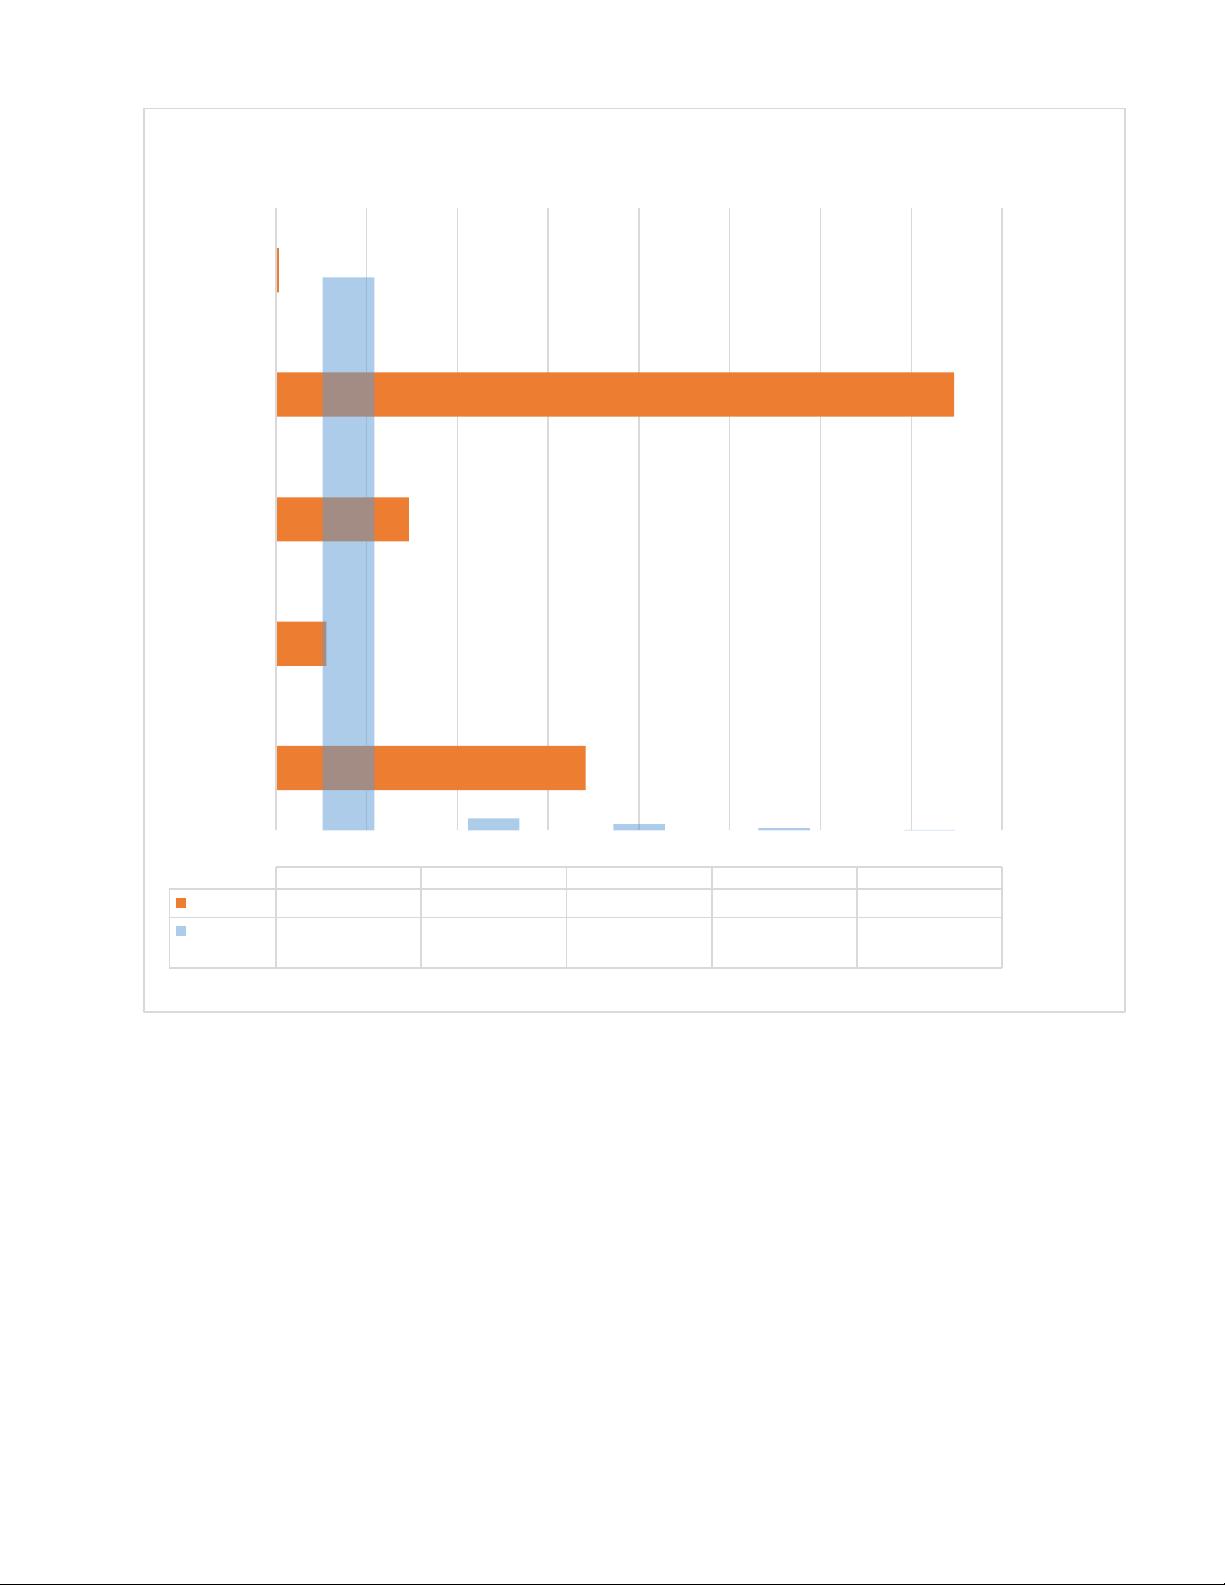
Coarse grain global ending stocks for 2020/21 are projected higher, with corn stocks taking the lead
and U.S. stocks the highest in 33 years. Foreign corn ending stocks are expected to fall, with a decline
for China. Excluding China, foreign corn stocks end up slightly higher.
Economic Research Service | Situation and Outlook Report
Next release is June 15, 2020
FDS-20e | May 14, 2020
In this report:
Domestic Outlook
International Outlook
2
Feed Outlook, FDS-20e, May 14, 2020
USDA, Economic Research Service
-
50,000
100,000
150,000
200,000
250,000
300,000
350,000
400,000
450,000
-5.0 0.0 5.0 10.0 15.0 20.0
United States
China
European Union
Brazil
Argentina
Ukraine
India
Russia
Mexico
Canada
1,000 tons
Percent
Change
United
States
China
European
Union
Brazil Argentina Ukraine India Russia Mexico Canada
% Change
16.4 -0.3 1.3 4.6 -0.1 7.1 -1.5 -2.7 10.5 6.4
Production
420,511 267,375 161,233 108,405 56,704 48,475 44,750 39,400 33,600 29,535
Source: USDA, Foreign Agricultural Service, Production, Supply, and Distribution database.
Coarse grains production changes by ten largest producers (2019/20 to 2020/21)
qNtPoMxPvN8ObP6MmOpPsQpPjMnNrMfQrQsPaQnMrPxNoPzRxNoNmR
3
Feed Outlook, FDS-20e, May 14, 2020
USDA, Economic Research Service
Domestic Outlook
Corn Planting Advances Quickly as Record Crop is
Projected
Corn planting is well underway and running ahead of the pace of recent years. As of May 10, 67
percent of the corn crop was in the ground, compared with a 5-year average of 56 percent.
Iowa, the largest corn-producing State, has planted 91 percent of its crop, compared with the 5-
year average of 66 percent. Last year at this time, only 28 percent of the crop had been planted,
due to extremely wet conditions that kept farmers out of the fields.
Planted area is projected at 97.0 million acres, based on the March 31 National Agricultural
Statistics Service (NASS) Prospective Plantings report. If realized, this would produce a record-
high corn crop of 15,995 million bushels at the projected weather-adjusted trend yield of 178.5
bushels per acre. This assumes normal planting progress and, summer growing season
weather, and the historical relationship between planted and harvested area.
Supplies at this level of production would be 18,118 million bushels, given a projected carryin of
2,098 million bushels and imports of 25 million. The 2019/20 estimated supply is 15,928 million
bushels. The previous record was set in 2016/17, at 16,942 million bushels.
0
20
40
60
80
100
120
140
160
180
200
0
10
20
30
40
50
60
70
80
90
100
88/89 91/92 94/95 97/98 00/01 03/04 06/07 09/10 12/13 15/16 18/19
Bushels/acre
Million acres
Figure 1
U.S. corn harvested area and yield
Sources: USDA, Economic Research Service with data from National Agricultural Statistics Service,
QuickStats, and USDA, World Agricultural Outlook Board, Crop Projections, 2020.
Harvested area (left axis)
Yield (right axis)
4
Feed Outlook, FDS-20e, May 14, 2020
USDA, Economic Research Service
2020/21 Corn Use Projected to Recover
Corn disappearance for 2020/21 shows a rebound from the COVID-19 devastated markets.
Feed and residual is projected at 6,050 million bushels, 350 million greater than 2019/20 on
increased grain consuming animal units, a larger crop, and lower expected prices. Food, seed,
and industrial (FSI) gains 245 million to 6,600 million bushels as motor gasoline consumption
returns to more normal levels spurring ethanol blending. Domestic disappearance is projected to
be 12,650 million bushels, 595 million greater than last year.
-
2,000
4,000
6,000
8,000
10,000
12,000
14,000
16,000
18,000
0.0 5.0 10.0 15.0 20.0 25.0 30.0 35.0 40.0
Corn
Sorghum
Barley
Oats
Rye
Million Bushels
Percent Change
Corn Sorghum Barley Oats Rye
% Change
17.1 2.8 7.3 37.4 0.2
Production
2020/21
15,995 351 182 73 11
Source: USDA, Economic Research Service with data from the World Agricultural Outlook Board.
Figure 2
Coarse grains production changes by grain in U.S. (2019/20 to 2020/21)
5
Feed Outlook, FDS-20e, May 14, 2020
USDA, Economic Research Service
Corn exports are slated to increase as global markets revive and, with the large crop, U.S.
prices are competitive. Projected exports are 2,150 million bushels, 375 million over last year.
Resulting total disappearance is projected at 14,800 million bushels, a gain of 970 million over
last year.
Ending corn stocks are pegged at 3,347 million bushels, an increase of 1,220 million from last
year, the highest since 1986/87’s 4,882 million. The stocks-to-use ratio is 22.6, the highest since
1992/93. The larger stocks relative to disappearance, the season average price received by
farmers is projected at $3.20 per bushel, $0.40 below 2019/20 and the lowest since 2006/07’s
$3.04 per bushel.
COVID-19 Continues to Impact 2019/20 Marketing Year
Demand
The projected 2019/20 corn disappearance is lowered again this month as the effects of
COVID-19 continue to ripple through the economy. FSI use is lowered 110 million bushels to
6,355 million as an ongoing collapse of motor fuel demand continues to erode ethanol
production and use. Corn for ethanol is lowered 100 million bushels this month. High fructose
corn syrup (HFCS) is lowered 20 million bushels; this is partially offset by a 5-million increase in
forecast starch production, as the higher volume of good shipped increases the demand for
cardboard and paper made from corn starch. Corn used for cereals is raised 5 million bushels
on indications of greater demand for corn-based food products.
0
2
4
6
8
10
12
14
16
18
20
88/89 91/92 94/95 97/98 00/01 03/04 06/07 09/10 12/13 15/16 18/19
Feed and residual
Exports
Other food, seed, and industrial uses
Ethanol
Ending stocks
Note: Marketing year 2019/20 and 2020/21 are projected.
Source: USDA, World Agricultural Outlook Board, World Agricultural Supply and Demand
Estimates.
Figure 3
U.S. corn utilization
Billion bushels
剩余25页未读,继续阅读
资源评论
2301_77550592
- 粉丝: 17
- 资源: 7165
上传资源 快速赚钱
- 我的内容管理 展开
- 我的资源 快来上传第一个资源
- 我的收益 登录查看自己的收益
- 我的积分 登录查看自己的积分
- 我的C币 登录后查看C币余额
- 我的收藏
- 我的下载
- 下载帮助
安全验证
文档复制为VIP权益,开通VIP直接复制
信息提交成功