没有合适的资源?快使用搜索试试~ 我知道了~
JP 摩根-全球-农业行业-农业商品季报:上半年需要下滑,下半年有反弹机会-51-21页.pdf
需积分: 0 0 下载量 48 浏览量
2023-07-26
14:24:20
上传
评论
收藏 992KB PDF 举报
温馨提示
试读
21页
JP 摩根-全球-农业行业-农业商品季报:上半年需要下滑,下半年有反弹机会-51-21页.pdf
资源推荐
资源详情
资源评论
Global Commodities Research
01 May 2020
Agricultural Commodities
Quarterly
Industrial demand slides through 1H20, but 2H20
offers green shoots for ags rebound
Global Commodities Research
Tracey Allen
(44-20) 7134-6732
tracey.l.allen@jpmorgan.com
J.P. Morgan Securities plc
See page 19 for analyst certification and
important disclosures.
www.jpmorganmarkets.com
Peering through the contagion of the COVID-19 selloff, agri commodities
appear well positioned to embark upon a fundamentally led demand
recovery in late 2Q20 and beyond. While the risk of China making Phase
One purchases of US origin agri products continues to hang in the balance.
The abrupt shift in OPEC+ oil supply strategy and concurrent
containment response to the Global COVID-19 Crisis are likely to sharply
reduce the industrial use of agri commodities for biofuel production during
the recession of 1H20. However, underlying food and feed consumption has
remained robust, despite dislocations in some supply chains.
But the equally abrupt and record strong recovery in global growth
expected to commence in June suggests that a resurgence in activity and
underlying industrial demand for agri commodities is approaching. The
gradual reopening of economies and anticipated acceleration in economic
activity through 2H20 and beyond drive quarterly global growth
projections of +34% QOQ SAAR in 3Q20 and +9% QOQ SAAR in 4Q20.
The unprecedented events of recent months have flipped the profile of our
agri price forecasts. Prices are projected to reach the lows of the year
through 2Q20 before recovering through 2H20. Relative to both spot prices
and forward curves we look for a recovery across the complex commencing
in 2Q20. Biofuel exposed markets lead projected price gains into year end.
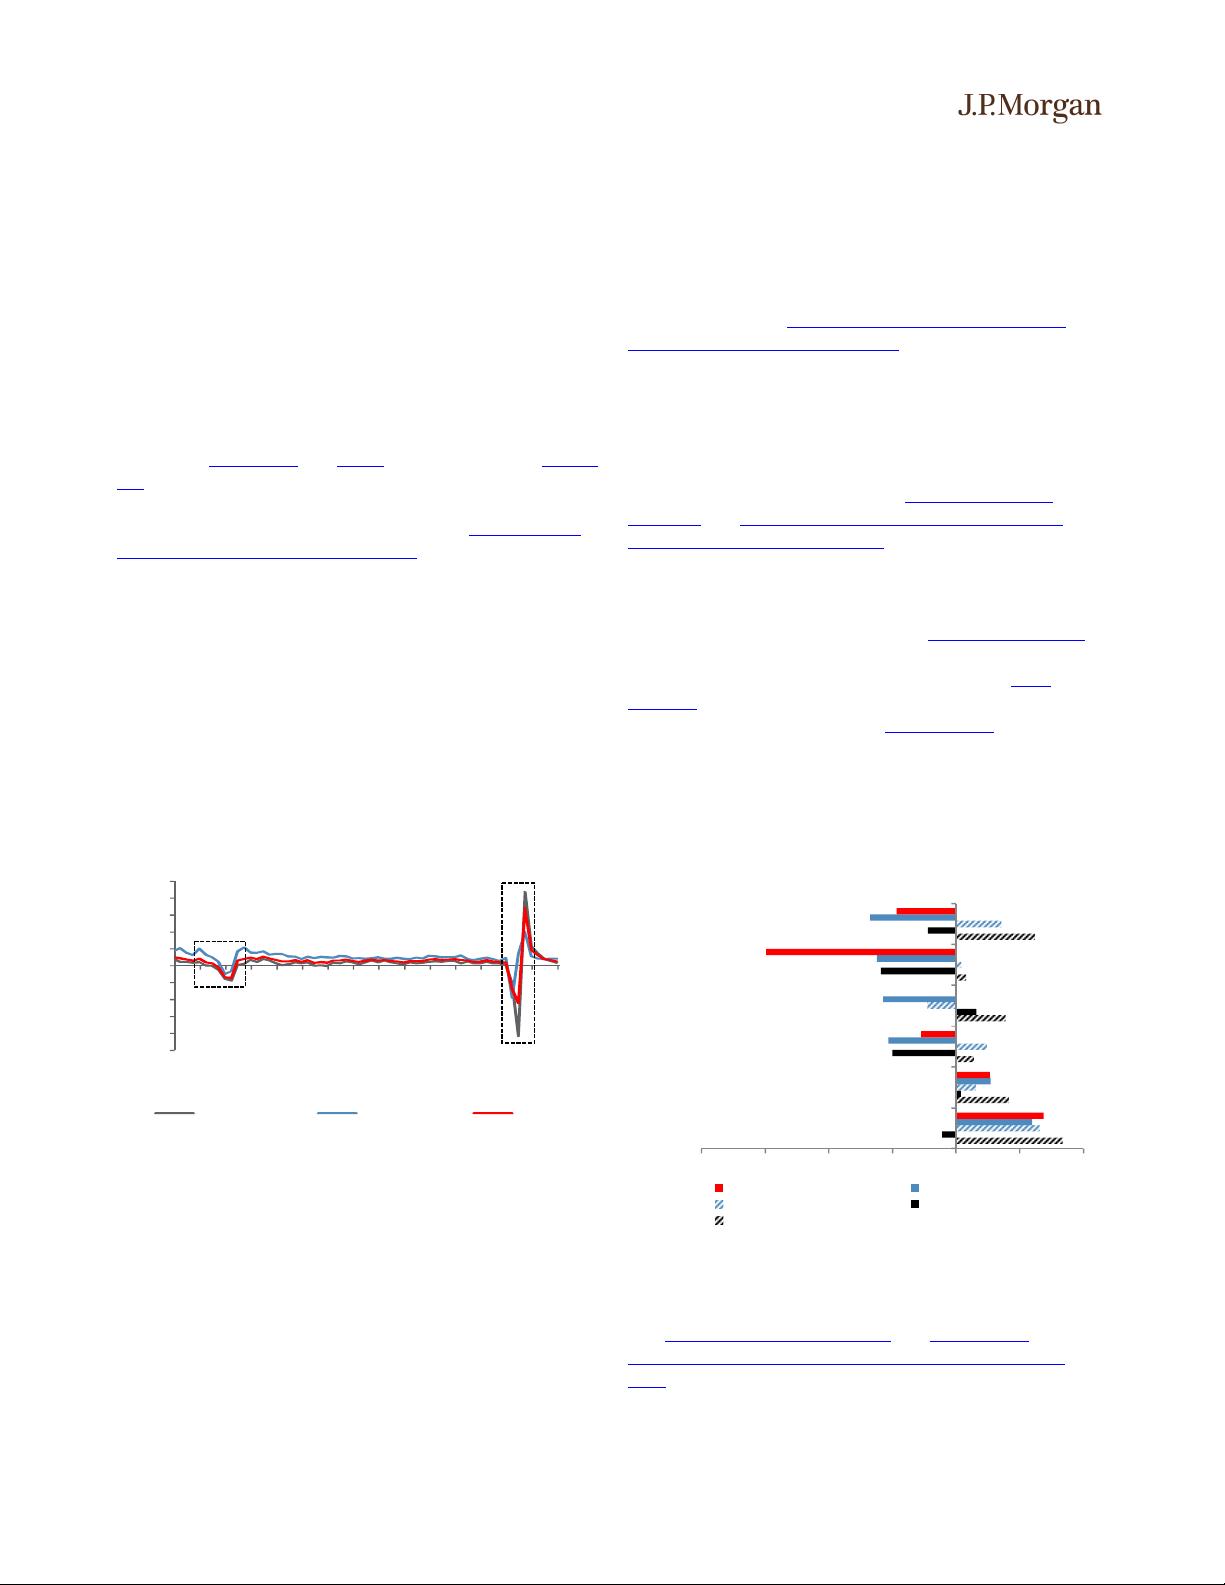
Price momentum across the agri complex trended negatively through Q1
2020, exacerbated by a drop in the ICE Brent z-score to a ~4-year low.
Non-Commercial net length across US traded agri commodities is now at a
historic seasonal short position, exceeded only by peak US-China Trade
War levels of 2019. Positioning risks appear skewed to the upside in 2H20.
Trade recommendations: Stay long CBOT Corn U0 – Z0 futures spread,
stay long CBOT Corn July '20 upside calls, stay long the ICE #11 Sugar
October ’20 14.5 – 16 USc/lb call spread, short the 13.25 USc/lb put, stay
long the agri complex via an index.
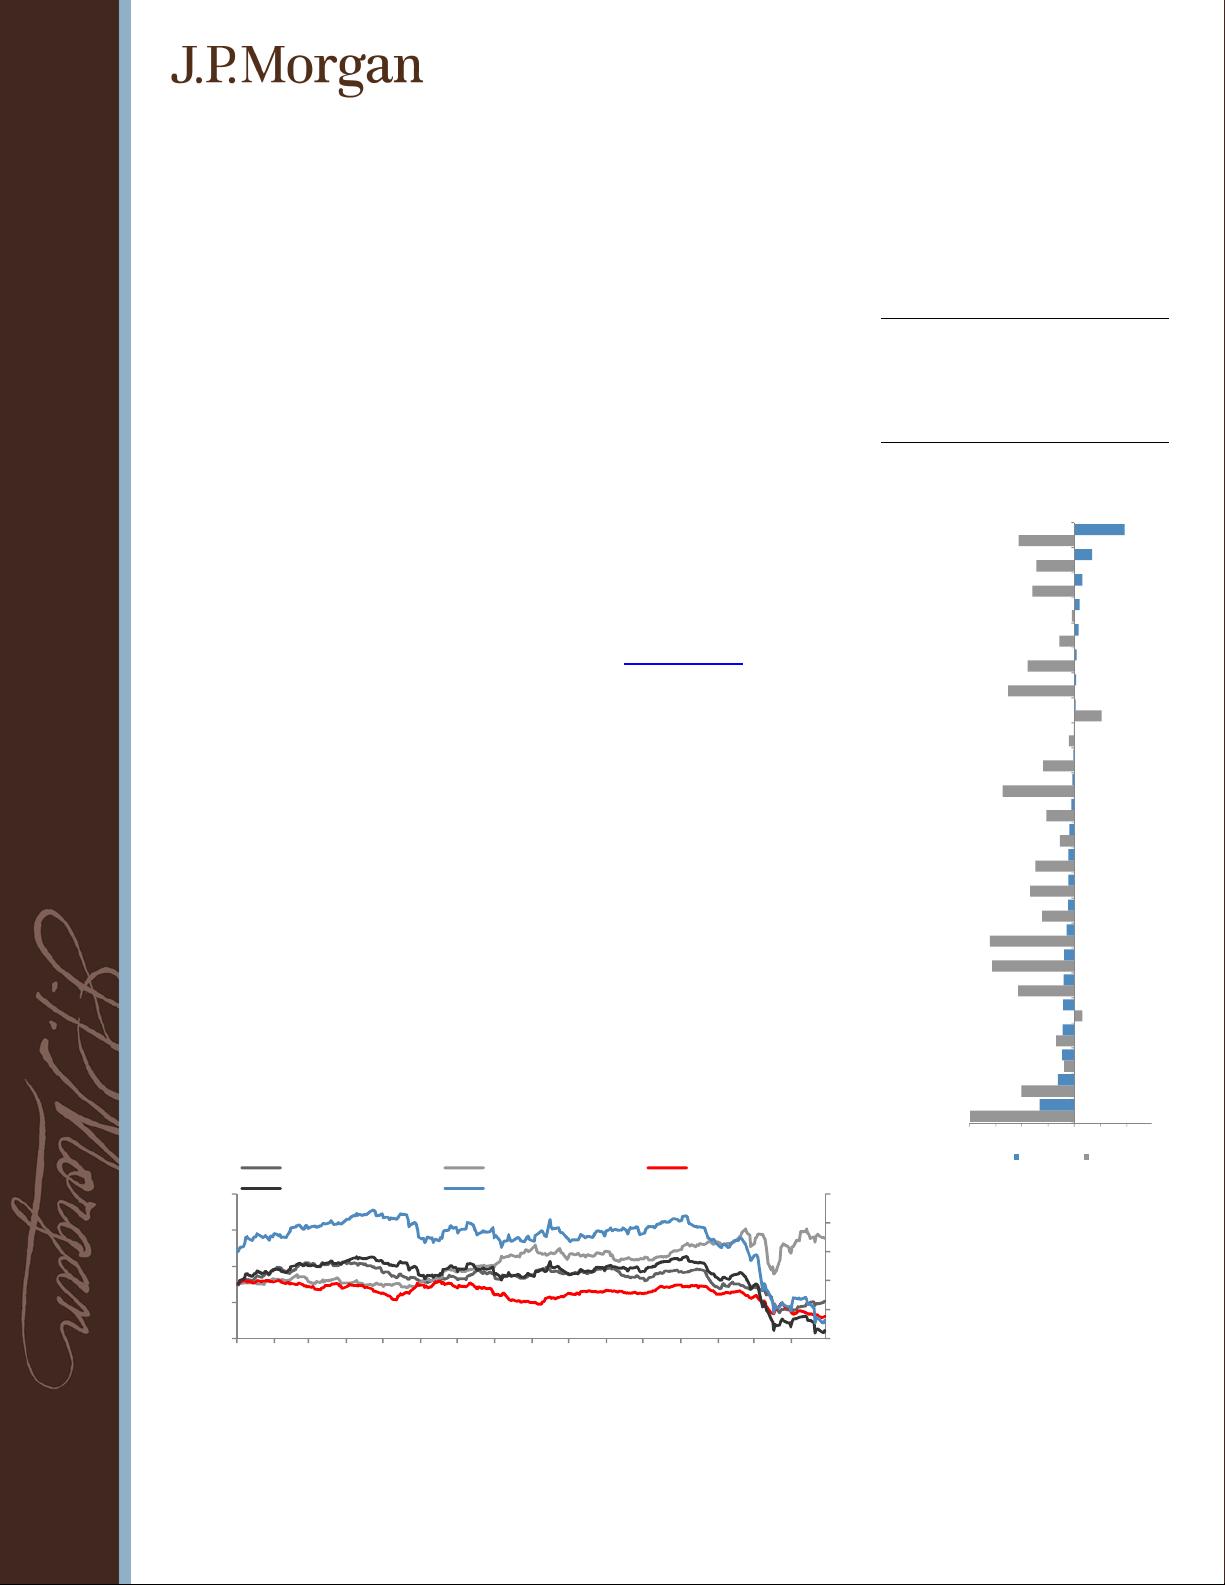
Figure 2: The JP Morgan Agriculture & Livestock TR Index has collapsed –17.5% YTD albeit
outperforming the aggregate, down -35% YTD. The 2H20 acceleration in growth and persistent
contraction in world grain & oilseed inventories will drag ags out of the COVID-19 slump.
Index performance from 2/1/2019
Source: Bloomberg, J.P. Morgan Commodities Research, 29 April
40
60
80
100
120
140
70
90
110
130
150
Jan-19
Feb-19
Mar-19
Apr-19
May-19
Jun-19
Jul-19
Aug-19
Sep-19
Oct-19
Nov-19
Dec-19
Jan-20
Feb-20
Mar-20
Apr-20
Industrial Metals Precious Metals Agriculture & Livestock
Aggregate Energy (RHS)
Figure
1
:
Agri commodity price
movements – active contract
Source: Bloomberg, J.P. Morgan Commodities
Research, 29 April 2020
-13.2%
-6.3%
-4.5%
-4.3%
-4.2%
-4.1%
-3.8%
-2.8%
-2.3%
-2.3%
-2.2%
-1.8%
-1.0%
-0.7%
-0.4%
-0.2%
0.6%
0.8%
0.9%
1.7%
2.0%
3.1%
6.8%
19.2%
-40% -30% -20% -10% 0% 10% 20%
30%
CME Class III Milk
ICE Arabica Coffee
CBOT Kansas Wheat
CBOT Wheat
Euronext Wheat
CBOT Corn
CME Live Cattle
MDE-Bursa Palm Oil
Minneapolis Wheat
BCOM Agri Index
JPMCCI Agri Index
CBOT Soymeal
ICE #5 White Sugar
ICE #11 Raw Sugar
CBOT Soybeans
Euronext Maize
ICE Cocoa London
CBOT Soybean Oil
CME Feeer Cattle
ICE NY Cocoa
ICE Canola
ICE #2 Cotton
ICE Robusta Coffee
CME Lean Hogs
WOW YTD
2
Tracey Allen
(44-20) 7134-6732
tracey.l.allen@jpmorgan.com
Global
Commodities Research
Agricultural Commodities Quarterly
01 May 2020
Industrial demand slides through 1H20,
but 2H20 offers green shoots for ags
rebound
Peering through the contagion of the COVID-19 selloff,
agri commodities appear well positioned to embark
upon a fundamentally led demand recovery in late 2Q20
and beyond. The J.P. Morgan Agriculture & Livestock
Index has sold off -17.5% YTD, led lower by the historic
collapse in oil demand and prices which has crushed biofuel
use and competitiveness. Macro repercussions of the
sudden stop in activity have also been transmitted to the
complex via foreign exchange markets (see Key Currency
Views: Still no cure for USD strength, Chandan &
Meggyesi et al 17 April). The collapse in the Brazilian real
– the worst performing major currency through 2020 YTD
(-36% YTD to USD/BRL 5.5) – has also taken its toll on
USD denominated agri futures prices. Brazil’s enhanced
export competiveness during the early stages of the Phase
One US-China Trade Agreement has resulted in China
purchasing sizeable tranches of Brazilian origin soybeans
and proteins, raising questions around the durability of the
agreement.
Figure 3: With an unprecedented stoppage in global activity, our
economists forecast a sharp decline in global GDP in 1H20 with an
abrupt 2H20 rebound
Real GDP - %q/q, saar
Source: Global Data Watch, J.P Morgan Commodities Research, as of 24 April 2020
Robust food and feed consumption of agri commodities
has driven relative outperformance of the aggregate
Commodities Index which is down -35% YTD. Looking
into 2H20 and beyond, we anticipate that food and feed
demand will remain robust, while industrial demand will
recover as economies open. Unprecedented stimulus and
coordinated Central Bank action, along with energy price
weakness, should support an abrupt and record strong
recovery in global growth from June. This highlights that a
resurgence in activity and underlying industrial demand for
agri commodities is approaching. The gradual reopening of
economies and anticipated activity acceleration drives
quarterly global growth projections of +34% QOQ SAAR
in 3Q20 and +9% QOQ SAAR in 4Q20. Looking into
2021, growth should recover to the pre-COVID levels by
January, and GDP is projected to rise to 6% YOY, up from
-4.5% in 2020 (See Global Data Watch: Fetch the bolt
cutters, I’ve been in here too long, Kasman et al, 24 April).
Fundamental adjustments show persistent draws in
exportable stocks
Despite acute industrial demand destruction through
April and May, our revised 2019/20 balances call for a
continued contraction in exportable world inventories,
with the exception of cotton (see World Commodity
Balances and Agricultural Commodities Quarterly 1Q
2020: Fundamentals chart pack, Allen, 30 April).
Aggregate world inventories tell a similar story, but are
inflated by stocks locked out of export markets (Figure 4).
Cotton, the most growth- and income-sensitive market of
the complex, has suffered significant demand destruction
(-9% QOQ) during the lockdown, and global inventories
have expanded over +13% QOQ relative to our 2020
Outlook. Barring sugar, global stocks have increased across
the agri complex relative to our 2020 Outlook, as the global
downturn weighs on industrial demand. In the case of
sugar, production constraints in Thailand have driven a
QOQ contraction in stocks and deepened our assessment of
the world market deficit to -11.5 million tonnes (raw value).
Figure 4: COVID-19 related demand destruction has prompted
2019/20 inventory assessments to rise, albeit decline YOY
% change in world inventory forecasts
Source: USDA, J.P. Morgan Commodities Research
In 2020/21 world exportable inventories are projected to
draw for yet another year, despite higher carry in stocks
(see World Commodity Balances and Agricultural
Commodities Quarterly 1Q 2020: Fundamentals chart
pack, Allen, 30 April). This continues to drive a gradual
tightening of world stocks-to-use ratios (Figure 5). Palm
oil stocks are projected to draw aggressively, down -12%
YOY, despite the relaxation in biodiesel blending programs
across South East Asia.
-50
-40
-30
-20
-10
0
10
20
30
40
50
Dec 06
Dec 07
Dec 08
Dec 09
Dec 10
Dec 11
Dec 12
Dec 13
Dec 14
Dec 15
Dec 16
Dec 17
Dec 18
Dec 19
Dec 20
Dec 21
Developed markets Emerging Markets Global
-40% -30% -20% -10% 0% 10% 20%
Cotton
Wheat
Corn
Sugar
Palm oil
Soybean
USDA 19/20 (f) Y/Y JPMC 19/20 (f) Y/Y
JPMC 19/20 (f) Q/Q JPMC 20/21 (f) Y/Y
JPMC 20/21 (f) Q/Q
3
Tracey Allen
(44-20) 7134-6732
tracey.l.allen@jpmorgan.com
Global
Commodities Research
Agricultural Commodities Quarterly
01 May 2020
The seismic shift in the 2020/21 world sugar balance to a
2.8 million tonne surplus (from a -4.8 million tonne deficit
in our February update) should drive a small stocks build –
the only projected build across the complex, while stocks-
to-use remains in check (see World Commodity Balances
and Agricultural Commodities Quarterly 1Q 2020:
Fundamentals chart pack, Allen, 30 April).
Figure 5: On a world basis, our stocks-to-use projections continue
to tighten in 2020/21, while sugar remains flat
%
Source: USDA, J.P. Morgan Commodities Research
Price forecast profile flipped to 1H20 weakness followed
by a demand led recovery in 2H20
Biofuel feedstocks ICE #11 Sugar, MDEB Palm Oil and
CBOT Corn have led the losses across the agri complex in
recent months, closely followed by dairy products and the
livestock sector. Following COVID-19 induced softening of
demand, and slow progress on China's Phase One purchases
of US agricultural products, prices are projected to reach
the lows of the year through 2Q20 before recovering
through 2H20. Relative to both spot prices and forward
curves we look for a recovery across the complex
commencing in 2Q20 (see Agri Commodity Price
Forecasts, Figure 13). Our ICE #11 Sugar price forecast has
been revised down -16% (from February) to an average of
12.4 USc/lb through 2020 (from 14.8 USc/lb previously),
and CBOT Corn prices are revised down -8% from our
prior estimate to an average of 366 USc/bu through 2020.
The persistent contraction of exportable wheat stocks
through 2020/21 drives a 3% increase in our assessment of
CBOT Wheat prices to an average of 550 USc/bu through
2020 – notably the only upward revision.
From the depths of the COVID-19 selloff and
underperformance of commodities relative to other
risky assets including equities, we hold a bullish risk
bias through 2H20 from our current price forecasts (see
Price risk scenarios, Figure 14).
Much uncertainty hangs in the balance, however, around
the opening of economies and the timing of a normalization
in activity. A number of underlying assumptions have also
changed over the quarter:
Oil prices are likely to remain weak through 2020,
albeit rising towards year-end, as balances tighten, with
Brent to average ~$36/bbl through 2020. This lends
scope for a significant recovery in passenger vehicle
use through 2H20 and keeps us optimistic for a sharp
bounce in biofuel blending demand. However, in some
countries where 100% biofuels are available, such as
Brazil (a significant consumer of hydrous ethanol),
sustained pressure on crude oil and product prices is
likely to weigh on biofuel competitiveness.
US farmers plant 93 million ac of corn, 87 million ac
of soybeans and 12 million ac of cotton (Figure 7).
Our FX strategists call for sustained weakness across
EM FX markets through 2020, albeit with mild
appreciation off current lows through 2H20 (Figure 6).
Over the course of 2020 it has become apparent that
China’s hog herd has stabilized and is moving into
an expansion mode, as discussed for some time
(Figure 26). China's soybean import demand is
projected to rise to 90 million tonnes in 2019/20 and at
least 93 million tonnes in 2020/21.
Progress on China’s purchases of US agricultural
products under the Phase One Trade Deal between
the US and China has been slower than anticipated.
The historic depreciation in the Brazilian real through
the COVID-19 pandemic and the unfolding local
political crisis have increased the competitiveness of
Brazilian-origin products relative to the US. True to the
terms of the deal, China has bought agri products on
the basis of price competitiveness primarily from
Brazil. Looking into 2H20, we anticipate that China’s
purchases of US agri products will rise, particularly as
economic activity accelerates. (See Agricultural
Markets Weekly: Agri markets await physical purchase
confirmation to price the Phase-One deal, Allen, 16
January.)
Seasonal climate forecasts call for a continuation of
a neutral ENSO through 2020, with a slight lean
towards La Niña through late 2H20.
Figure 6: EM FX weakness will remain a headwind for agri
commodities through 2020 but should subside in 3Q
Source: J.P Morgan FX Strategy, 24 April
0%
10%
20%
30%
40%
50%
60%
70%
80%
Wheat Corn Soybean
Palm Cotton Sugar
28-Apr Jun 20 Sep 20 Dec 20 Mar 21
JPM USD Index 130.4 129.8 129.2 129.3 129.0
EUR/USD 1.08 1.07 1.07 1.06 1.06
USD/BRL 5.5 5.4 5.1 5.1 5.1
USD/RUB 74.1 75.0 74.5 74.0 73.0
USD/CNY 7.08 7.10 7.00 6.99 6.99
USD/MYR 4.36 4.40 4.35 4.30 4.25
4
Tracey Allen
(44-20) 7134-6732
tracey.l.allen@jpmorgan.com
Global
Commodities Research
Agricultural Commodities Quarterly
01 May 2020
Figure 7: We maintain our US acreage expectations and look for
farmers to move acres into soybeans following the collapse in
CBOT Corn prices and basis, as well as weak ICE #2 Cotton margins
Million acres
Source: USDA, J.P. Morgan Commodities Research
Biofuel blending set for a v-shaped bounce in 2H20
Agri commodities have taken broader direction from oil
markets over recent months, amid the COVID-19 slump
in demand and biofuel blending. However biofuel
production is highly elastic, and the collapse in production
margins has resulted in widespread plant closures across the
US though April, and a slow start to the cane harvest and
ethanol production in Centre/South Brazil. After rising to a
record high of 27.7 million barrels in mid-April, US
ethanol stocks have shown early signs of peaking, and
with blending demand now exceeding production after
plant closures, stocks should remain in check.
Figure 8: Traffic flow across major ethanol blending cities with
lockdowns in place show signs of bottoming. Beijing offers an
interesting path to recovery, having resumed activity.
YOY change
Source: Tom Tom, J.P Morgan, as of 22 April 2020
Unlike record heavy oil inventories, which are expected to
pressure prices through 2H20, biofuel stocks have not
blown out. Rather, biofuel feedstock demand has borne the
brunt, inflating inventories of corn, vegetable oil and
driving the 2020/21world sugar balance to transition to
surplus. The pace of economies opening and recovering
remains highly subjective, but we do anticipate a preference
for personal vehicle transport over mass transit and flights
at least for some time. We look for the industrial demand
for biofuels to revert to more normal patterns in 3Q20.
This will involve a rapid increase in the US corn grind,
and support a surge in hydrous ethanol sales in Brazil.
Figure 9: US ethanol stocks have shown early signs of peaking, and
blending demand is moving into a seasonally stronger phase
1,000 barrels
Source: DOE, J.P Morgan Commodities Research, 24 April 2020
Sharp contraction in open interest and sizeable non-
commercial short position flag bullish price risks
Open interest across US traded agri commodities has
contracted sharply off the February record high, down
-12% amid heightened COVID-19 risk aversion. The
share of open interest held by commercial participants has
surged to 41%, as non-commercials have significantly
scaled back risk appetite, reducing their share to 35% (-7%
points YOY). On a year to date basis, interest across the US
traded agri commodities is flat YTD and down -10% YOY
amid the peak of the US-China trade war, with the most
significant contractions observed across CBOT Corn
(-385,000 lots, -17% YOY) and CME Live Cattle (-174,000
Lots, -35% YOY).
Figure 10: Open interest across US traded agri commodity futures &
options has slumped off the record highs of February, amid
heightened risk aversion
1,000 lots
Source: CFTC, J.P. Morgan Commodities Research, 21/04/2020
Non-commercial investors have amassed a sizeable short
position – the second shortest on a seasonal basis behind
2019, after industrial demand collapsed and China’s
Phase One purchases have lacked scale. As of 21 April
2020, the net non-commercial position across US trade
agri commodities was –362,469 lots, largely driven by the
complex leader CBOT Corn.
JPMC
2020f
USDA 2020 US
Prospective
Planting acreage
2019
Actual
2018
Ac tual
JPMC
2020f
ΔYOY
JPMC
2020f
%YO Y
Cor n 93.0 97.0 89.7 88.9 3.3 4%
Wheat 45.3 44.7 45.2 47.8 0.1 0%
Soybeans 87.0 83.5 76.1 89.2 10.9 14%
Cotton 12.0 13.7 13.7 14.1 -1.7 -13%
Major Row
Crop Total
237.3 238.9 224.7 240.0 12.6 6%
-0.5
-0.4
-0.3
-0.2
-0.1
0
0.1
0.2
09 Mar
11 Mar
13 Mar
15 Mar
17 Mar
19 Mar
21 Mar
23 Mar
25 Mar
27 Mar
29 Mar
31 Mar
02 Apr
04 Apr
06 Apr
08 Apr
10 Apr
12 Apr
14 Apr
16 Apr
18 Apr
20 Apr
22 Apr
Sao Paulo New York Chicago
Beijing London Berlin
18,000
20,000
22,000
24,000
26,000
28,000
Jan Feb Mar Apr May Jun Jul Aug Sep Oct Nov Dec
5-yr range 2017 2018 2019 2020
120
140
160
180
200
4,000
5,000
6,000
7,000
8,000
9,000
2014 2015 2016 2017 2018 2019 2020
Aggregated OI across agri commodity F&Os
J.P. Morgan Agri Price Index
5
Tracey Allen
(44-20) 7134-6732
tracey.l.allen@jpmorgan.com
Global
Commodities Research
Agricultural Commodities Quarterly
01 May 2020
A material increase in China’s imports in the coming
months and a stronger than expected growth recovery in H2
2020 may trigger a constructive positioning by the
discretionary investors and support prices across the
complex. Historically, 2Q has been a period when open
interest and net length has typically increased across the
complex ahead of the arrival of the new crop. However,
2020 has been anything but typical.
The underlying price momentum across the agri
complex has trended negatively through 2020 YTD,
exacerbated by a sharp fall in ICE Brent price
momentum to close to a 4 year low of -2.33 (breaching
the theoretical maximum negative switch point of -2 SD).
ICE #11 Sugar z-score marked a steep decline to -2.5,
the lowest since 2010. Price momentum across ICE #2
Cotton and CBOT Soybeans switched negative through Q1
2020, while it deepened further into negative territory for
CBOT Corn. ICE #2 Cotton price momentum fell to as low
as -1.76, below the maximum negative switch signal of
-1.5. Despite a compelling longer-term outlook, the impact
of the trend-following models cannot be underestimated in
the short run, and switch signals should be monitored.
Figure 11: The non-commercials net length across US traded agri
commodities reversed to a net short position, after recording a
positive net position in January
1,000 lots
Source: CFTC, J.P. Morgan Commodities Research, 21/04/2020
Trade recommendations: we continue to see opportunities
for consumers to extend longer-dated coverage across agri
commodity markets off the current lows amid a potential
unprecedented recovery in economic activity through 2H20.
Likewise for investors, the projected recovery in economic
activity through 2H20 and beyond is an underpriced risk
across the complex and relative to our fundamental
projection and macro assumptions we consider that current
prices offer an opportunistic entry point. Timing, however,
is difficult, but the gradual reopening and current bottoming
of economic activity lends itself to a positive price risk bias
in the future. We stay long the CBOT Corn U0 – Z0 futures
spread, stay long CBOT Corn July '20 upside calls, stay
long the ICE #11 Sugar October ’20 14.5 – 16 USc/lb call
spread, short the 13.25 USc/lb put, stay long the agri
complex via an index.
Figure 12: Spilt milk…US dairy product markets have also been
engulfed by COVID-19 containment measures and commercial
demand destruction amid surging domestic supply
US fluid milk production (billion pounds)
Source: USDA, J.P. Morgan Commodities Research
-1,000
-800
-600
-400
-200
0
200
400
600
800
Jan Feb Mar Apr May Jun Jul Aug Sep Oct Nov Dec
2017 2018 2019 2020 5-yr avg
16
16.5
17
17.5
18
18.5
19
19.5
5-yr range 5 yr Avg 2017
2018 2019 2020
剩余20页未读,继续阅读
资源评论
icwx_7550592
- 粉丝: 17
- 资源: 7163
上传资源 快速赚钱
- 我的内容管理 展开
- 我的资源 快来上传第一个资源
- 我的收益 登录查看自己的收益
- 我的积分 登录查看自己的积分
- 我的C币 登录后查看C币余额
- 我的收藏
- 我的下载
- 下载帮助
安全验证
文档复制为VIP权益,开通VIP直接复制
信息提交成功