JP 摩根-全球-石油与天然气行业-Q1石油市场季报:美国利用其能源例外主义-315-38页.pdf
需积分: 0 174 浏览量
2023-07-26
11:46:03
上传
评论
收藏 1.18MB PDF 举报

Global Commodities Research
15 March 2019
Oil Market Quarterly 1Q19
US leverages its energy exceptionalism
Global Commodities Research
Abhishek G Deshpande
AC
(1-212) 834-3102
JPMorgan Chase Bank NA
Thomas Anthonj
(44-20) 7742-7850
J.P. Morgan Securities plc
Arindam Sandilya
(65) 6882-7759
JPMorgan Chase Bank, N.A., Singapore
Branch
Prateek Kedia
(91-22) 6157-3317
prateek.kedia@jpmchase.com
J.P. Morgan India Private Limited
See page 36 for analyst certification and important disclosures.
J.P. Morgan does and seeks to do business with companies covered in its research reports. As a result, investors should be aw
are that the
firm may have a conflict of interest that could affect the objectivity of this report. Investors should consider this report as only a
single factor in
making their investment decision.
www.jpmorganmarkets.com
As risky assets focused on macro concerns, oil markets have largely
overlooked supply-side tightness in 1Q19 that has helped global oil markets
to rebalance since the end of 2018. With a potential for a US-China trade
talk resolution emerging, oil prices should finally break out of the narrow
trading range and should be supported in the very near-term due to policy-
driven supply-side tightness. The recovery is likely to fade towards the end of
2019 unless OPEC+ continues to over-comply and demand growth holds up.
In 2019, we revised down total oil products demand growth marginally by
58kbd to 1.03mbd whereas total supply growth has been revised down by
0.74mbd to 0.3mbd y/y due to OPEC+ cuts and Canadian curtailments as
assumed in our central balances. This is supportive for oil prices in 1H19. In
2H19 we are somewhat skeptical of the direction oil prices could take at this
stage given the strong price elasticity of supply and sustainability of OPEC+
cuts if oil prices or non-OPEC production were to rise unabated. At this
stage, in order to take a direction/view, we would rather give benefit of the
doubt to OPEC+ managing supply in order to avoid a surplus. Hence, we
think OPEC+ cuts will need to be extended not just to the end of 2019 but
also into 2020 if they want to avoid another oil price crash.
Given the support is very strongly pivoted on continued OPEC+ cuts (and
over-compliance), US foreign policy could very much influence those cuts as
neither US nor OPEC wants oil prices to rally too high at this stage of global
economic expansion. Talks of US SPR release and NOPEC bill could gain
traction if oil prices were to rise significantly from current levels. Hence, our
risk bias is negative relative to our base case scenario especially in 2H19 when
US supply growth returns.
Oil technical: The rally off the December 2018 lows remains intact for the
time being, but coming closer to the target zone for the first leg up (A-wave)
of the broader countertrend rally, usually a 50% retracement of the
preceding sell-off, we expect the up-momentum to fade in preparation of
the B-wave sell-off, which could potentially retrace 76.4% of the ongoing
wave A up.
Oil derivatives: Oil volatility has fully normalized from the multi-sigma
spike in 4Q18 when unexpected waivers on Iranian sanctions roiled
markets. Vols now screen fair vs. medium-term fundamental drivers. Oil
volatility should remain contained this year due to continued OPEC+
management of prices around $70/bbl on Brent. The lack of overvaluation
in implied volatility prevents an aggressive short vol stance; however,
cautious structuring via -M6/+M12 calendar spreads offers better risk-
reward. Bullish oil views are well-expressed via Jun’19 call spreads that
have cheapened sharply in vol, and line up timeline-wise with the Iranian
sanctions waiver deadline, an expected ramp up in Russian production
compliance ahead of the April OPEC+ meeting, and the end of the refinery
maintenance season.
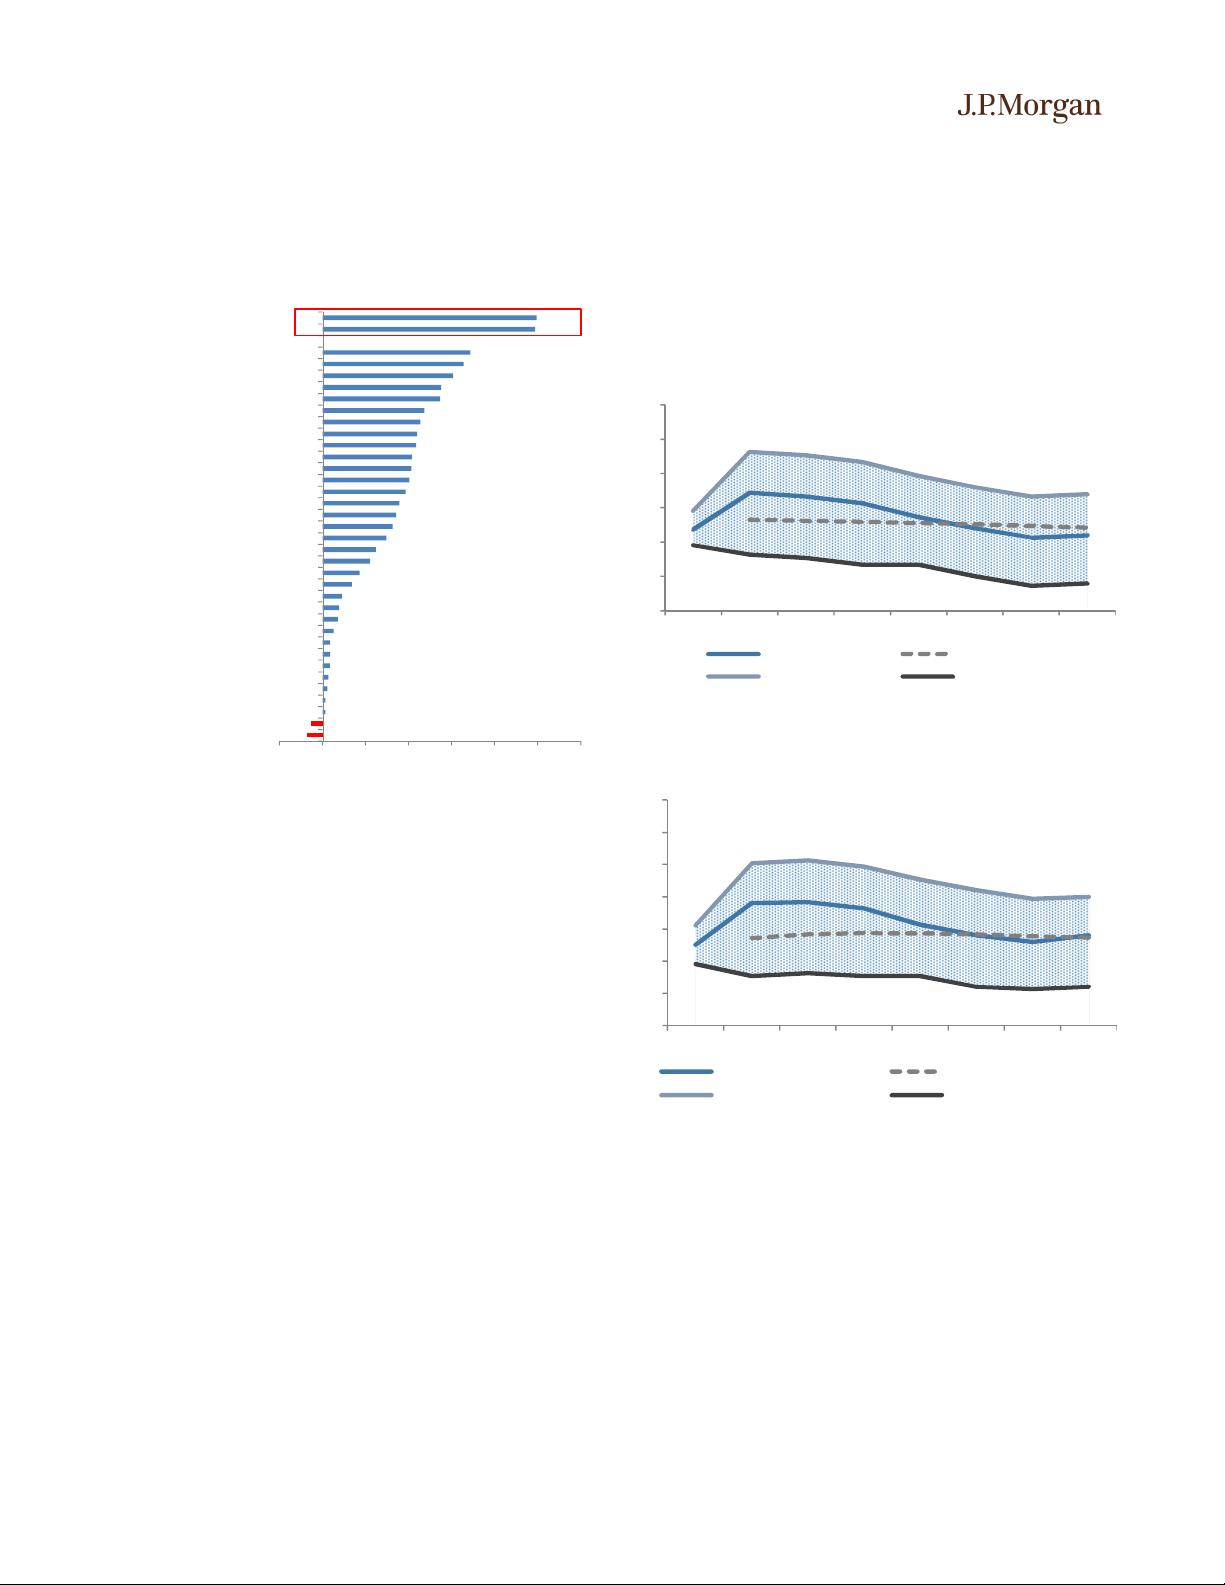
J.P. Morgan Oil Price Forecast (Brent)
$/bbl
Source: J.P. Morgan Commodities Research
J.P. Morgan Oil Price Forecast (WTI)
$/bbl
Source: J.P. Morgan Commodities Research
40
50
60
70
80
90
100
1Q19 2Q19 3Q19 4Q19 1Q20 2Q20 3Q20 4Q20
Central Scenario Forward Curve
High Case Scenario Low Case Scenario
30
40
50
60
70
80
90
100
1Q19 2Q19 3Q19 4Q19 1Q20 2Q20 3Q20 4Q20
Central Scenario Forward Curve
High Case Scenario Low Case Scenario


剩余37页未读,继续阅读
资源评论


