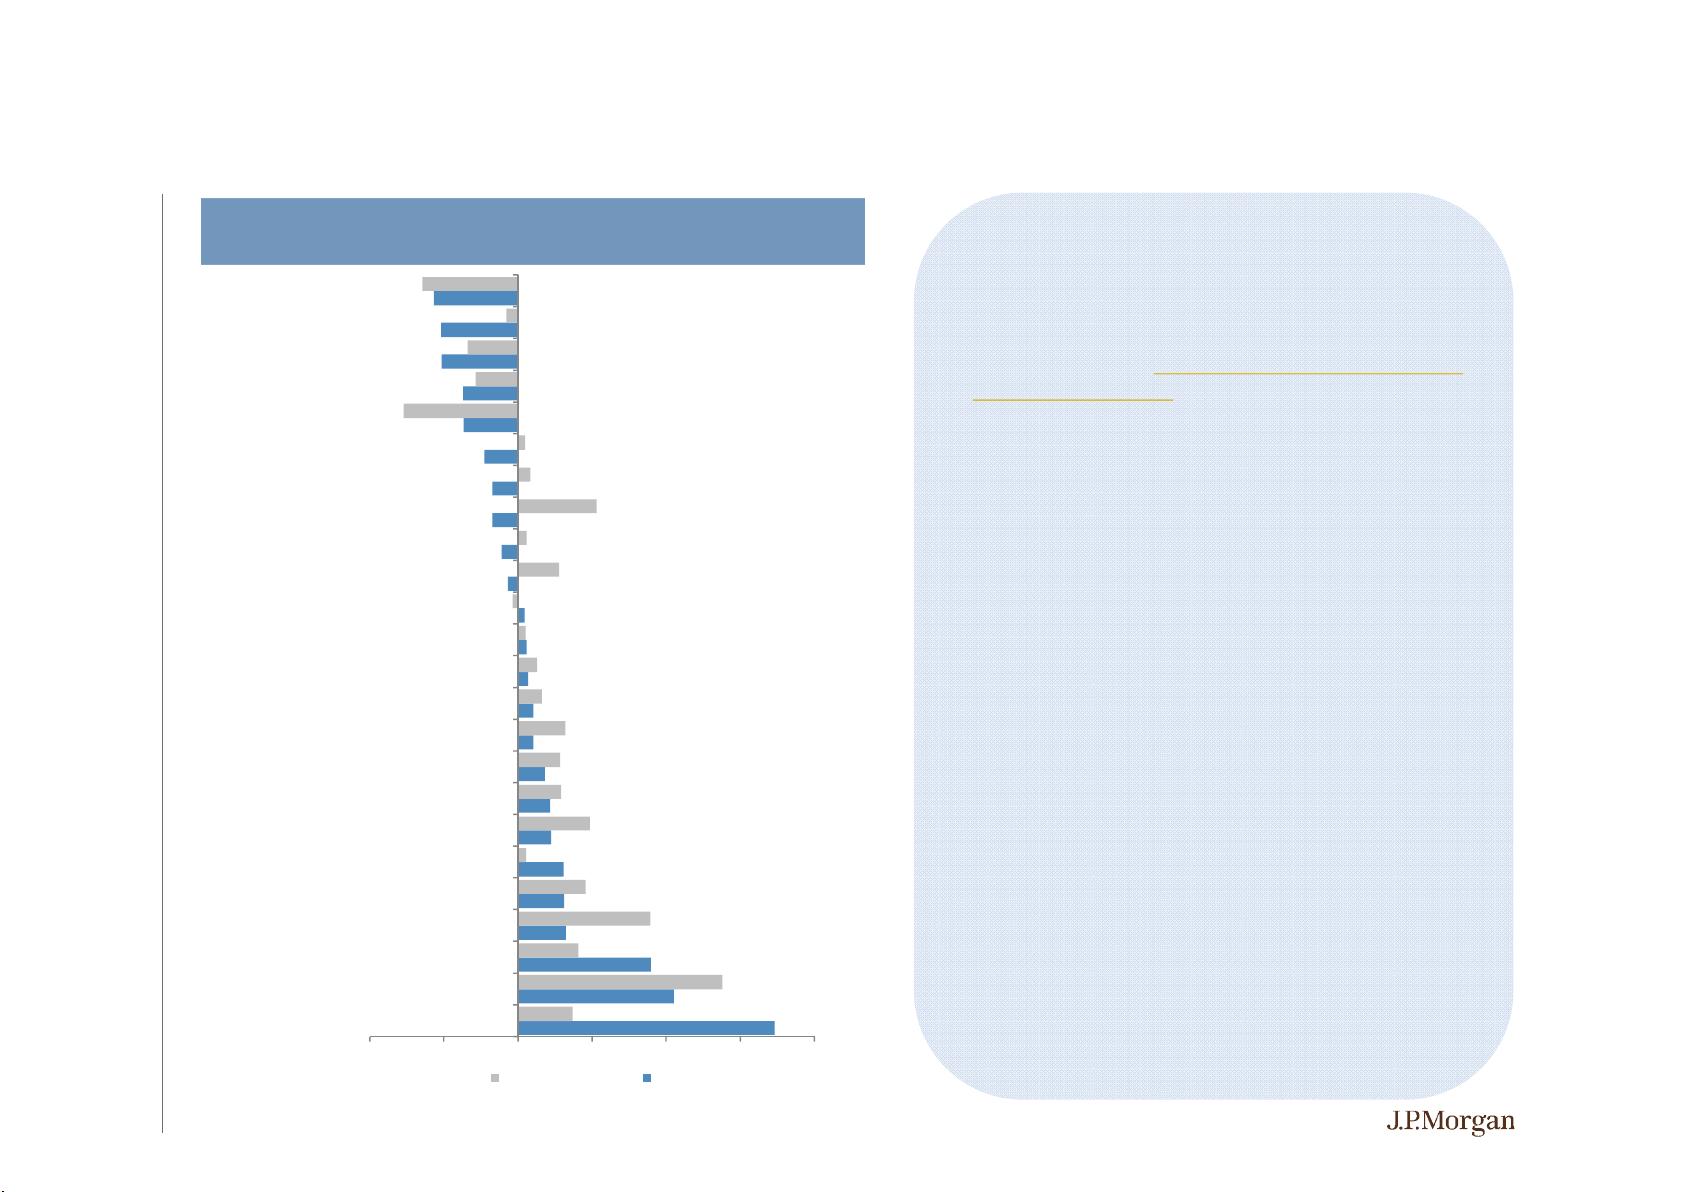
Tangible supply side constraints will continue to drive agri commodity prices off the lows
Source: CBOT, ICE, Bloomberg, J.P. Morgan Commodities Research Note: All Forecasts are period averages.
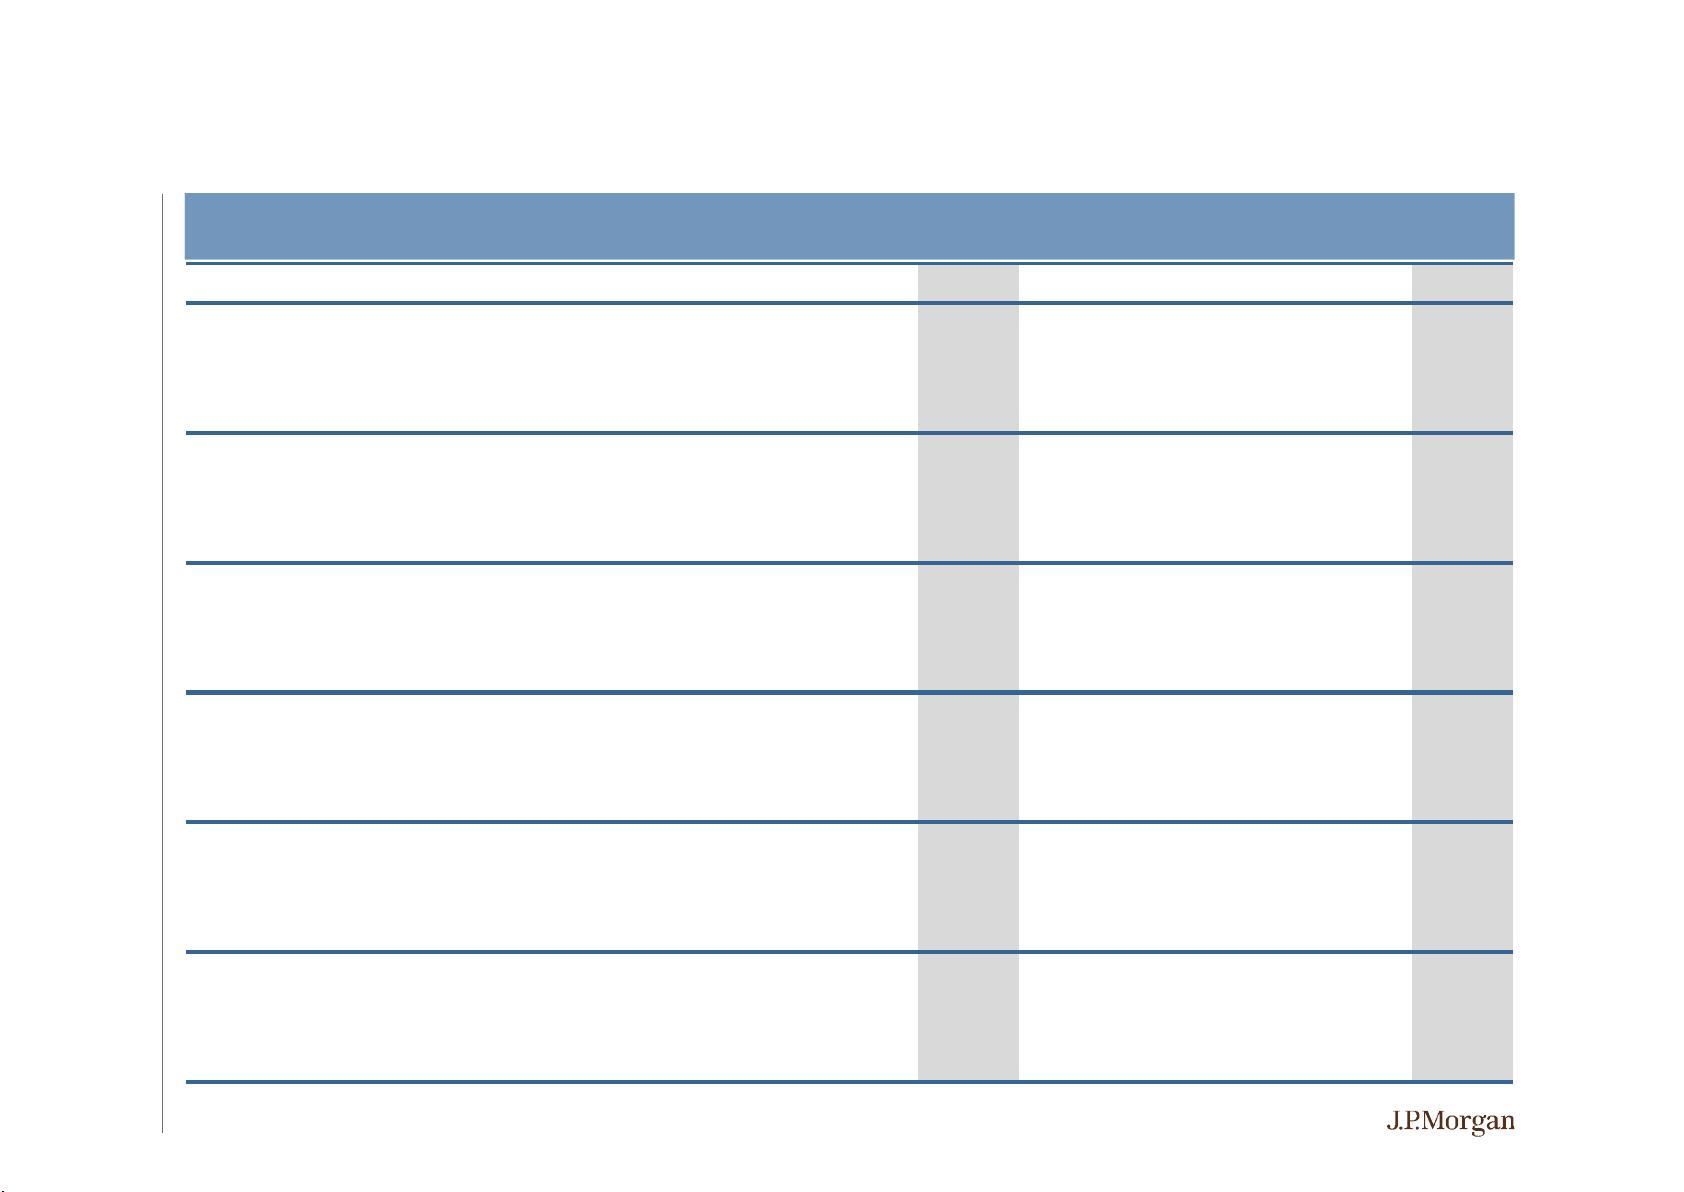
J.P. Morgan agri commodity price forecasts
3
• Looking into 2H19, tangible supply side constraints across
grain markets, and tightening fundamentals across the softs
will continue to drive agri commodity prices off the lows. We
hold high conviction that the idiosyncratic factors which are
tightening US and world agricultural fundamentals faster-than-
anticipated will overshadow the bearish impact of a low growth
/ low inflation environment through 2H19, and support a
sustained recovery across the agricultural complex.
• The impact of food price inflation should not be underestimated
through 2H19 – off very benign levels. Weather risks are not
subsiding, and grain prices are not yet at levels which destroy
demand.
• US planted acreage expectations have reduced for corn (84.5
m ac), wheat (44.8 m ac), and cotton (13.6 m ac) relative to our
March balances, while soybean planting will likely rise to 85
million ac, due to weather related delays elsewhere.
• US acreage will not be accurately known until August -
September, and given the late planting and delays in progress,
production forecasts are very subjective at this point.
• Trade recommendations: stay long the agricultural complex via
an index, stay long ICE #11 Sugar October ‘19 13.5 – 15USc/lb
call spread, short 12.5 USc/lb put.
A G R I C U L T U R A L C O M M O D I T I E S Q U A R T E R L Y 2 Q 1 9
Agri Commodities 1Q19 2Q19f 3Q19f 4Q19f 1Q20f 2Q20f 3Q20f 4Q20f 2017 2018 2019f 2020f
CBOT Wheat USc/bu 490 475 530 550 550 570 550 550 431 473 511 555
CBOT Corn USc/bu 373 390 450 470 470 450 430 430 360 362 421 445
CBOT Soybeans USc/bu 905 860 880 880 900 920 900 920 982 957 881 910
ICE #11 Sugar USc/lb 12.7 12.4 13.5 15.0 16.0 16.0 15.5 16.5 17.4 12.7 13.4 16.0
ICE #2 Cotton USc/lb 73.3 72.0 70.0 70.0 73.0 73.0 75.0 75.0 73.2 80.7 71.3 74.0
MDE-Bursa Palm Oil MYR/t 2,089 2,050 2,300 2,400 2,500 2,500 2,600 2,700 2,868 2,413 2,210 2,575
Source: J.P. Morgan Commodities Research
2019/20 US primary row crop planting estimates
Million ac
19/20f
Jun'19
19/20f
Mar'19
USDA
19/20f
18/19
Actual
ΔYOY %YOY
Corn 84.5 91.8 89.8 89.1 -4.6 -5.2%
Wheat 44.8 46.9 45.8 47.8 -3.0 -6.3%
Soybeans 85.0 84.5 84.6 89.2 -4.2 -4.7%
Cotton 13.8 14.3 13.8 14.1 -0.3 -2.1%
Major Row
Crop Total
228.1 237.5 234.0 240.2 -12.1 -5.0%