没有合适的资源?快使用搜索试试~ 我知道了~
汇丰银行-全球-石油与天然气行业-石油市场展望:价格削减——看起来具有挑战性-9-24页.pdf
需积分: 0 0 下载量 195 浏览量
2023-07-27
14:24:09
上传
评论
收藏 677KB PDF 举报
温馨提示
试读
24页
汇丰银行-全球-石油与天然气行业-石油市场展望:价格削减——看起来具有挑战性-9-24页.pdf
资源推荐
资源详情
资源评论
Disclosures & Disclaimer
This report must be read with the disclosures and the analyst certifications in
the Disclosure appendix, and with the Disclaimer, which forms part of it.
Issuer of report: HSBC Bank plc
View HSBC Global Research at:
https://www.research.hsbc.com
Demand concerns dominate at present, although the market
should tighten in the next few months
2020 could be tough, with little room for higher OPEC output
2020 Brent price forecast cut by USD10/b to USD60/b; longer
term forecasts cut by USD5/b to USD65/b
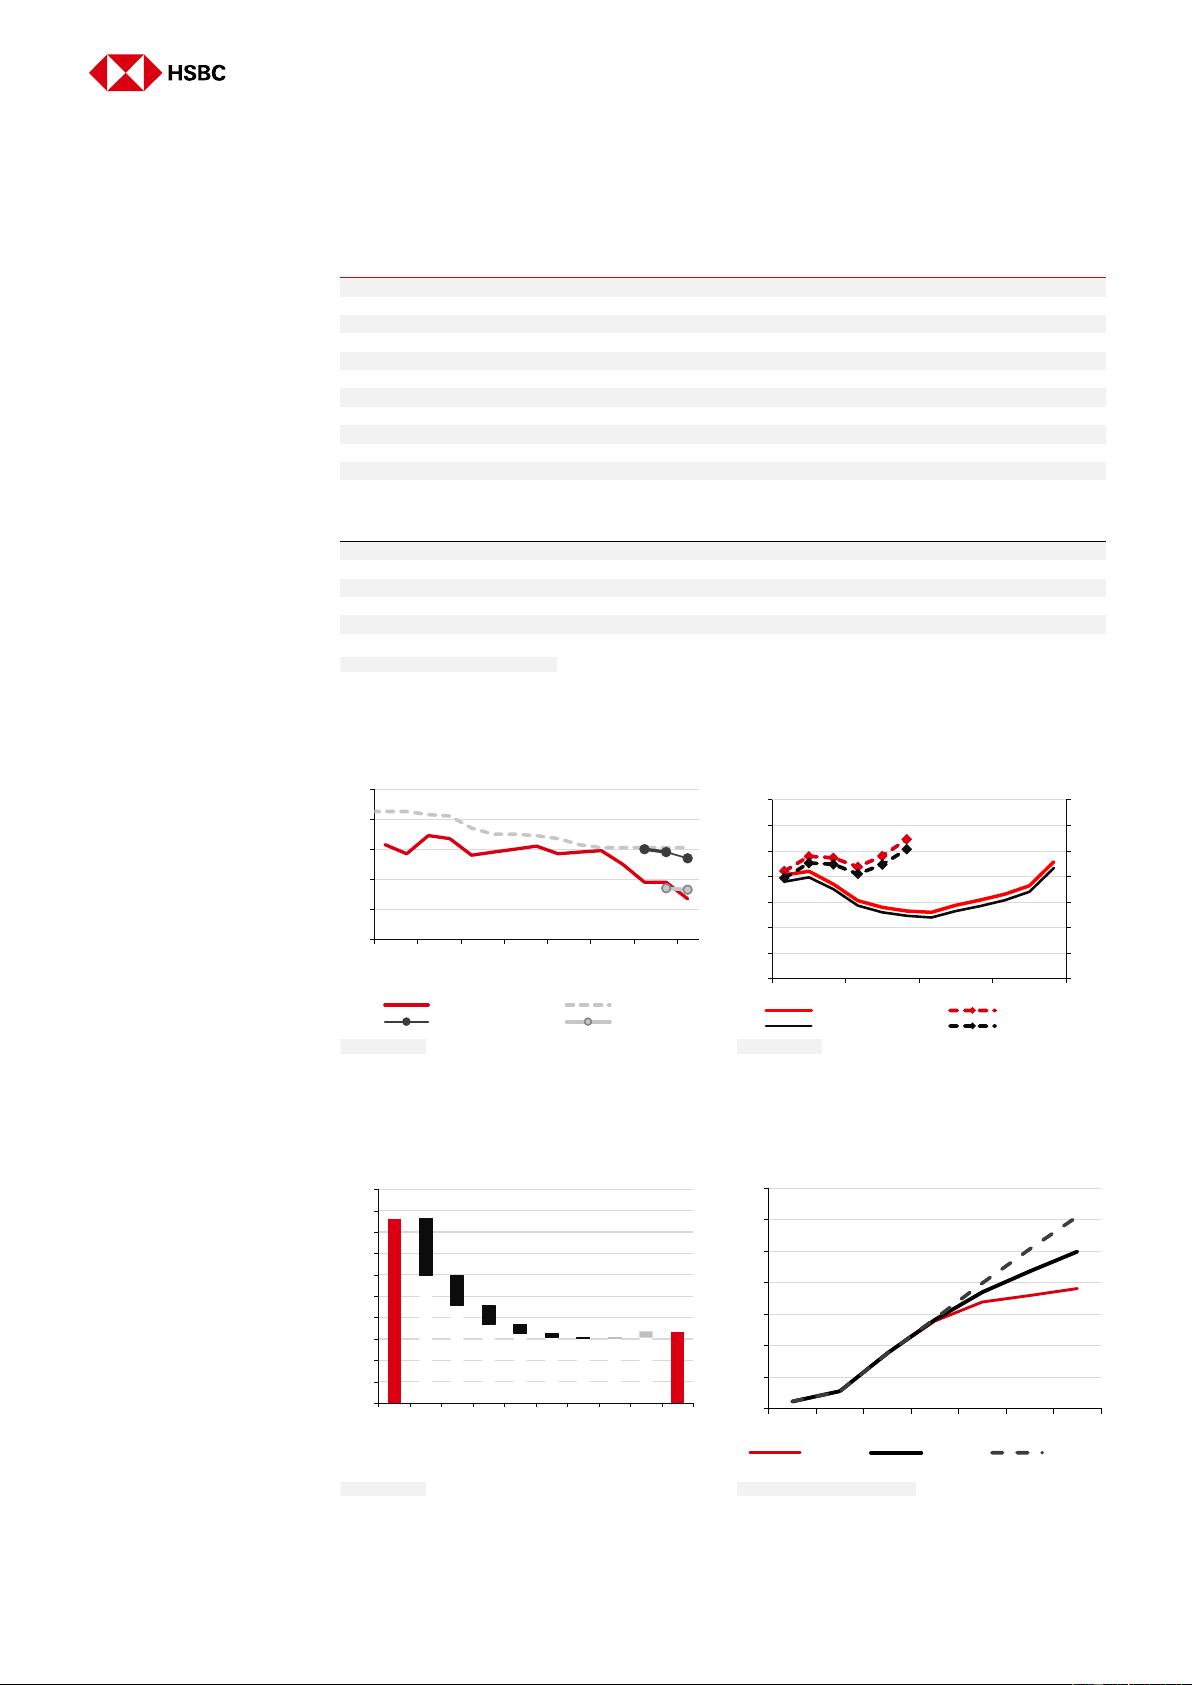
Prices languish despite harsh OPEC cuts: OPEC supply has fallen by 2.7mbd
since November as a result of aggressive production cuts (more than 1.4mbd from
Saudi Arabia alone) and involuntary losses from Iran and Venezuela. Despite this,
prices have remained under pressure from a combination of strong US supply growth
(+2mbd y/y), rising OECD inventories and sentiment dominated by demand risks.
Near-term price support? We have moved into the period where seasonal demand
strength should allow significant stock draws in the coming months. This should lend
some near-term support to prices, provided it shows up in OECD stocks and the
macro environment doesn’t deteriorate further.
Not much relief in 2020: it is hard to see the market tightening in 2020. Once again
we expect non-OPEC supply growth (+2.0mbd) to outstrip demand growth
(+1.1mbd), leaving virtually no room for OPEC to increase supply from current levels,
and needing its supply cuts to be sustained through the year if significant oversupply
and inventory builds are to be avoided.
Where are the main risks?
We see two main upside risks for prices: 1) a less pessimistic market view on the
demand outlook, particularly if US/China trade issues are resolved, and 2) a
commitment to deeper cuts from OPEC/non-OPEC, which could be possible
ahead of the seasonally weak 1Q20 given the soft outlook for balances next year
On the downside, a further worsening of the global economic outlook or an
easing of export sanctions on Iran or Venezuela could put more pressure on
prices. However, the real downside risk (though there is no sign of it at this point)
would come from any change in OPEC’s strategy of supply restraint, either from
a collapse of its accord with non-OPEC producers or from a deliberate return to
the 2014-15 policy of allowing prices to fall to squeeze out non-OPEC supply.
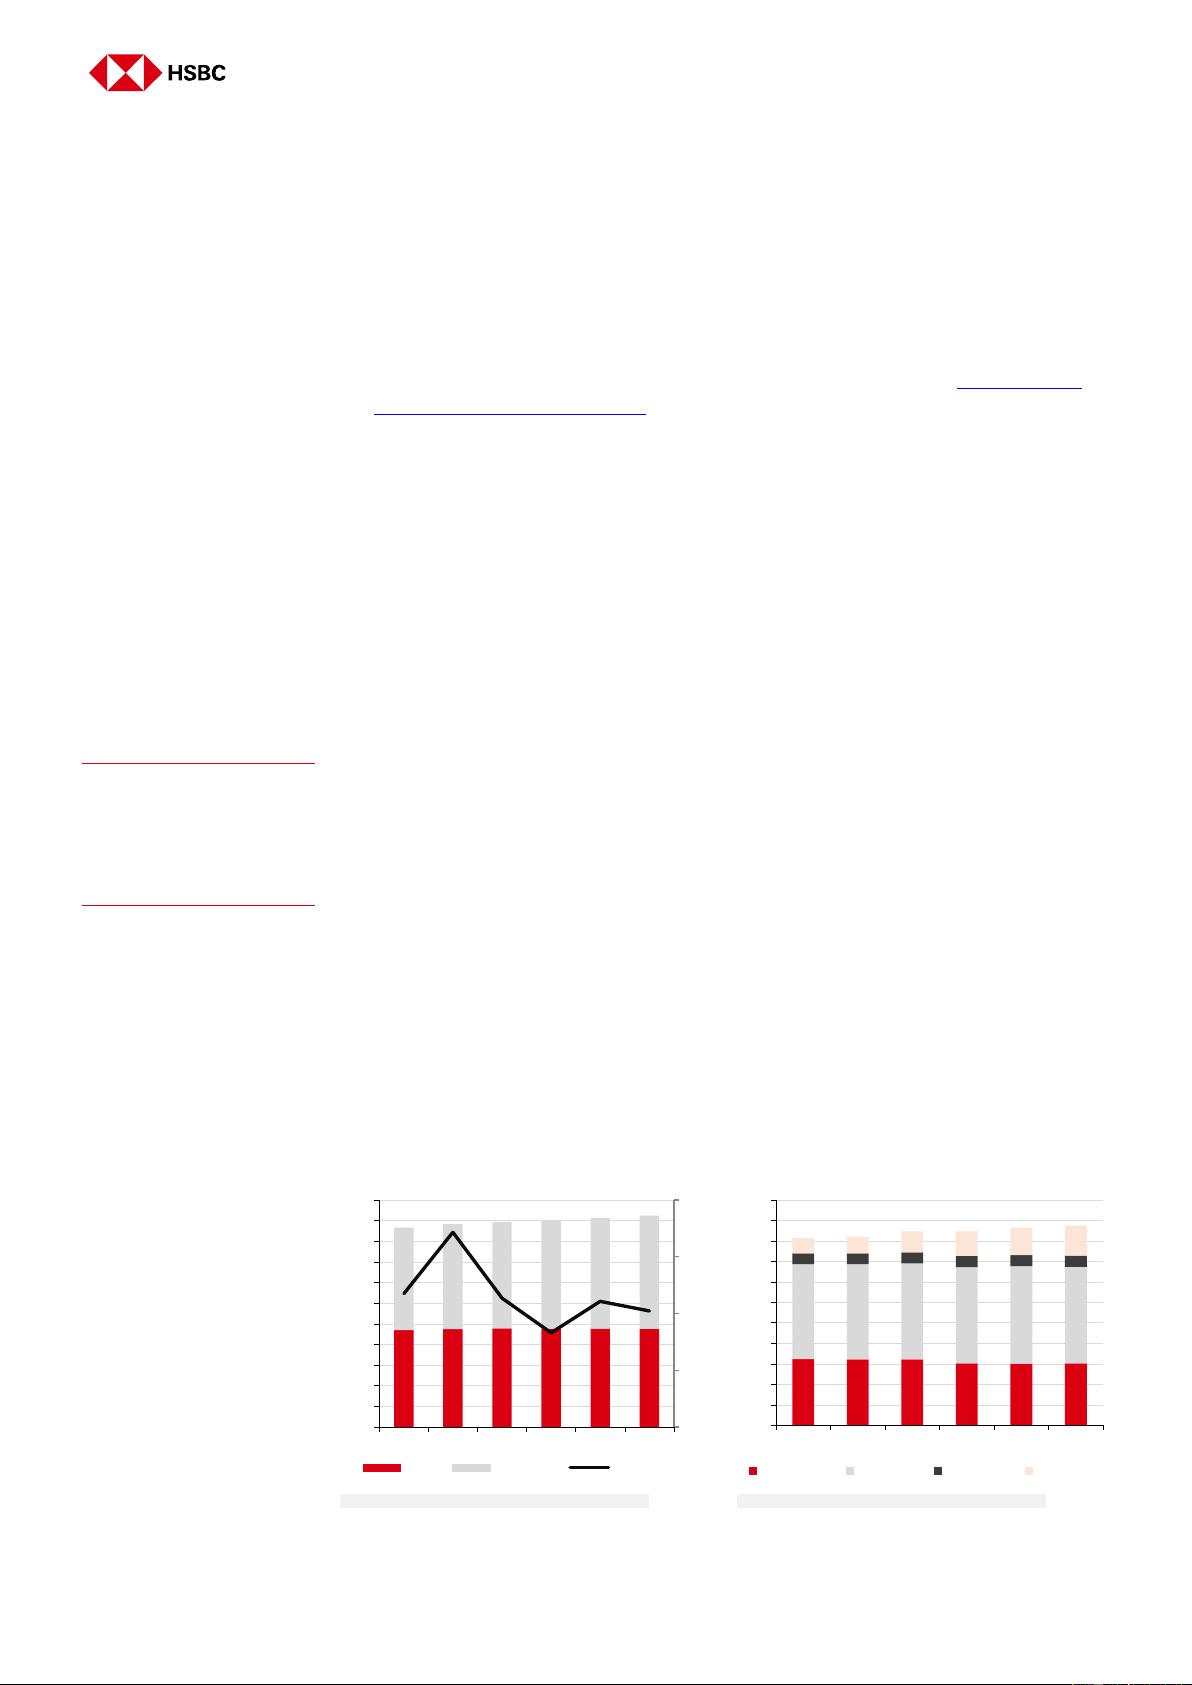
Lower price assumptions: We have cut our Brent crude price assumptions as
follows: 2019 from USD66.6/b to USD63.8/b (with 4Q19 at USD62/b); 2020 from
USD70/b to USD60/b, and 2021 and thereafter from USD70/b to USD65/b.
10 September 2019
HSBC OIL AND GAS PRICE ASSUMPTIONS
Annual average
2018
2019e
2020e
2021e
Brent
1
71.6
63.8
60.0
65.0
Prev.
66.6
70.0
70.0
WTI
1
64.8
56.1
55.0
62.0
Nymex gas
2
3.07
2.60
2.50
2.75
UK spot gas
2
7.87
4.88
5.60
6.10
Quarterly average
1Q19
2Q19
3Q19e
4Q19e
Brent
1
63.7
68.3
61.0
62.0
Prev.
67.0
67.0
WTI
1
54.7
59.8
55.0
57.0
Nymex gas
2
2.9
2.5
2.4
2.6
UK spot gas
2
6.3
4.5
3.8
5.3
Note: 1 = USD/b, 2 =
USD/mBtu
Source: Refinitiv
Datastream, HSBC
Oil market outlook
Equities & Commodities
Global
Gordon Gray*
Global Head of Oil and Gas Equity Research
HSBC Bank plc
gordon.gray@hsbcib.com
+44 20 7991 6787
Charles Swabey*
Analyst
HSBC Bank plc
charles.swabey@hsbc.com
+44 20 3268 3954
Thomas C. Hilboldt*, CFA
Head of Resources & Energy Research, Asia Pacific
The Hongkong and Shanghai Banking Corporation Limited
thomaschilboldt@hsbc.com.hk
+852 2822 2922
Kim Fustier*
Analyst, Oil & Gas
HSBC Bank plc
kim.fustier@hsbc.com
+44 20 3359 2136
* Employed by a non-US affiliate of HSBC Securities (USA) Inc, and is
not registered/ qualified pursuant to FINRA regulations
Cutting price deck – 2020 looks challenging
Equities & Commodities
●
Global
10 September 2019
2
Since OPEC enacted its supply cuts in November 2018 in response to sharply weaker crude
prices, it has removed 2.7mbd of supply from the market through a combination of voluntary
cuts (mainly from Saudi Arabia and the UAE) and involuntary losses (Iran, Venezuela). The
supply cuts helped to support a strong rebound in prices in 1Q19 but after reaching a peak of
~USD75/b in April, Brent has slumped to around USD60/b again. The scale of the OPEC cuts
wasn’t enough to prevent OECD stocks rising steadily through 2Q under the combined effect of
strong US supply growth and a rapidly deteriorating demand backdrop. Indeed, it looks like
prices could have been much worse if OPEC supply curbs hadn’t been so aggressive.
Preliminary data suggests inventories are now (finally) falling, and we expect to see more
evidence of this in the coming months which should lend some near-term support for prices.
However, as we look to 2020, market fundamentals could well be even weaker than in 2019.
Demand should get a modest boost from the onset of IMO 2020 regulations, but demand
growth is set to be outpaced once again by the scale of non-OPEC growth, principally from US
tight oil. Supply/demand balances indicate a demand for OPEC crude in 2020 no higher than its
current output – put another way, OPEC will need to continue its restraint beyond the current
March-2020 expiry of the agreement if the market is not to return to significant oversupply. So
once again, the main swing factor for 2020 is likely to be OPEC strategy:
We expect the OPEC+ accord to be extended through the whole of 2020, and this is the
assumption in our supply/demand model – which still shows a modest global stock build for
the year.
If the market continues to deteriorate we think there is a good chance that core OPEC
members push for a deeper cut at the December meeting, with the aim of eliminating what
is still a sizeable global inventory surplus.
The wild card for oil markets would be any abandonment of the agreement, either from a
failure to keep non-OPEC producers (principally Russia) on board, or from a deliberate
return to the 2014-15 strategy of allowing prices to fall further in order to push out non-
OPEC supply. We think the probability of this outcome is low partly because of the
economic pressure already being felt by OPEC producers at these prices, but also because
we expect rapidly slowing non-OPEC supply growth to give OPEC room to rebuild market
share anyway post-2020.
We have cut our Brent crude price assumptions as follows: 2019 from USD66.6/b to USD63.8/b
(with 4Q19 at USD62/b); 2020 from USD70/b to USD60/b and 2021 and thereafter from USD70/b to
USD65/b (see opposite). Consensus is around USD65/b for both 2020 and 2021.
Lowering our price forecasts
Demand concerns dominate, but market set to tighten
2020 could be tough, with little room for higher OPEC output
Brent price forecasts cut to USD60/b for 2020, USD65/b for 2021+
OPEC has removed 2.7mbd
since November 2018 but
inventories have still built
3
Equities & Commodities
●
Global
10 September 2019
HSBC oil and gas price assumptions
Annual average
2016
2017
2018
2019e
2020e
2021e
Brent
USD/b
45.1
54.8
71.6
63.8
60.0
65.0
Previous
66.6
70.0
70.0
Change
(2.8)
(10.0)
(5.0)
WTI
USD/b
43.4
50.9
64.8
56.8
55.0
62.0
Previous
59.1
65.0
67.0
Change
(2.3)
(10.0)
(5.0)
Nymex gas
USD/mBtu
2.5
3.0
3.1
2.6
2.5
2.8
Previous
2.6
2.5
2.8
Change
0.0
0.0
0.0
UK spot gas
USD/mBtu
4.7
5.8
7.9
4.9
5.6
6.1
Previous
4.9
5.8
6.8
Change
(0.0)
(0.2)
(0.7)
Quarterly average
3Q19e
4Q19e
1Q20e
2Q20e
3Q20e
4Q20e
Brent crude
USD/b
61.0
62.0
60.0
60.0
60.0
60.0
Previous
67.0
67.0
70.0
70.0
70.0
70.0
Change
-6.0
-5.0
-10.0
-10.0
-10.0
-10.0
NYMEX WTI crude
USD/b
55.5
57.0
55.0
55.0
55.0
55.0
NYMEX gas
USD/mBtu
2.4
2.6
2.6
2.4
2.4
2.6
UK spot gas
USD/mBtu
3.8
5.3
6.2
5.0
5.0
6.2
Source: Refinitiv Datastream, HSBC assumptions
Evolution of IEA and OPEC's estimates of
2019/20 global oil demand growth, mbd
OECD commercial inventories, excess vs
2010-14 average (mb and %)
Source: IEA, OPEC
Source: IEA, HSBC
OPEC supply is down 2.7mbd since
November 2018 (change, mbd)
US total liquids supply at various Brent
equivalent price assumptions, mbd
Source: IEA, HSBC
Source: Rystad Energy, HSBC estimates
0.8
1.0
1.2
1.4
1.6
1.8
Jun-18
Aug-18
Oct-18
Dec-18
Feb-19
Apr-19
Jun-19
Aug-19
IEA OPEC
IEA 2020e OPEC 2020
0%
2%
4%
6%
8%
10%
12%
14%
0
50
100
150
200
250
300
350
Jan Apr Jul Oct
2018, mb (LHS) 2019, mb (LHS)
2018, % 2019, %
32.3
29.7
- 1.32
-0.71
-0.44
-0.20
-0.09
-0.03
-0.03
0.13
28.0
28.5
29.0
29.5
30.0
30.5
31.0
31.5
32.0
32.5
33.0
Nov-18
S. Arabia
Iran
Venez.
UAE
Kuwait
Other
Libya
Iraq
Jul-19
12
14
16
18
20
22
24
26
2016 2017 2018 2019e 2020e 2021e 2022e
USD50/b USD60/b USD70/b
Equities & Commodities
●
Global
10 September 2019
4
Supply/demand: 2020 balances looking challenging
We have updated our supply/demand model, with the main changes as follows:
Demand: Given the deterioration in the economic outlook we have trimmed our 2019 and
2020 estimates of global oil demand growth to 0.8mbd (vs 1.0mbd) and 1.1mbd (vs
1.2mbd) respectively, having cut our 2020 demand estimate in July (see ‘Oil demand: H2
2019 rebound likely but risk rising’ 24 July 2019). We remain below consensus, which we
believe expects growth of the order of 1.1mbd in 2019 and 1.3mbd in 2020.
OPEC supply: We have cut our forecasts for OPEC crude supply for 2019 and 2020 to
30.3mbd (vs 30.5mbd) and 30.1mbd (vs 30.5mbd). The main change is to assume lower
Saudi Arabian/UAE output in response to what we see as a softer supply/demand outlook,
reflecting our view that OPEC will continue to aim to support prices.
US supply: We have raised our 2019 US supply growth forecast slightly to 1.7mbd (vs
1.6mbd) after a strong 2Q19. We have trimmed our 2020 growth estimate to 1.4mbd (vs
1.5mbd) in line with our reduced crude price forecasts and their expected effect on activity.
Non-OPEC supply: We have made numerous changes to our conventional non-OPEC
forecasts but on balance they broadly cancel out. Outside the US, we see non-OPEC
output growing 0.1mbd in 2019 and 0.6mbd in 2020, but moving into decline thereafter.
2019: a tighter second half. Although inventories rose in 1H19, we expect a reversal in the
second half thanks to global demand seasonality, which should see second-half demand a good
1.5mbd higher than in 1H. US supply growth is set to far exceed demand growth this year, but
continued OPEC restraint (with total OPEC supply forecast down 1.9mbd for the year) points to
an average stock draw of 0.4mbd across 2019 on our estimates.
2020 looks like a challenging year, with little scope for OPEC to raise output. We expect 2020 to
be another year where non-OPEC supply growth outstrips demand growth. Our forecasts point to
non-OPEC volumes rising 2.0mbd y/y – although we see US supply growth slowing to 1.4mbd, we
expect 0.6mbd of other non-OPEC supply growth. With demand forecast to rise by 1.1mbd this
translates into a call on OPEC crude (the amount needed to balance the market) of 29.8mbd, nearly
1mbd lower y-o-y (vs 30.7mbd) and broadly in line with OPEC’s current output. This suggests OPEC
will need to extend its cuts through 2020 if the market is not to return to significant oversupply,
although we see scope for OPEC to regain market share in the longer term.
Global oil demand, mbd
Global oil supply, mbd
Source: BP, IEA, US EIA, Rystad Energy, NPD, ANP, HSBC estimates
46.9
47.4
47.7
47.6 47.6 47.5
49.7
50.9
51.7
52.7
53.8
54.8
96.6
98.3
99.4
100.2
101.4
102.4
0.0
0.5
1.0
1.5
2.0
0
10
20
30
40
50
60
70
80
90
100
110
2016 2017 2018 2019e 2020e 2021e
OECD Non-OECD y-o-y chg (RHS)
32.2
32.1 32.1
30.3
30.1
30.2
46.5
46.5
46.9
47.0
47.6
47.2
7.4
8.2
10.3
12.0
13.4
14.6
96.3
97.1
99.8
99.9
101.6
102.4
0
10
20
30
40
50
60
70
80
90
100
110
2016 2017 2018 2019e 2020e 2021e
OPEC crude Non-OPEC OPEC NGL US tight oil
We still expect a stock draw
in 2H19, which could catch
the market off guard
We expect OPEC to maintain
supply discipline to prevent a
further price slide
5
Equities & Commodities
●
Global
10 September 2019
HSBC global supply/demand balance (mbd)
2016
2017
2018
2019e
2020e
2021e
18-21e
4y cagr
Demand
USA
19.7
20.0
20.5
20.5
20.6
20.6
0.1
Europe
14.0
14.3
14.2
14.2
14.1
14.1
-0.1
Other OECD
13.2
13.2
13.1
12.9
12.8
12.8
-0.2
Total OECD
46.9
47.4
47.7
47.6
47.6
47.5
-0.2
0.1%
Historically small -ve
China
12.3
12.8
13.5
13.9
14.4
14.7
1.2
Slower growth of 2-3%pa
India
4.7
4.9
5.2
5.3
5.4
5.6
0.4
Other Asia
8.4
8.8
8.6
8.8
8.9
9.1
0.5
Middle East
8.9
8.9
8.9
9.0
9.1
9.3
0.4
Latin America
6.4
6.4
6.4
6.4
6.4
6.5
0.1
Other non-OECD
8.9
9.1
9.1
9.3
9.5
9.7
0.6
Total non-OECD
49.7
50.9
51.7
52.7
53.8
54.8
3.1
1.9%
Slower growth in '19e
Global demand
96.6
98.3
99.4
100.2
101.4
102.4
3.0
1.0%
Modest 2020e IMO boost
Demand growth
1.2%
1.8%
1.2%
0.8%
1.1%
1.0%
Supply
Non-OPEC*
58.8
59.6
62.3
64.1
66.1
66.7
4.4
2.8%
US Permian
2.0
2.5
3.5
4.3
5.1
5.7
2.3
23.3%
Permian ~50% of US growth
Other US tight oil
3.3
3.3
3.9
4.3
4.5
4.8
0.9
9.3%
US tight NGLs
2.1
2.4
2.9
3.4
3.8
4.1
1.2
15.1%
Strong growth in US NGLs too
Total US tight liquids
7.4
8.2
10.3
12.0
13.4
14.6
4.3
15.7%
4.3mbd of US growth 2018-21e
Total US
12.4
13.1
15.3
17.1
18.5
19.5
4.2
10.4%
Other Non-OPEC
46.5
46.5
46.9
47.0
47.6
47.2
0.3
0.4%
Other non-OPEC set to decline
OPEC NGLs
5.3
5.3
5.4
5.5
5.5
5.5
0.1
0.8%
Non-OPEC & OPEC non-crude
64.1
64.9
67.7
69.6
71.6
72.2
4.5
2.7%
OPEC crude
32.2
32.1
32.1
30.3
30.1
30.2
-1.9
-1.5%
Iran losses of 1.5mbd assumed
Global supply
96.3
97.1
99.8
99.9
101.6
102.4
2.6
1.4%
Implied inventory build/(draw)
-0.2
-1.2
0.4
-0.4
0.3
0.0
A small supply deficit in 2019e
Call on OPEC crude
32.5
33.3
31.8
30.7
29.8
30.2
Annual changes, mbd
Global demand
1.2
1.7
1.1
0.8
1.1
1.0
Consensus is ~1.1mbd in '19e
USA
0.2
0.3
0.5
0.0
0.1
0.0
Europe
0.3
0.3
-0.1
0.0
0.0
0.0
Other OECD
0.2
0.0
-0.1
-0.2
-0.1
0.0
Total OECD
0.6
0.5
0.3
-0.2
0.0
0.0
China
0.3
0.5
0.7
0.4
0.4
0.4
India
0.4
0.2
0.3
0.1
0.1
0.1
Other Asia
-0.1
0.4
-0.2
0.2
0.2
0.2
Middle East
0.1
-0.1
0.0
0.1
0.1
0.1
Latin America
-0.2
0.0
0.0
0.0
0.1
0.1
Other non-OECD
0.2
0.1
0.0
0.2
0.2
0.2
Total non-OECD
0.6
1.2
0.8
1.0
1.1
1.1
Non-OPEC supply
-0.8
0.8
2.7
1.8
2.0
0.6
US Permian
0.1
0.5
1.0
0.8
0.8
0.6
Sustained Permian growth
Other US tight oil
-0.6
0.0
0.6
0.4
0.2
0.3
US tight NGLs
0.2
0.2
0.6
0.5
0.4
0.3
Total US tight liquids
-0.3
0.7
2.1
1.7
1.4
1.2
Total US
-0.4
0.8
2.2
1.7
1.4
1.0
Other non-OPEC
-0.4
0.0
0.5
0.1
0.6
-0.4
Turning negative in 2021e
Non-OPEC & OPEC NGL supply
-0.7
0.8
2.7
1.9
2.0
0.6
Call on OPEC
1.9
0.9
-1.6
-1.1
-0.9
0.4
OPEC crude production
0.9
-0.1
0.0
-1.9
-0.2
0.2
Little room to grow in 2020
Source: BP, IEA, US EIA, Rystad Energy, NPD, ANP, HSBC estimates
剩余23页未读,继续阅读
资源评论
wsnbb_2023
- 粉丝: 15
- 资源: 6004
上传资源 快速赚钱
- 我的内容管理 展开
- 我的资源 快来上传第一个资源
- 我的收益 登录查看自己的收益
- 我的积分 登录查看自己的积分
- 我的C币 登录后查看C币余额
- 我的收藏
- 我的下载
- 下载帮助
安全验证
文档复制为VIP权益,开通VIP直接复制
信息提交成功