Python图像处理二值化方法实例汇总
27 浏览量
2020-12-17
03:57:56
上传
评论
收藏 272KB PDF 举报

Python图像处理二值化方法实例汇总图像处理二值化方法实例汇总
在用python进行图像处理时,二值化是非常重要的一步,现总结了自己遇到过的6种 图像二值化的方法(当然这个绝对不是全部的二值化方法,若发现新的方法会继续新增)。
1. opencv 简单阈值 cv2.threshold
2. opencv 自适应阈值 cv2.adaptiveThreshold (自适应阈值中计算阈值的方法有两种:mean_c 和 guassian_c ,可以尝试用下哪种效果好)
3. Otsu’s 二值化
例子:
import cv2
import numpy as np
from matplotlib import pyplot as plt
img = cv2.imread('scratch.png', 0)
# global thresholding
ret1, th1 = cv2.threshold(img, 127, 255, cv2.THRESH_BINARY)
# Otsu's thresholding
th2 = cv2.adaptiveThreshold(img, 255, cv2.ADAPTIVE_THRESH_MEAN_C, cv2.THRESH_BINARY, 11, 2)
# Otsu's thresholding
# 阈值一定要设为 0 !
ret3, th3 = cv2.threshold(img, 0, 255, cv2.THRESH_BINARY + cv2.THRESH_OTSU)
# plot all the images and their histograms
images = [img, 0, th1, img, 0, th2, img, 0, th3] titles = [
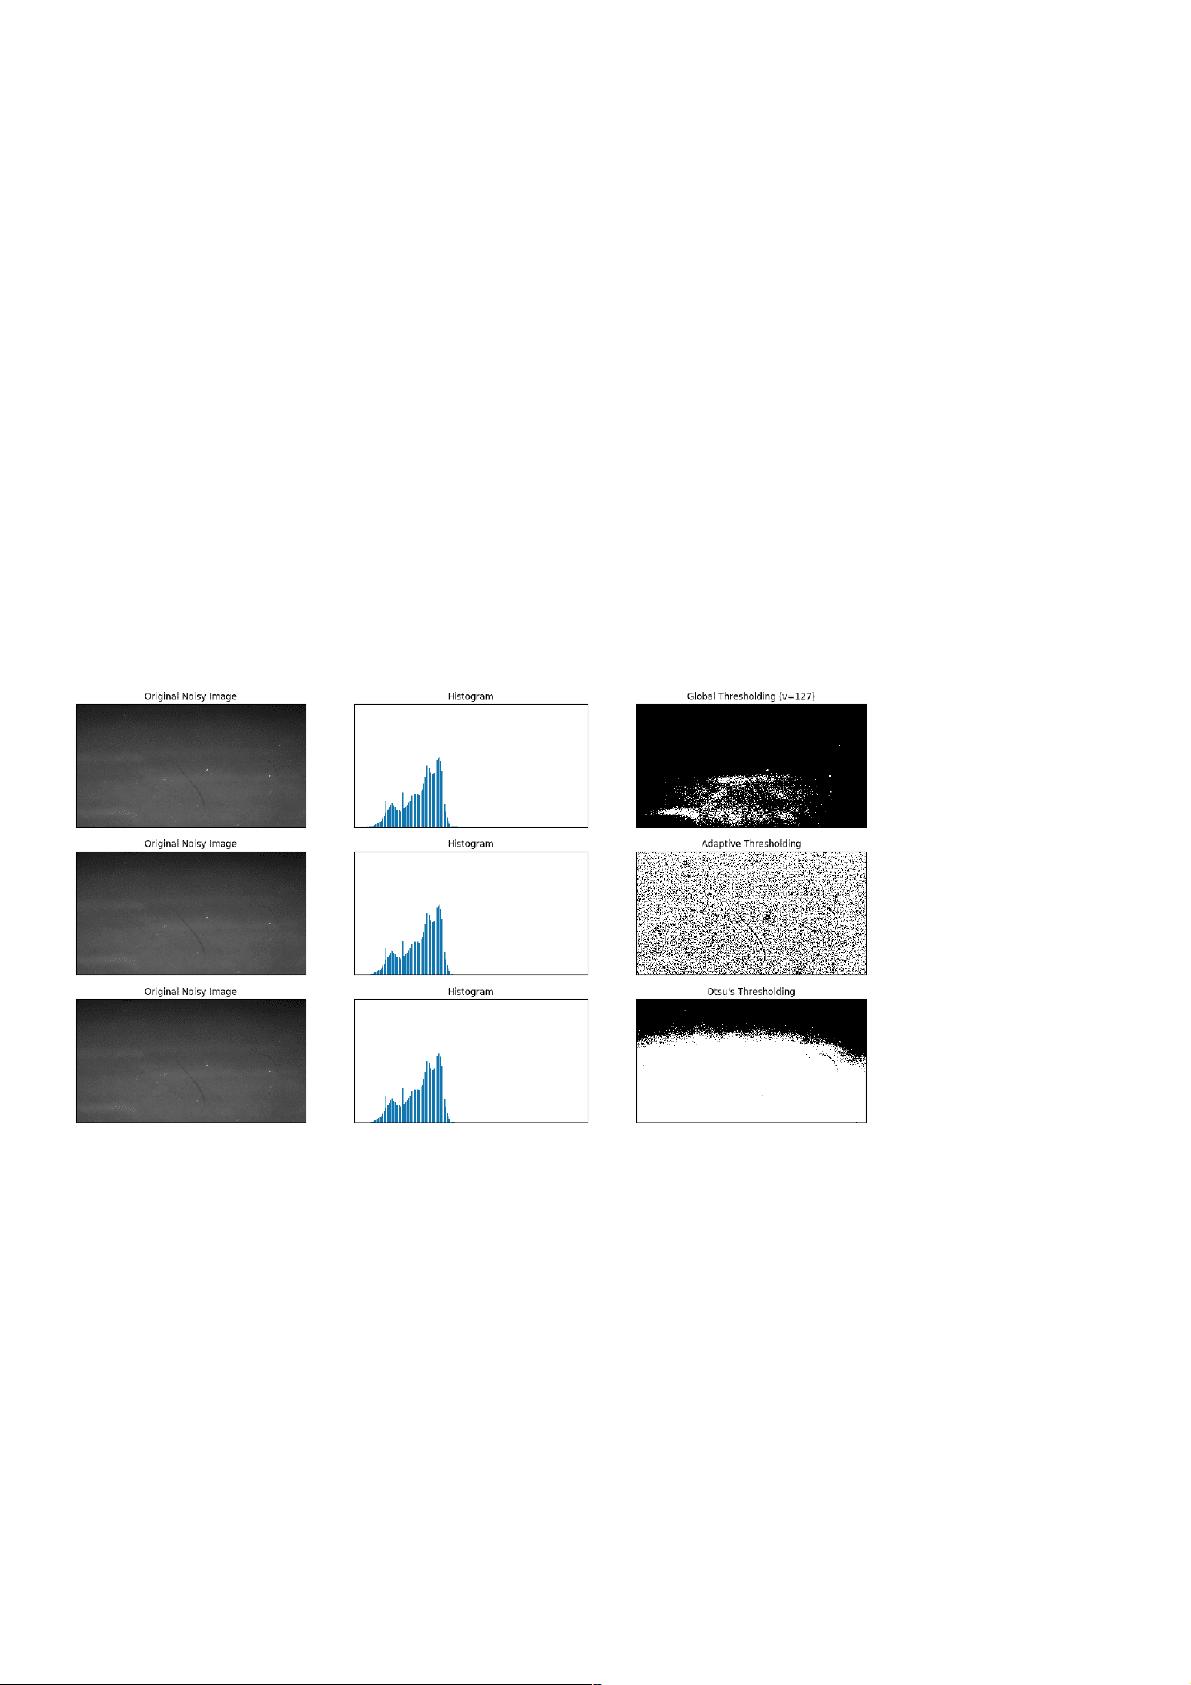
'Original Noisy Image', 'Histogram', 'Global Thresholding (v=127)',
'Original Noisy Image', 'Histogram', "Adaptive Thresholding",
'Original Noisy Image', 'Histogram', "Otsu's Thresholding"
] # 这里使用了 pyplot 中画直方图的方法, plt.hist, 要注意的是它的参数是一维数组
# 所以这里使用了( numpy ) ravel 方法,将多维数组转换成一维,也可以使用 flatten 方法
# ndarray.flat 1-D iterator over an array.
# ndarray.flatten 1-D array copy of the elements of an array in row-major order.
for i in range(3):
plt.subplot(3, 3, i * 3 + 1), plt.imshow(images[i * 3], 'gray')
plt.title(titles[i * 3]), plt.xticks([]), plt.yticks([])
plt.subplot(3, 3, i * 3 + 2), plt.hist(images[i * 3].ravel(), 256)
plt.title(titles[i * 3 + 1]), plt.xticks([]), plt.yticks([])
plt.subplot(3, 3, i * 3 + 3), plt.imshow(images[i * 3 + 2], 'gray')
plt.title(titles[i * 3 + 2]), plt.xticks([]), plt.yticks([])
plt.show()
结果图:
4. skimage niblack阈值
5. skimage sauvola阈值 (主要用于文本检测)
例子:
https://scikit-image.org/docs/dev/auto_examples/segmentation/plot_niblack_sauvola.html
import matplotlib
import matplotlib.pyplot as plt
from skimage.data import page
from skimage.filters import (threshold_otsu, threshold_niblack,
threshold_sauvola)
matplotlib.rcParams['font.size'] = 9
image = page()
binary_global = image > threshold_otsu(image)
window_size = 25
thresh_niblack = threshold_niblack(image, window_size=window_size, k=0.8)
thresh_sauvola = threshold_sauvola(image, window_size=window_size)
binary_niblack = image > thresh_niblack
binary_sauvola = image > thresh_sauvola
plt.figure(figsize=(8, 7))
plt.subplot(2, 2, 1)
plt.imshow(image, cmap=plt.cm.gray)
plt.title('Original')
plt.axis('off')
plt.subplot(2, 2, 2)
plt.title('Global Threshold')

weixin_38629362
- 粉丝: 6
- 资源: 967


最新资源
- 微软常用运行库 游戏运行库 VC++各个版本
- 微信小程序开发教程.pptx
- MyBatis动态SQL是一种强大的特性,它允许我们在SQL语句中根据条件动态地添加或删除某些部分,从而实现更加灵活和高效的数据
- 锐捷网络认证中心网络管理.pdf
- MyBatis动态SQL是一种强大的特性,它允许我们在SQL语句中根据条件动态地添加或删除某些部分,从而实现更加灵活和高效的数据
- SD8233LF是一款用于单按键触摸及接近感应开关,其用途是替代传统的机械型开关芯片IC
- 基于YOLOv5的烟雾火焰检测算法研究
- 基于STM32的联合调试侦听设备解决方案原理图PCB源文件调试工具视频(大赛作品)
- MyBatis动态SQL是一种强大的特性,它允许我们在SQL语句中根据条件动态地添加或删除某些部分,从而实现更加灵活和高效的数据
- MyBatis动态SQL是一种强大的特性,它允许我们在SQL语句中根据条件动态地添加或删除某些部分,从而实现更加灵活和高效的数据
资源上传下载、课程学习等过程中有任何疑问或建议,欢迎提出宝贵意见哦~我们会及时处理!
点击此处反馈


评论0