
Python对对CSV文件数据进行可视化文件数据进行可视化
从网上下载数据,并对这些数据进行可视化。从网上下载数据,并对这些数据进行可视化。
我们将访问并可视化两种常见格式存储的数据:CSV和JSON。分别使用Python中的csv以及json模块对他们进行处理。
然后,我们再根据下载的数据,使用matplotlib创建一个图标。
1、获取、获取CSV文件文件
我们将首先处理少量的锡卡尔的CSV格式的天气数据,将文件sitka_weather_07-2018_simple.csv复制到创建的程序文件夹中。
附上文件链接:附上文件链接:
csv文件下载链接 提取码:zwfj
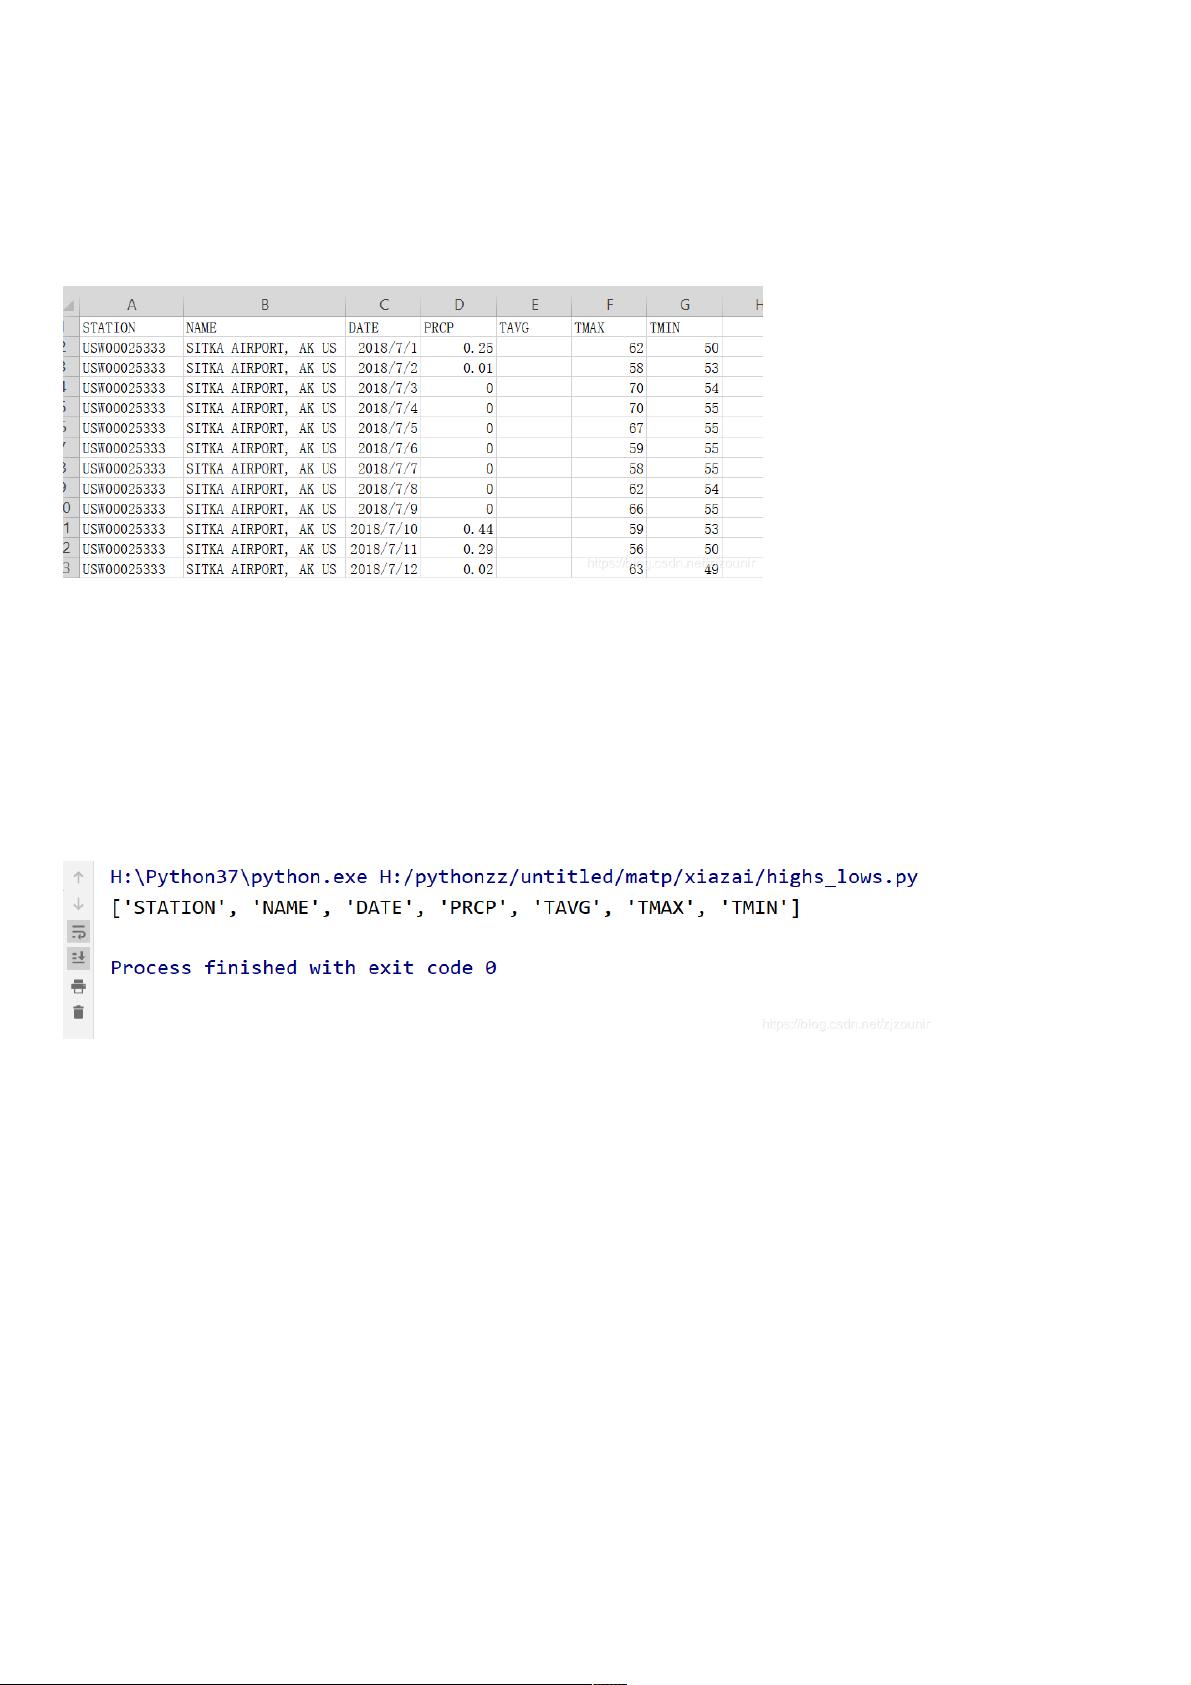
打开打开
CSV
文件如下图所示文件如下图所示
(
如下几项数据如下几项数据
):
2、分析、分析CSV数据数据
直接在Python中调用csv模块,尝试着打印csv文件每行包含什么数据,是否和上方截图相同。
新建新建highs_lows.py文件文件
import csv
#将文件名存储在filename中
filename='sitka_weather_2018_simple.csv'
with open(filename) as f:
#创建阅读器(调用csv.reader()将前面存储的文件对象最为实参传给它)
reader=csv.reader(f)
#调用了next()一次,所以这边只调用了文件的第一行,并将头文件存储在header_row中
header_row=next(reader)
print(header_row)
测试结果如下(代码不懂的看注释):测试结果如下(代码不懂的看注释):
和上面的和上面的csv文件第一行对比是相同的。文件第一行对比是相同的。
3、打印文件头及其位置、打印文件头及其位置
从csv文件中我们可以看出数据并不是很多,基本是我们要用到的,如果是数据量足够大,每行足够多,这时候我们找数据位置的话,会有些繁琐,这边我们可以对文件头进行索引。
修改修改highs_lows.py文件文件
import csv
#将文件名存储在filename中
filename='sitka_weather_2018_simple.csv'
with open(filename) as f:
#创建阅读器(调用csv.reader()将前面存储的文件对象最为实参传给它)
reader=csv.reader(f)
#调用了next()一次,所以这边只调用了文件的第一行,并将头文件存储在header_row中
header_row=next(reader)
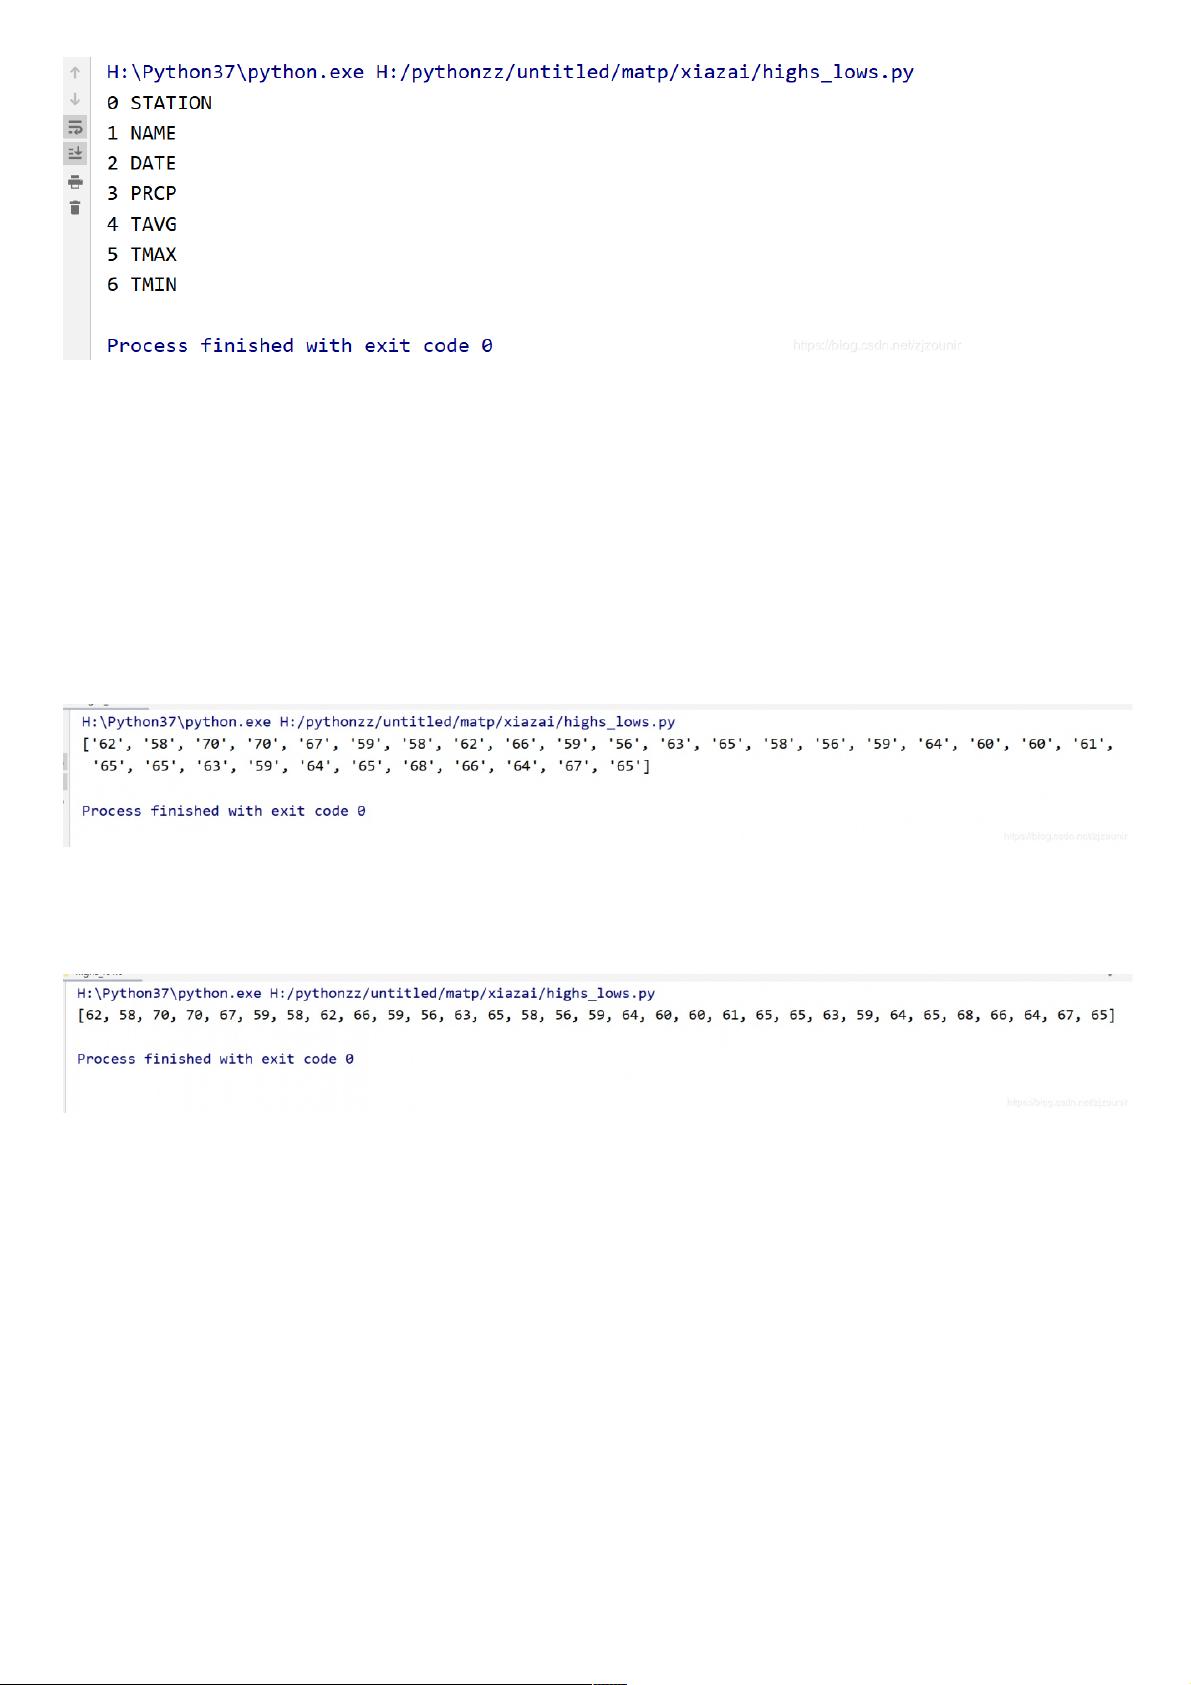
for index,column_header in enumerate(header_row):
print(index,column_header)
输出结果如下,指出了每个头文件的索引:输出结果如下,指出了每个头文件的索引:
从中我们可以得出日期和最高气温分别存储在第2列和第5列
剩余7页未读,继续阅读


评论1
最新资源