没有合适的资源?快使用搜索试试~ 我知道了~
2019-InceptionGCN, Receptive Field Aware Graph-基于矩阵+图表示-rrr1
需积分: 0 0 下载量 64 浏览量
2022-08-04
12:25:19
上传
评论
收藏 656KB PDF 举报
温馨提示
试读
12页
2019-InceptionGCN, Receptive Field Aware Graph-基于矩阵+图表示-rrr1
资源详情
资源评论
资源推荐
InceptionGCN: Receptive Field Aware Graph
Convolutional Network for Disease Prediction
Anees Kazi
1
, Shayan Shekarforoush
2
, S.Arvind krishna
3
, Hendrik Burwinkel
1
,
Gerome Vivar
1,4
, Karsten Kort
¨
um
5
, Seyed-Ahmad Ahmadi
4
, Shadi
Albarqouni
1
, and Nassir Navab
1,6
1
Computer Aided Medical Procedures (CAMP), Technical University of Munich,
Munich, Germany
2
Sharif University of Technology, Tehran, Iran
3
Department of Computer Science and Engineering, National Institute of Technology
Tiruchirappalli, India
4
German Center for Vertigo and Balance Disorders, Ludwig Maximilians Universit
¨
at
M
¨
unchen, Germany
5
Augenklinik der Universit
¨
at, Klinikum der Universit
¨
at M
¨
unchen, Germany
6
Whiting School of Engineering, Johns Hopkins University, Baltimore, USA
Abstract. Geometric deep learning provides a principled and versatile
manner for integration of imaging and non-imaging modalities in the
medical domain. Graph Convolutional Networks (GCNs) in particular
have been explored on a wide variety of problems such as disease pre-
diction, segmentation, and matrix completion by leveraging large, multi-
modal datasets. In this paper, we introduce a new spectral domain archi-
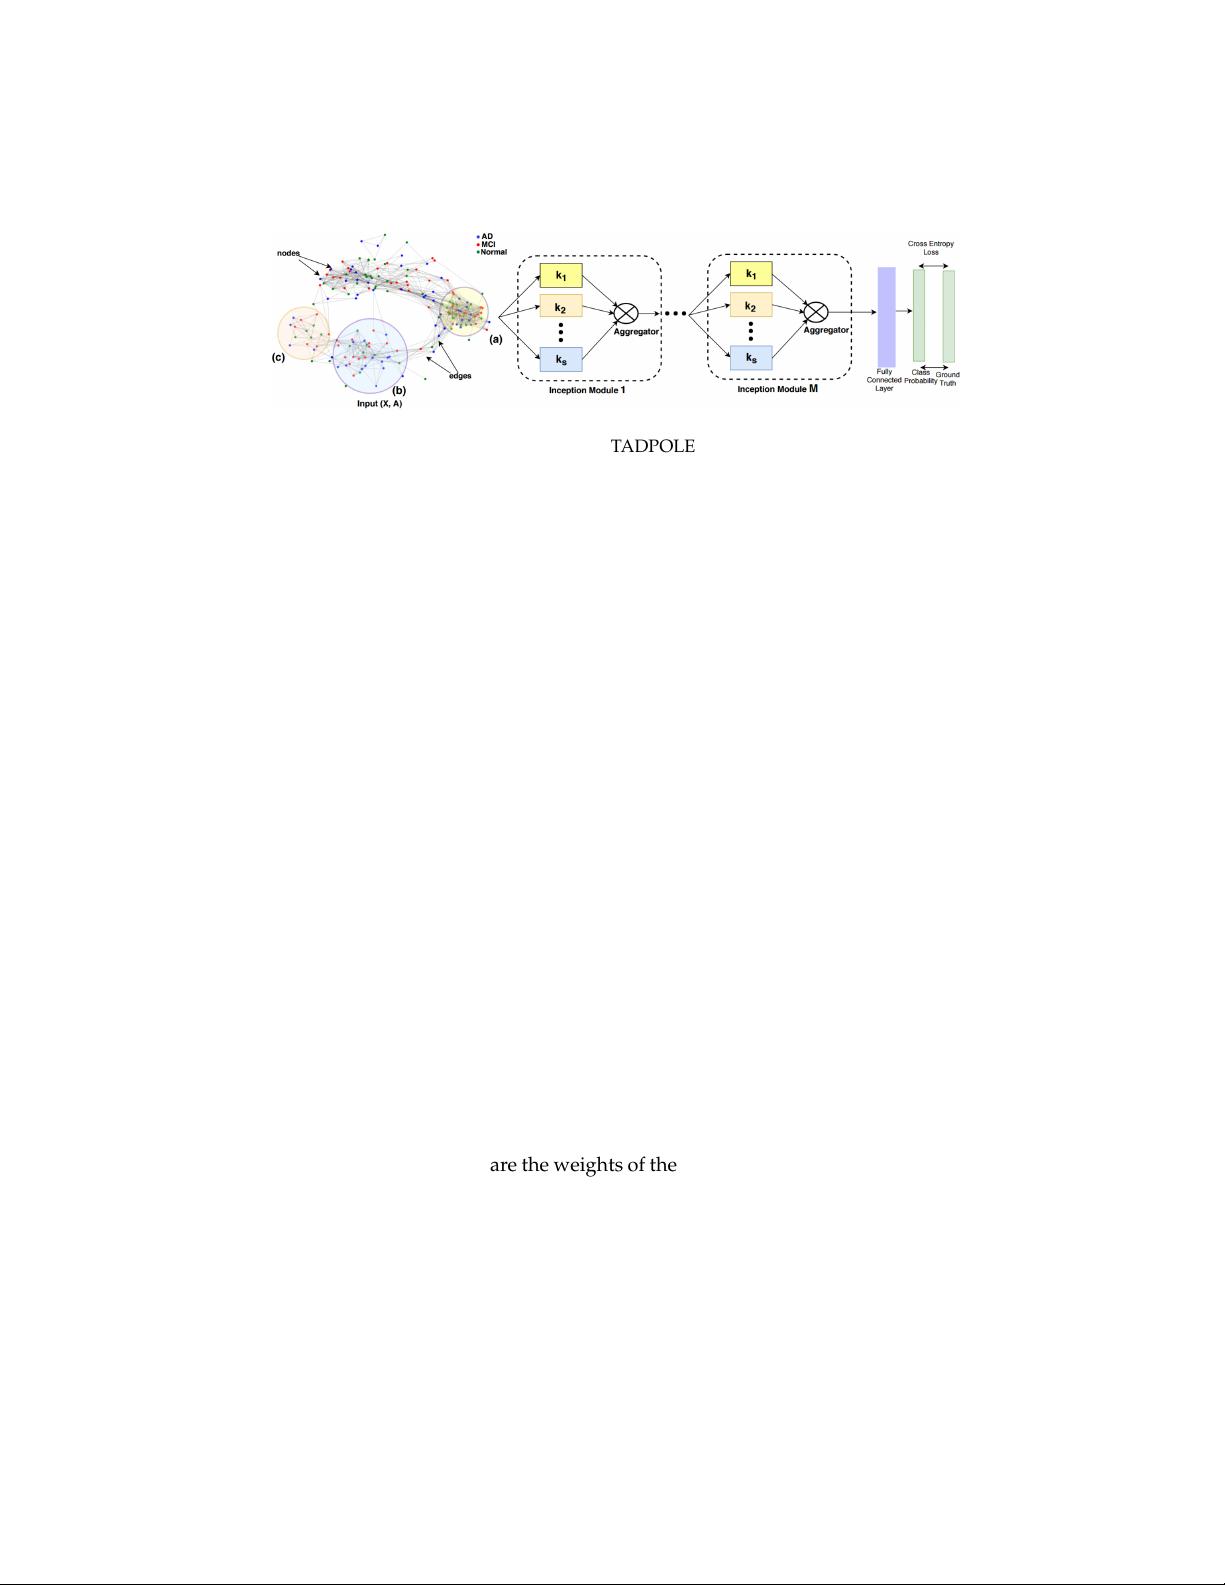
tecture for deep learning on graphs for disease prediction. The novelty lies
in defining geometric ’inception modules’ which are capable of captur-
ing intra- and inter-graph structural heterogeneity during convolutions.
We design filters with different kernel sizes to build our architecture. We
show our disease prediction results on two publicly available datasets.
Further, we provide insights on the behaviour of regular GCNs and our
proposed model under varying input scenarios on simulated data.
1 Introduction
There is an increasing focus on applying deep learning on unstructured data in
the medical domain, especially using Graph Convolutional Networks (GCNs)
[1]. Multiple applications have been demonstrated so far, including Autism
Spectrum Disorder prediction with manifold learning to distinguish between
diseased and healthy brains [2], matrix completion to predict the missing val-
ues in medical data [3], and finding drug similarity using graph auto encoders
[4]. In this paper, we study the task of Alzheimer and Autism disease prediction
with complementary imaging and non-imaging multi-modal data.
In above works, GCNs had a remarkable impact on the usage of multi-
modal medical data. One key difference to previous learning-based methods
is to set patients in relation to each other with a neighborhood graph, often by
arXiv:1903.04233v1 [cs.LG] 11 Mar 2019
2 A. Kazi et al.
associating them through non-imaging data like gender, age, clinical scores or
other meta-information. On this graph, patients can be considered as nodes, pa-
tient similarities are represented as edge weights and features from e.g. imag-
ing modalities are incorporated through graph signal processing. GCNs then
provide a principled manner for learning optimal graph filters that minimize a
objective. Here, we use node-level classification for our disease prediction task.
A simple analogy to node-based classification of the population is image
segmentation with CNNs, where each pixel is a node and the image grid is the
graph. In such domains, filters with a constant size can manage to acquire se-
mantic features over the whole grid domain, given convolutions over a constant
number of equidistant neighbors. In the case of irregular graphs, the number of
neighbors and their distance from each other leads to heterogeneous density
and local structure. Applying filters with constant kernel size over the whole
grid domain might not produce semantic and comparable features.
In medical datasets, graphs defined on patient’s data observe similar het-
erogeneity, as each patient may have a distinct combination of non-imaging
data and different number of neighbors. A concrete example is shown in Fig.
1 (left), which depicts a population graph of 150 subjects for Alzheimer’s dis-
ease classification, who are arranged in clusters of varying density and local
topology (regions a, b and c). Such heterogeneity in the graph structure should
be considered to learn cluster-specific features. A model capable of producing
similar intra-cluster and different inter-cluster features can be designed by ap-
plying multi-sized kernels on the same input. To this end, we propose Incep-
tionGCN, inspired by the successful inception [5] architecture for CNNs. Our
model leverages spectral convolutions with different kernel sizes and chooses
optimal features to solve the classification problem.
To the best of our knowledge, there is not much related literature that fo-
cuses on receptive fields of GCN filters. Earlier works [1,6] use GCNs with
constant filter size for the node-based classification task and show the supe-
riority of GCN but do not address the problem of heterogeneity of the graph.
In [7], a method is proposed that determines a receptive path for each node
rather than a field for performing the convolutions for representation learn-
ing. Irrespective of nearest neighbors, the aim is to perform convolutions with
selective nodes in the receptive field. In [8], a DenseNet-like architecture [9] is
proposed, in which outputs from consecutive layers are concatenated. Here, the
receptive field is addressed in an indirect way since the output features of suc-
cessive layers depend on multiple previous layers through skip connections.
Another work [10] uses features that are either fixed, hand-designed or based
on aggregator-functions. Moreover, the method needs a pre-defined order of
nodes which is difficult to obtain.
In this paper we show that InceptionGCN is an improvement in terms of
performance and convergence. Our contributions are: (1) we analyze the inter-
dependence of graph structure and filter sizes on one artificial and two public
medical datasets and in doing so, we motivate the need for multiple kernel
size. (2) We propose our novel InceptionGCN model with multiple filter kernel
InceptionGCN 3
Fig. 1. Left: Affinity graph with clusters for TADPOLE dataset, different cluster sizes are
depicted at points (a), (b) and (c). Right: Setup of InceptionGCN, feature matrix X is pro-
cessed by several GC-layers with considered neighborhood k
1
, · · · , k
S
in each inception
module. The output of each layer is used in the aggregator function.
sizes. We validate it on artificial and clinical data and the show improved per-
formance over regular GCN architectures. (3) We demonstrate the robustness
of our model towards different approaches for constructing graph adjacency
from non-imaging data.
2 Methodology
Traditional models [11] use a constant filter size throughout all layers, which
forces the features of every node to be learned using neighbors at a fixed num-
ber of hops away without consideration of cluster size and shape. Our pro-
posed InceptionGCN model overcomes this limitation by varying the filters’
size across the GC-layers in order to produce class separable output features.
This property of our model is highly desirable when each class distribution has
distinct variance and/or when the classes are heavily overlapping. Utilizing
this setting, we target to solve the disease classification task by incorporating
semantics of varied associations coming from different graphs within the popu-
lation. We provide a detailed description of the model starting from the affinity
graph construction followed by the mathematical background and a discussion
of the proposed model architecture.
2.1 Affinity graph construction
The construction of an affinity graph is crucial to accurately model the interac-
tions among the patients and should be designed carefully. The affinity graph
G =
(
V, E, W
)
is constructed on the entire population (including training and
testing samples) of the patients, where
|
V
|
= N vertices, E are the edge connec-
tions of the graph and W are the weights of the edges. Considering each patient
as a node n
i
in the graph, G incorporates the similarities between the patients
with respect to the non-imaging data η. The features x
i
∈ R
N
at every node
n
i
are fetched from imaging data. First, we construct a binarized edge graph
E ∈ R
N×N
representing the connections. Mathematically, E can be defined as
E
i,j
=
1 i f
η
i
− η
j
< β
0 otherwise
(1)
剩余11页未读,继续阅读
甜甜不加糖
- 粉丝: 27
- 资源: 323
上传资源 快速赚钱
- 我的内容管理 展开
- 我的资源 快来上传第一个资源
- 我的收益 登录查看自己的收益
- 我的积分 登录查看自己的积分
- 我的C币 登录后查看C币余额
- 我的收藏
- 我的下载
- 下载帮助
安全验证
文档复制为VIP权益,开通VIP直接复制
信息提交成功
评论0