没有合适的资源?快使用搜索试试~ 我知道了~
【莱坊】Care Homes Trading Performance Review 2023.pdf
0 下载量 185 浏览量
2024-01-16
17:57:52
上传
评论
收藏 4.04MB PDF 举报
温馨提示
![preview](https://dl-preview.csdnimg.cn/88750796/0001-30df5303860eec507f926428f8d7cfff_thumbnail.jpeg)
![preview-icon](https://csdnimg.cn/release/downloadcmsfe/public/img/scale.ab9e0183.png)
试读
28页
国庆楼市,中国房地产报告,写字楼报告,加密资产,金融
资源推荐
资源详情
资源评论
![torrent](https://img-home.csdnimg.cn/images/20210720083646.png)
![zip](https://img-home.csdnimg.cn/images/20210720083736.png)
![pdf](https://img-home.csdnimg.cn/images/20210720083512.png)
![pdf](https://img-home.csdnimg.cn/images/20210720083646.png)
![pdf](https://img-home.csdnimg.cn/images/20210720083512.png)
![epub](https://img-home.csdnimg.cn/images/20210720083646.png)
![application/pdf](https://img-home.csdnimg.cn/images/20210720083512.png)
![crx](https://img-home.csdnimg.cn/images/20210720083646.png)
![rar](https://img-home.csdnimg.cn/images/20210720083606.png)
![epub](https://img-home.csdnimg.cn/images/20210720083646.png)
![zip](https://img-home.csdnimg.cn/images/20210720083736.png)
![pdf](https://img-home.csdnimg.cn/images/20210720083512.png)
![doc](https://img-home.csdnimg.cn/images/20210720083327.png)
![](https://csdnimg.cn/release/download_crawler_static/88750796/bg1.jpg)
knightfrank.com/research2023
A deep dive into the sectors journey towards normality.
UK Care Homes
Trading Performance Review
![](https://csdnimg.cn/release/download_crawler_static/88750796/bg2.jpg)
UK CARE HOMES TRADING PERFORMANCE REVIEW
Introduction
As in previous years, we are incredibly
proud to release our 12th annual Care
Homes Trading Performance Survey.
With continued economic pressures
globally and inflated operational costs,
the greatly appreciated contributions
from all the survey participants
are valuable in the continued
understanding of the healthcare
sector’s resilience.
This year, the report focuses
on nearly 80% of the corporate
care market, with over 100,000 care
beds across 781 UK towns and
cities, representing around a fifth
of the market.
We have seen the improvement
of many KPIs tracked, including an
average occupancy level of 86.4%, up
from 83.4% in 2022. Average weekly
fees have grown approximately 9.6% to
£1,074 per week. However, we have seen
EBITDARM track back slightly to 25%.
We have also taken a deeper dive into
utility costs to understand how inflation
has impacted these for operators.
RYAN RICHARDS,
ASSOCIATE
Page 3
SURVEY IN NUMBERS
Page 4
OPERATOR SENTIMENT SURVEY
Page 5
SAMPLE OVERVIEW
Page 7
OCCUPANCY
Page 10
FEES AND SOURCE OF FUNDING
Page 12
COSTS STAFFING
Page 19
PROFITABILITY
Page 22
SECTOR REGULATION
Page 23
KNIGHT FRANK WELLBEING INDEX
Page 26
FORWARD VIEW
Page 27
KEY THEMES
Contents
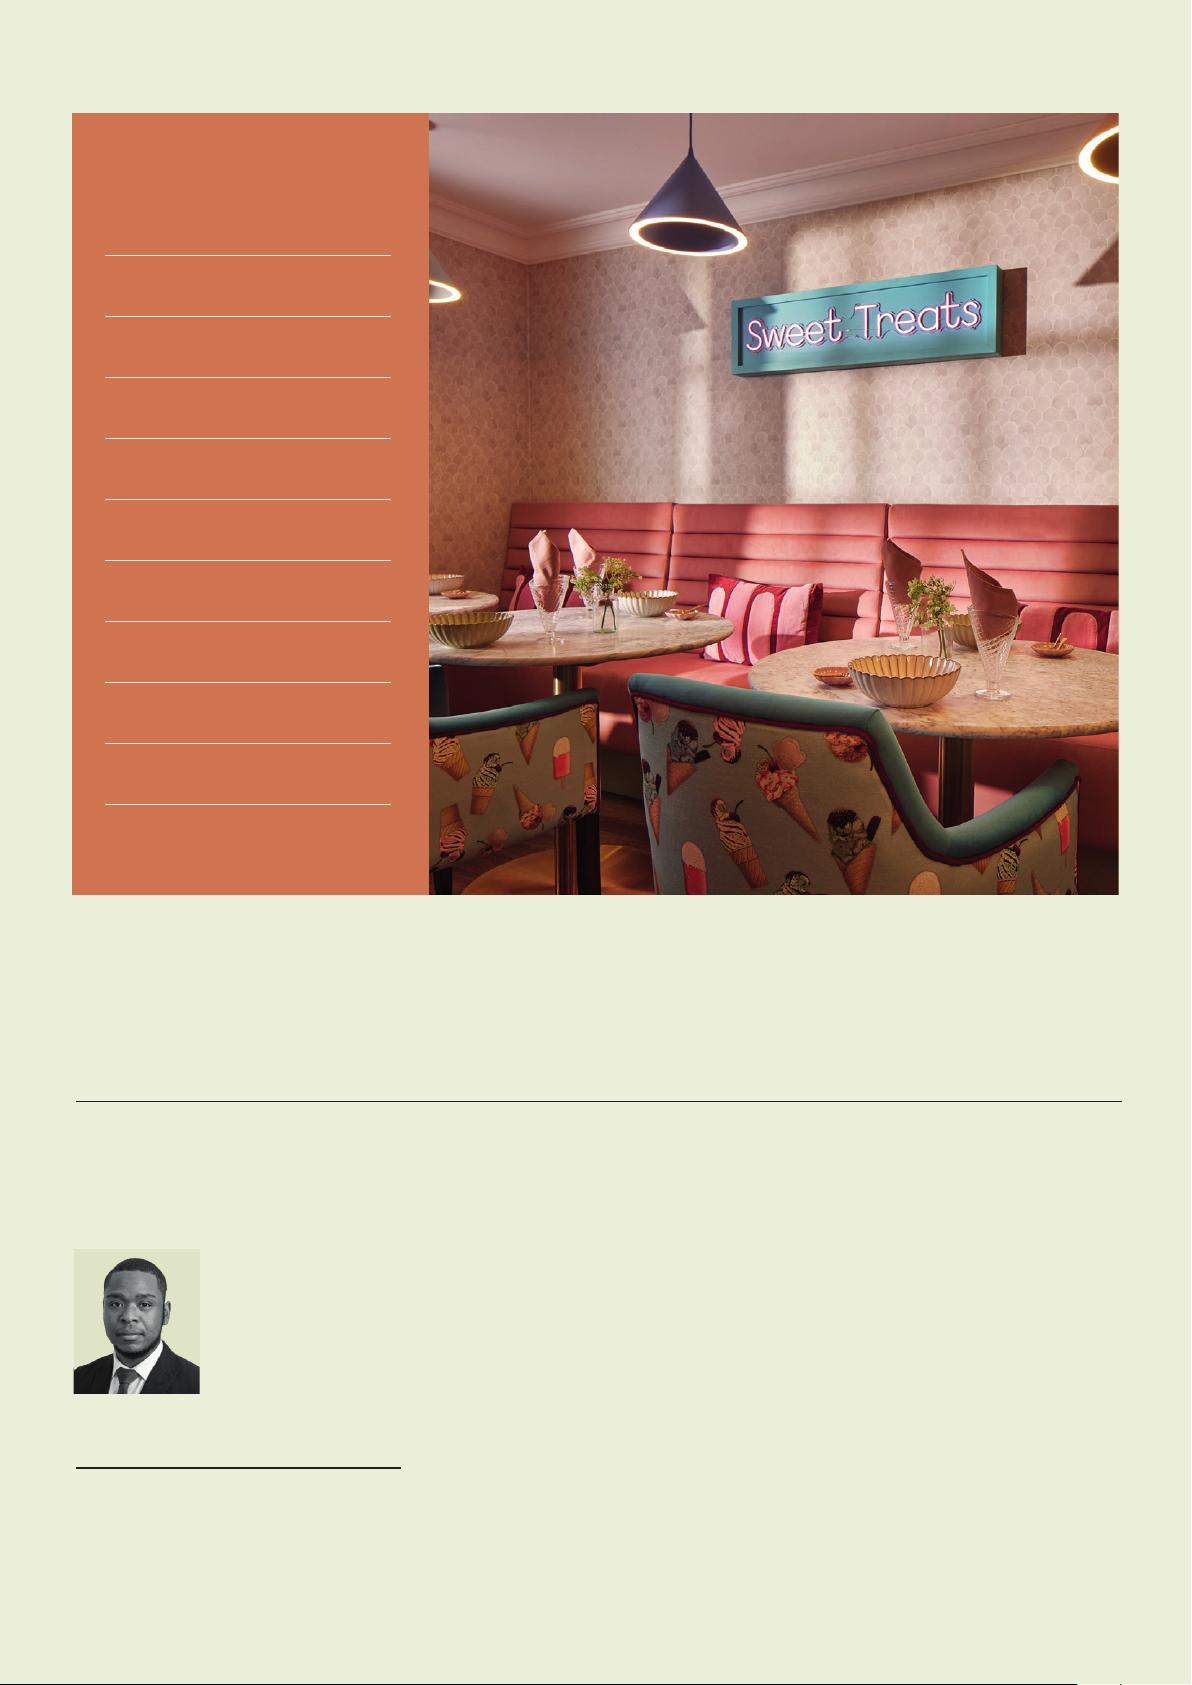
Angmering Grange Care Home (Hallmark Care Homes) - winner of the Care Home Design Award
![](https://csdnimg.cn/release/download_crawler_static/88750796/bg3.jpg)
UK CARE HOMES TRADING PERFORMANCE REVIEW
Average Weekly Fee (£)
ALL CARE PERSONAL NURSING
£1074 £926 £1169
PRIVATE PAY LOCAL AUTHORITY PRIVATE PAY LOCAL AUTHORITY PRIVATE PAY LOCAL AUTHORITY
£1307 £980 £1194 £821 £1466 £1067
Occupancy %
ALL CARE PERSONAL NURSING
86.4% 86.0% 86.6%
PRIVATE PAY LOCAL AUTHORITY PRIVATE PAY LOCAL AUTHORITY PRIVATE PAY LOCAL AUTHORITY
83.8% 87.9% 84.5% 88.1% 82.7% 87.9%
Staff Costs (%)
ALL CARE PERSONAL NURSING
59.4% 57.9% 60.0%
PRIVATE PAY LOCAL AUTHORITY PRIVATE PAY LOCAL AUTHORITY PRIVATE PAY LOCAL AUTHORITY
48.8% 68.1% 50.4% 66.1% 46.1% 69.6%
EBITDARM (%)
ALL CARE PERSONAL NURSING
25% 25.3% 24.8%
PRIVATE PAY LOCAL AUTHORITY PRIVATE PAY LOCAL AUTHORITY PRIVATE PAY LOCAL AUTHORITY
34.3% 16.8% 35.4% 15% 35% 17%
2023 Survey in Numbers
![](https://csdnimg.cn/release/download_crawler_static/88750796/bg4.jpg)
Operator Sentiment Survey
What level of impact has rising utility costs had on your
homes overall profitability?
% of respondents
To what extent has government intervention / support aided
the trading of your homes over the past 2 years?
% of respondents
What would you suggest is the biggest inflationary pressure
on the current trading of the homes in your portfolio?
% of respondents
Overall how far would you suggest your homes are from a
return to operating at pre-pandemic levels?
% of respondents
Do you believe that the current inflationary pressures will
greatly impact your operations?
% of respondents
Are there contingencies / support in place or available for
the business to absorb this pressure?
% of respondents
No impact Slight impact Moderate
impact
Strong impact Too erly /
not enough
informtion to sy
5%
18%
36%
32%
9%
Yes
83%
Already back at pre-
pandemic levels
Less than 6 months
6-12 months
12-24 months
Mild
Yes
Little to no
benefit
Significant
Moderate
No
No
13%
Unsure
4%
83%
of respondents feel inflationary
pressures will impact operations
17%
13%
22%
48%
78%
22%
39%
35%
4%
22%
Staff costs
75%
Utilities costs
17%
4% 4%
Food
costs
Maintenance
costs
UK CARE HOMES TRADING PERFORMANCE REVIEW
![](https://csdnimg.cn/release/download_crawler_static/88750796/bg5.jpg)
UK CARE HOMES TRADING PERFORMANCE REVIEW 2023
Sample Overview
Table 1 shows our consistency
check of the key metrics based on a
like-for-like sample, checking whether
year-on-year changes are consistent or
distorted by any changes in operator
composition. Again, as metrics such
as fees, occupancy, and staff costs
resemble the like-for-like sample, we
can be comfortable with the accuracy
of the presented trends.
Despite the sample representing
a significant portion of the sector,
accuracy and consistency remain
fundamental to our assessment. We,
therefore, continue to run our regional
analysis, which can be seen in Figure
1, showing the regional composition
of the sample in comparison to
the total UK market. Once again,
this highlights the closeness in the
correlation between our sample set
and the overall market, except Wales
and Northern Ireland, in which the
sample remains underweight.
Figure 1: Regional share – Knight Frank survey vs total UK stock
South East
East of England
North West
Yorkshire & The Humber
West Midlands
South West
Scotland
London
East Midlands
North East
Northern Ireland
Wales
16%
10%
12%
9%
10%
8%
6%
8%
5%
3%
5%
Source: Knight Frank Research
9%
Total UK Market
Knight Frank survey
17%
13%
11%
9%9%
9%
8%
7%
7%
6%
3%
1%
2023 change 2023 LFL change
AWF 9.6% 8.6%
Occupancy
.% .%
Staff
8.4% 8.2%
Table 1: 2023 Results like for like comparison
剩余27页未读,继续阅读
资源评论
![avatar-default](https://csdnimg.cn/release/downloadcmsfe/public/img/lazyLogo2.1882d7f4.png)
![avatar](https://profile-avatar.csdnimg.cn/2a2ff6478d9e4874bff6426414fa1160_u012842807.jpg!1)
花生糖@
- 粉丝: 1627
- 资源: 469
上传资源 快速赚钱
我的内容管理 展开
我的资源 快来上传第一个资源
我的收益
登录查看自己的收益我的积分 登录查看自己的积分
我的C币 登录后查看C币余额
我的收藏
我的下载
下载帮助
![voice](https://csdnimg.cn/release/downloadcmsfe/public/img/voice.245cc511.png)
![center-task](https://csdnimg.cn/release/downloadcmsfe/public/img/center-task.c2eda91a.png)
安全验证
文档复制为VIP权益,开通VIP直接复制
![dialog-icon](https://csdnimg.cn/release/downloadcmsfe/public/img/green-success.6a4acb44.png)