

1
Omni-frequency Channel-selection Representations
for Unsupervised Anomaly Detection
Yufei Liang
∗
, Jiangning Zhang
∗
, Shiwei Zhao, Runze Wu, Yong Liu
†
, and Shuwen Pan
Abstract—Density-based and classification-based methods have
ruled unsupervised anomaly detection in recent years, while
reconstruction-based methods are rarely mentioned for the poor
reconstruction ability and low performance. However, the latter
requires no costly extra training samples for the unsupervised
training that is more practical, so this paper focuses on improving
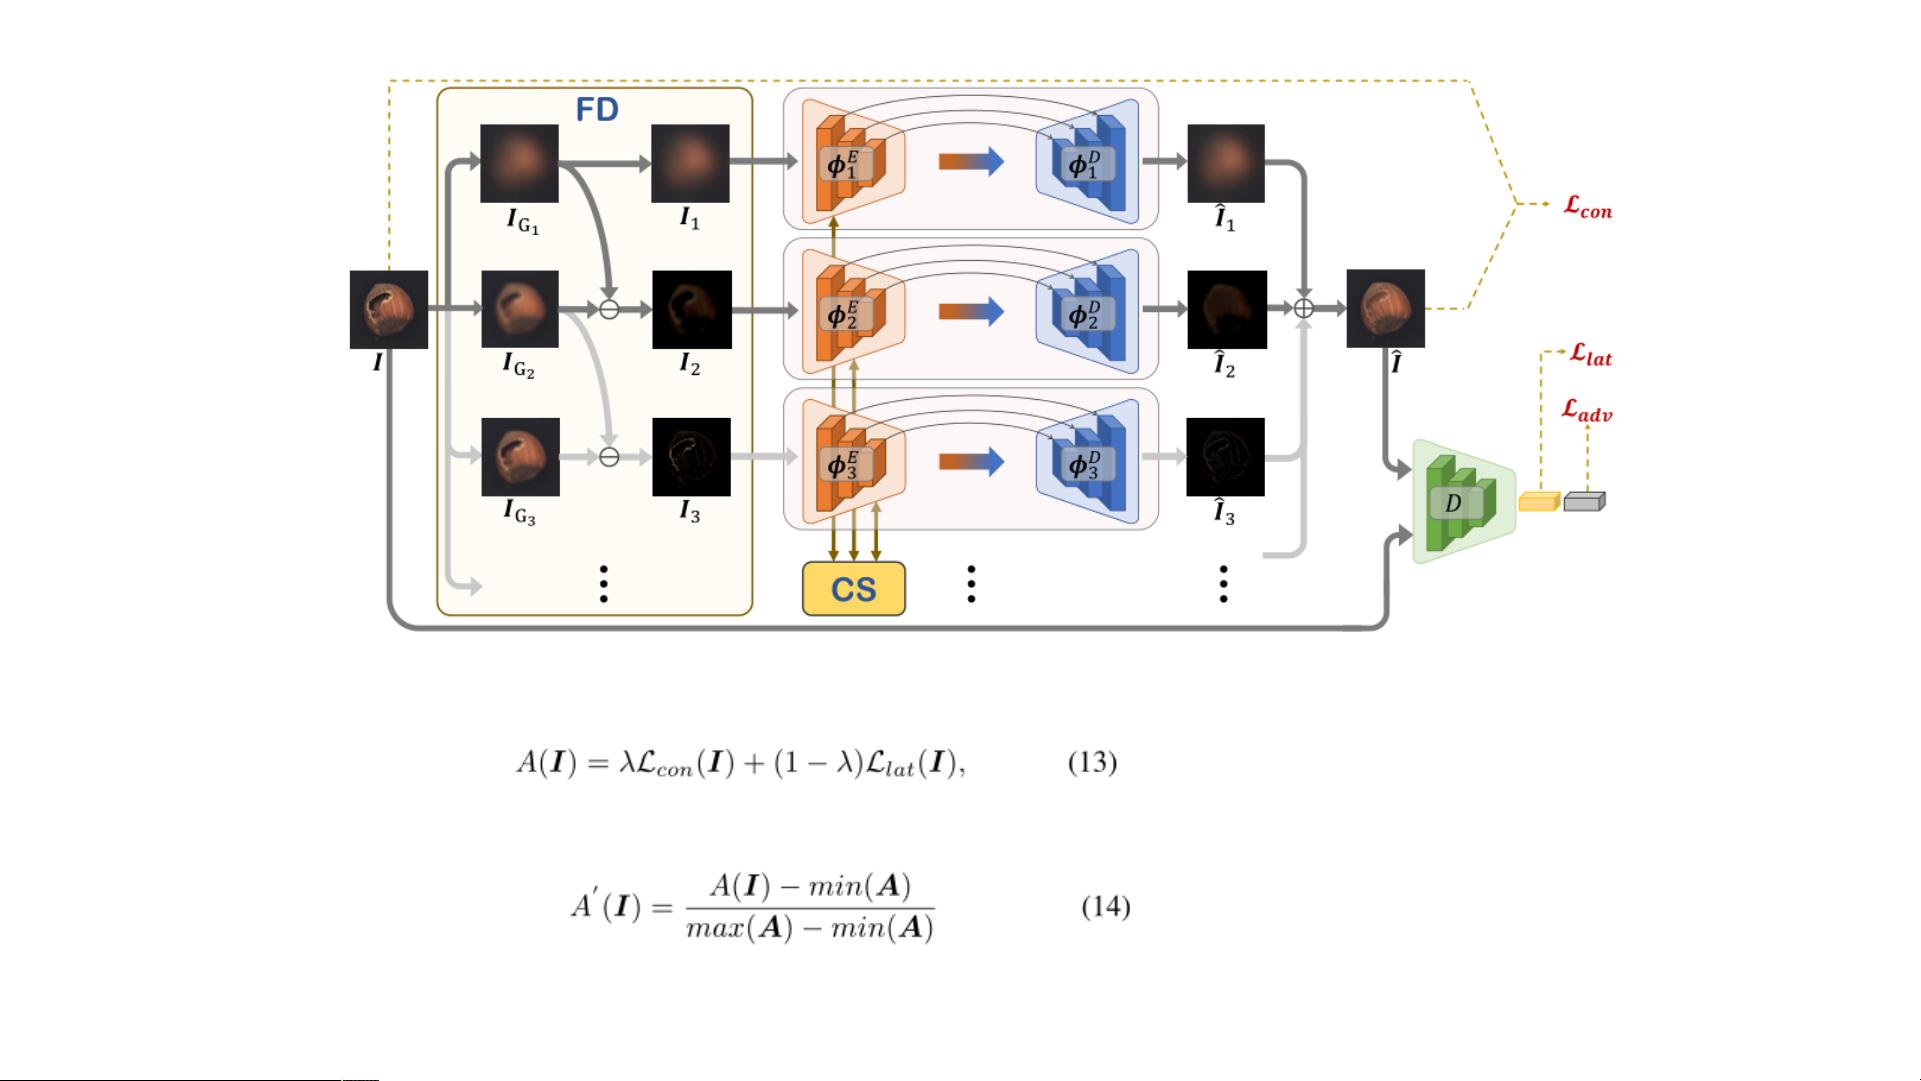
this kind of method and proposes a novel Omni-frequency
Channel-selection Reconstruction (OCR-GAN) network to handle
anomaly detection task in a perspective of frequency. Concretely,
we propose a Frequency Decoupling (FD) module to decouple
the input image into different frequency components and model
the reconstruction process as a combination of parallel omni-
frequency image restorations, as we observe a significant dif-
ference in the frequency distribution of normal and abnormal
images. Given the correlation among multiple frequencies, we
further propose a Channel Selection (CS) module that performs
frequency interaction among different encoders by adaptively
selecting different channels. Abundant experiments demonstrate
the effectiveness and superiority of our approach over different
kinds of methods, e.g., achieving a new state-of-the-art 98.3
detection AUC on the MVTec AD dataset without extra training
data that markedly surpasses the reconstruction-based baseline
by +38.1↑ and the current SOTA method by +0.3↑. Source code
will be available at https://github.com/zhangzjn/OCR-GAN.
Index Terms—Anomaly detection, omni-frequency decoupling,
unsupervised learning, reconstruction-based network.
I. INTRODUCTION
A
NOMALY detection is a binary classification task to
distinguish whether a given image deviates from the
predefined normality, which is an essential task in visual image
understanding that has various applications in the real world,
e.g., novelty detection [1], product quality monitoring based on
industrial images [2], automatic defect restoration [3], human
health monitoring [4] and video surveillance [5]–[8]. In real-
world applications, anomaly detection tasks can be divided
into sensory AD (Fig. 1a) and semantic AD (Fig. 1b): the
former only suffers from covariate shift without semantic shift,
while the later is the opposite. Most anomalies appear in
the form of defects in the sensory AD, such as the normal
defect detection task in MVTec AD [2] and KolektorSDD [9]
∗
Equal contribution.
†
Corresponding author.
Yufei Liang, Jiangning Zhang, and Yong Liu are with the Laboratory of
Advanced Perception on Robotics and Intelligent Learning, College of Control
Science and Enginneering, Zhejiang University, Hangzhou 310027, China;
Email: 22032139@zju.edu.cn, 186368@zju.edu.cn, yongliu@iipc.zju.edu.cn.
Shuwen Pan is with the Discipline of Control Science and Engineering,
School of Information and Electrical Engineering, Zhejiang University City
College, Hangzhou 310015, China; Email: pansw@zucc.edu.cn
Shiwei Zhao and Runze Wu are with the Fuxi AI Lab, NetEase
Games, Hangzhou 310012, China; Email: zhaoshiwei@corp.netease.com,
wurunze1@corp.netease.com.
Normal Normal
Normal Abnormal
Train
Test
Normal
Normal
Normal
Abnormal
Train
Test
Sensory Anomaly Detection
Semantic Anomaly Detection
& One-Class Detection
Cat
Cat Cat
Dog
Cat
Fig. 1. Illustrations of sensory anomaly detection (Left) and semantic
anomaly detection (Right) .
datasets. However, semantic AD task detects images with label
shifts, assuming that normal and abnormal come from different
semantic distributions, such as the one-class detection task in
CIFAR-10 [10]. This work focus on solving the sensory AD
task but also evaluate on the related semantic AD dataset.
In anomaly detection, obtaining abnormal samples and
detecting novel abnormalities are time-consuming and costly
objects that force us to develop unsupervised methods for
more practical applications. Current unsupervised anomaly
detection methods are mainly divided into three categories:
density-based (Fig. 2a), classification-based (Fig. 2b) and
reconstruction-based (Fig. 2c) methods. a) Density-based
methods generally employ a pre-trained model to extract
meaningful vectors of the input image. The anomaly score
can be obtained by calculating the similarity between the
embedding representation of the test image and the reference
density distribution. This kind of method [11]–[13] achieves
a high AUC score on the popular MVTec AD [2] dataset, but
they need pre-trained models and are insufficient for the model
interpretability. b) Classification-based methods try to find
the classification boundaries of normal data. Self-supervised
methods are representative of classification-based methods,
which use the model trained by the proxy task to detect
anomalies. Thus, self-supervised methods rely on how well the
proxy tasks match the test data. For example, CutPaste [14]
performs well in anomaly detection on MVTec AD dataset.
However, it is difficult for this method to perform well on other
datasets. Also, these methods need pre-trained models and
arXiv:2203.00259v1 [cs.CV] 1 Mar 2022