export_fig
==========
A toolbox for exporting figures from MATLAB to standard image and document formats nicely.
### Overview
Exporting a figure from MATLAB the way you want it (hopefully the way it looks on screen), can be a real headache for the unitiated, thanks to all the settings that are required, and also due to some eccentricities (a.k.a. features and bugs) of functions such as `print`. The first goal of export_fig is to make transferring a plot from screen to document, just the way you expect (again, assuming that's as it appears on screen), a doddle.
The second goal is to make the output media suitable for publication, allowing you to publish your results in the full glory that you originally intended. This includes embedding fonts, setting image compression levels (including lossless), anti-aliasing, cropping, setting the colourspace, alpha-blending and getting the right resolution.
Perhaps the best way to demonstrate what export_fig can do is with some examples.
### Examples
**Visual accuracy** - MATLAB's exporting functions, namely `saveas` and `print`, change many visual properties of a figure, such as size, axes limits and ticks, and background colour, in unexpected and unintended ways. Export_fig aims to faithfully reproduce the figure as it appears on screen. For example:
```Matlab
plot(cos(linspace(0, 7, 1000)));
set(gcf, 'Position', [100 100 150 150]);
saveas(gcf, 'test.png');
export_fig test2.png
```
generates the following:
| Figure: | test.png: | test2.png: |
|:-------:|:---------:|:----------:|
|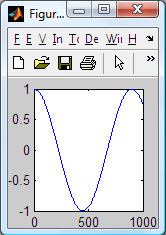|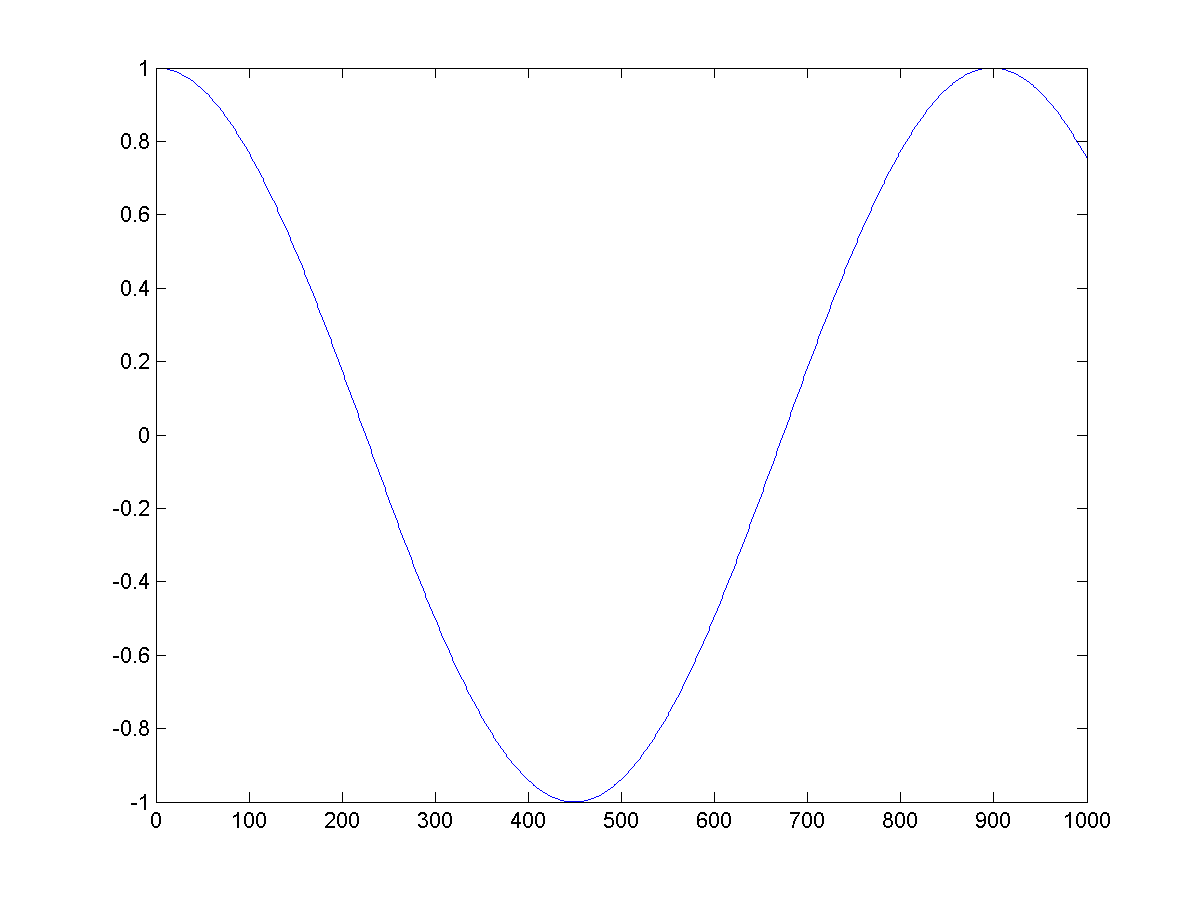|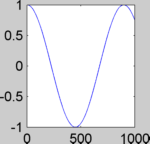|
Note that the size and background colour of test2.png (the output of export_fig) are the same as those of the on screen figure, in contrast to test.png. Of course, if you want the figure background to be white (or any other colour) in the exported file then you can set this prior to exporting using:
```Matlab
set(gcf, 'Color', 'w');
```
Notice also that export_fig crops and anti-aliases (smooths, for bitmaps only) the output by default. However, these options can be disabled; see the Tips section below for details.
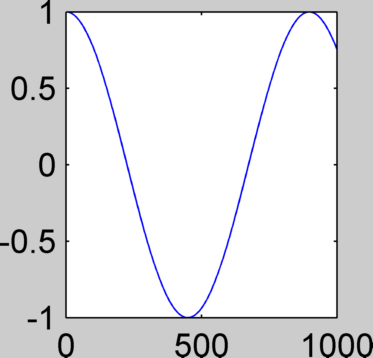
**Resolution** - by default, export_fig exports bitmaps at screen resolution. However, you may wish to save them at a different resolution. You can do this using either of two options: `-m<val>`, where <val> is a positive real number, magnifies the figure by the factor <val> for export, e.g. `-m2` produces an image double the size (in pixels) of the on screen figure; `-r<val>`, again where <val> is a positive real number, specifies the output bitmap to have <val> pixels per inch, the dimensions of the figure (in inches) being those of the on screen figure. For example, using:
```Matlab
export_fig test.png -m2.5
```
on the figure from the example above generates:
Sometimes you might have a figure with an image in. For example:
```Matlab
imshow(imread('cameraman.tif'))
hold on
plot(0:255, sin(linspace(0, 10, 256))*127+128);
set(gcf, 'Position', [100 100 150 150]);
```
generates this figure:
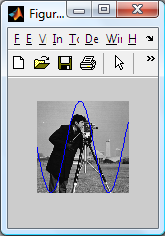
Here the image is displayed in the figure at resolution lower than its native resolution. However, you might want to export the figure at a resolution such that the image is output at its native (i.e. original) size (in pixels). Ordinarily this would require some non-trivial computation to work out what that resolution should be, but export_fig has an option to do this for you. Using:
```Matlab
export_fig test.png -native
```
produces:
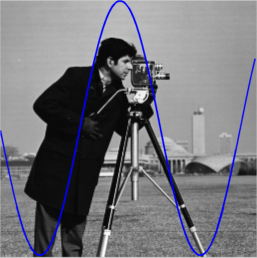
with the image being the size (in pixels) of the original image. Note that if you want an image to be a particular size, in pixels, in the output (other than its original size) then you can resize it to this size and use the `-native` option to achieve this.
All resolution options (`-m<val>`, `-q<val>` and `-native`) correctly set the resolution information in PNG and TIFF files, as if the image were the dimensions of the on screen figure.
**Shrinking dots & dashes** - when exporting figures with dashed or dotted lines using either the ZBuffer or OpenGL (default for bitmaps) renderers, the dots and dashes can appear much shorter, even non-existent, in the output file, especially if the lines are thick and/or the resolution is high. For example:
```Matlab
plot(sin(linspace(0, 10, 1000)), 'b:', 'LineWidth', 4);
hold on
plot(cos(linspace(0, 7, 1000)), 'r--', 'LineWidth', 3);
grid on
export_fig test.png
```
generates:
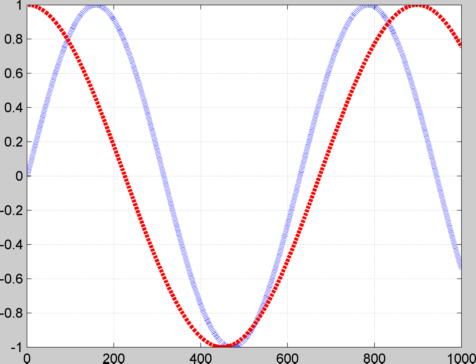
This problem can be overcome by using the painters renderer. For example:
```Matlab
export_fig test.png -painters
```
used on the same figure generates:
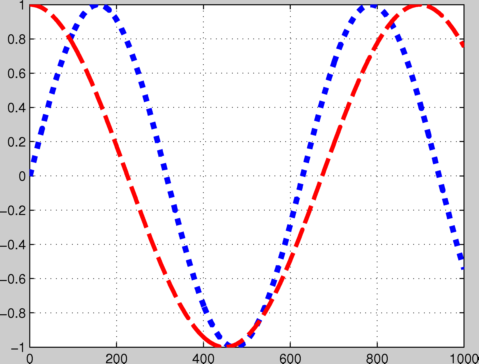
Note that not only are the plot lines correct, but the grid lines are too.
**Transparency** - sometimes you might want a figure and axes' backgrounds to be transparent, so that you can see through them to a document (for example a presentation slide, with coloured or textured background) that the exported figure is placed in. To achieve this, first (optionally) set the axes' colour to 'none' prior to exporting, using:
```Matlab
set(gca, 'Color', 'none'); % Sets axes background
```
then use export_fig's `-transparent` option when exporting:
```Matlab
export_fig test.png -transparent
```
This will make the background transparent in PDF, EPS and PNG outputs. You can additionally save fully alpha-blended semi-transparent patch objects to the PNG format. For example:
```Matlab
logo;
alpha(0.5);
```
generates a figure like this:
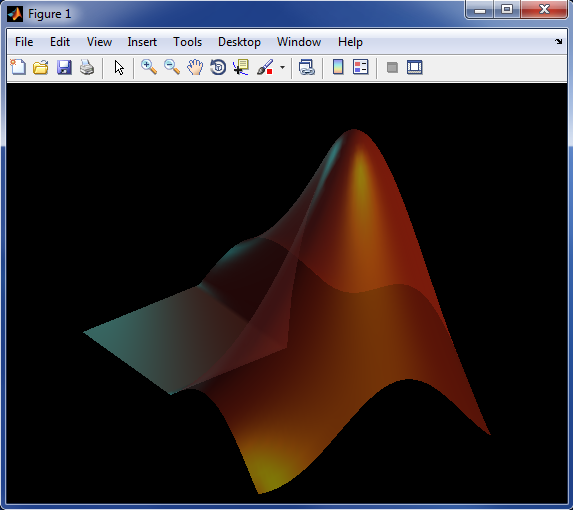
If you then export this to PNG using the `-transparent` option you can then put the resulting image into, for example, a presentation slide with fancy, textured background, like so:
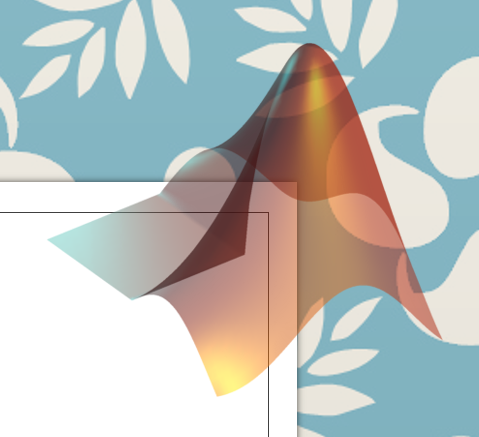
and the image blends seamlessly with the background.
**Image quality** - when publishing images of your results, you want them to look as good as possible. By default, when outputting to lossy file formats (PDF, EPS and JPEG), export_fig uses a high quality setting, i.e. low compression, for images, so little information is lost. This is in contrast to MATLAB's print and saveas functions, whose default quality settings are poor. For example:
```Matlab
A = im2double(imread('peppers.png'));
B = randn(ceil(size(A, 1)/6), ceil(size(A, 2)/6), 3) * 0.1;
B = cat(3, kron(B(:,:,1), ones(6)), kron(B(:,:,2), ones(6)), kron(B(:,:,3), ones(6)));
B = A + B(1:size(A, 1),1:size(A, 2),:);
imshow(B);
print -dpdf test.pdf
```
generates a PDF file, a sub-window of which looks (when zoomed in) like this:

while the command
```Matlab
export_fig test.pdf
```
on the same figure produces this:

While much better, the image still contains some compression artifacts (see the low level noise around the edge of the pepper). You may prefer to export with no artifacts at all, i.e. lossless compression. Alternatively, you might need a smaller file, and be willing to accept more compression. Either way, export_fig has an option that can suit your needs: `-q<val>`, where <val> is a number from 0-100, will set the level of lossy image compression (again in PDF, EPS and JPEG outputs only; other formats are lossless), from high compression (0) to low compression/high quality (100). If you want lossless compression in any of those formats then specify a <val> greater than 100. For examp
阿齐Archie
- 粉丝: 4w+
- 资源: 2477
最新资源
- COMSOL模拟下的二氧化碳驱替瓦斯技术研究,利用COMSOL模拟分析二氧化碳驱替瓦斯的技术研究,comsol注二氧化碳驱替瓦斯 ,COMSOL; 注二氧化碳; 驱替; 瓦斯,COMSOL模拟:二氧化
- Simulink仿真:单电感双向电池均衡电路的设计与实现-基于Buck-Boost变换器与开关矩阵的高效均衡策略(涉及CSCD,EI,CSTPCD技术),基于MATLAB Simulink的单电感双
- 基于模糊控制的扰动观察法:光伏MPPT改进算法的仿真研究与分析,基于模糊控制的改进型扰动观察法在光伏MPPT中的仿真研究,Simulink仿真:基于扰动观察法的光伏MPPT改进算法 参考文献:基于扰动
- Axhub 谷歌(Chrome)浏览器插件
- 大华摄像头IE浏览器插件webplugin.exe(Web视频播放控件-v2.0.1.7)
- 深度探究:一阶与二阶自抗扰模型的构建及其实现在自己搭建的Simulink仿真模型中的封装与应用,一阶二阶自抗扰模型解析及其在自主搭建Simulink仿真模型中的应用,已封装,简捷调参,一阶 二阶自抗扰
- 办公自动化中Word与WPS接入DeepSeek R1
- 小费数据集,包含餐厅顾客的小费数据,包括账单总金额、给出的小费金额、顾客的人口统计信息以及用餐详情
- 【网页制作期末/课程设计】家乡网站
- 房屋租售系统spring+jsp+mysql
- 帕尔默企鹅数据集.zip
- AutoCAD ObjectArx2016
- AVPro Video-Editions
- 三相并网虚拟同步机VSG模型的有功功率突变过程仿真及系统稳定性研究,三相并网虚拟同步机VSG模型仿真:有功功率突变下的系统稳定性分析与原理学习,同步机(VSG)三相并网仿真模型 有功功率从20k突变到
- 基于JavaWeb(JSP)+MySQL图书销售管理系统(网上书店)源码
- Delphi 12 控件之sfk189.7z
资源上传下载、课程学习等过程中有任何疑问或建议,欢迎提出宝贵意见哦~我们会及时处理!
点击此处反馈


