Polynomial Fit Explorer
Introduces interactive plot menu polynomial fitting and programmatic polynomial fits that are used to create a
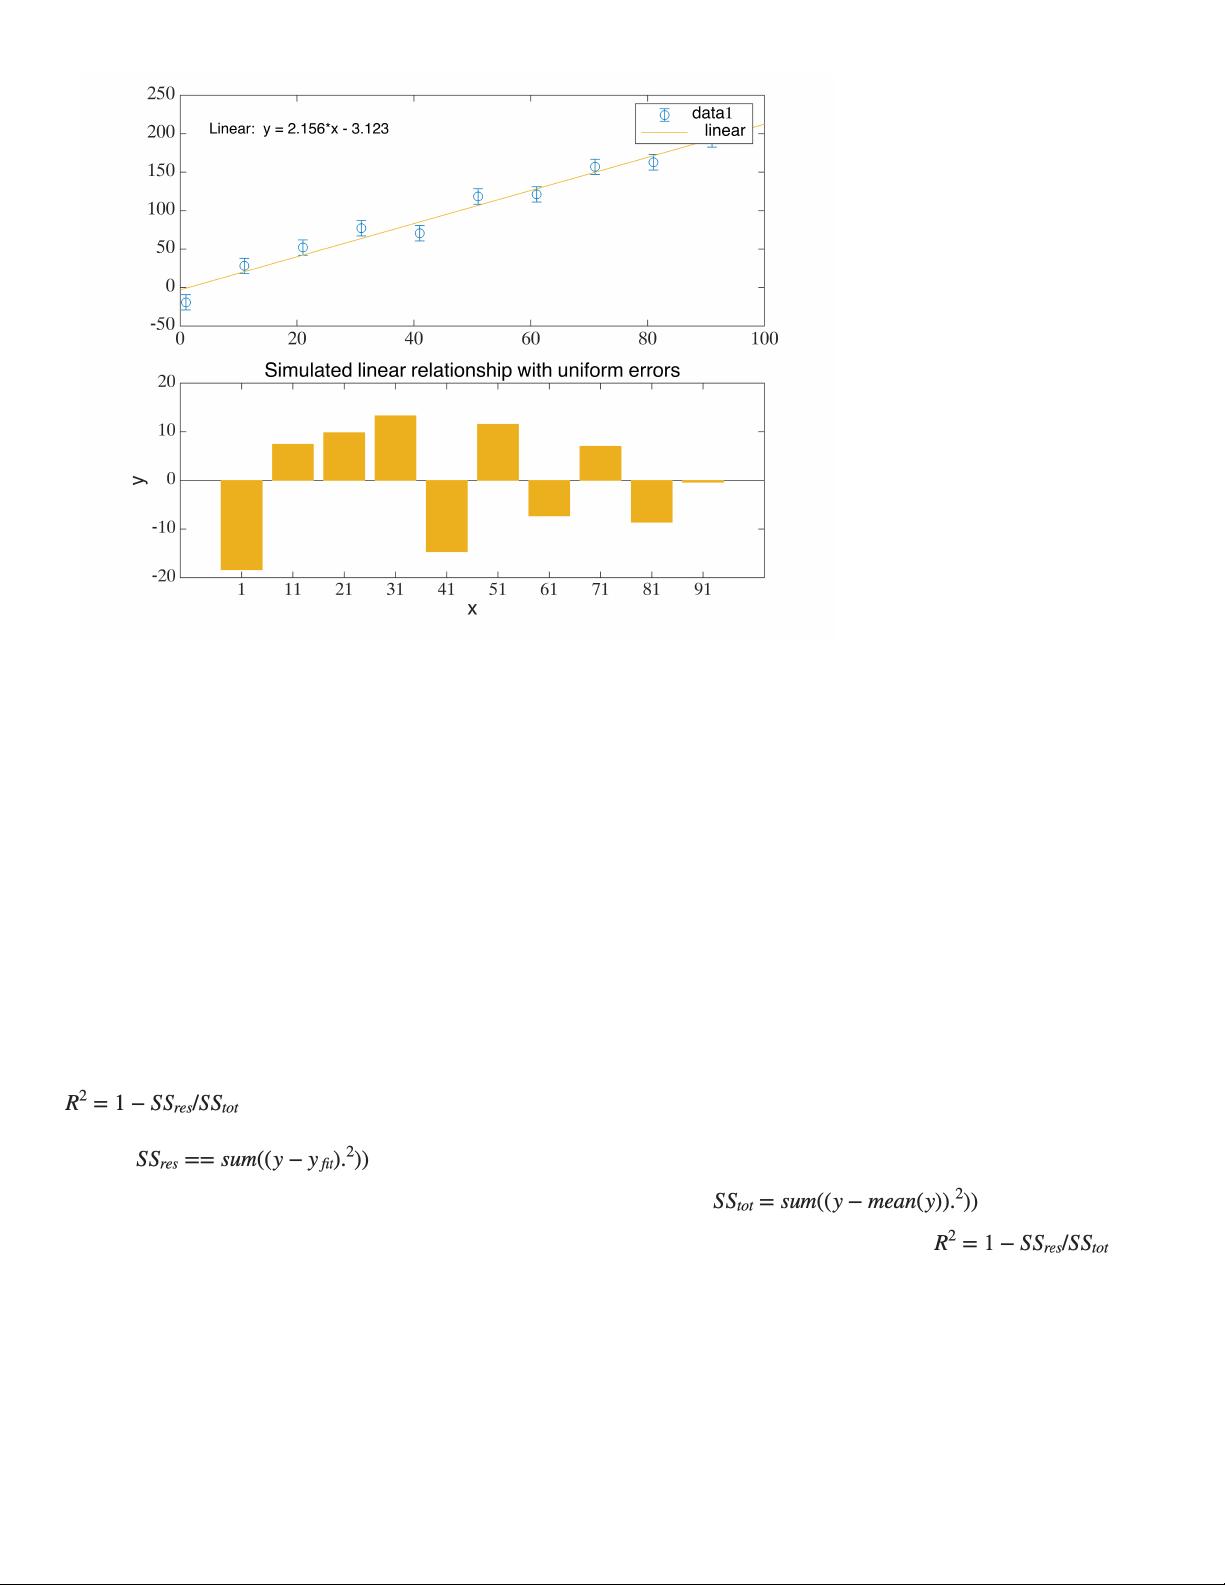
plot annotated with fit parameters and uncertainties.
Author: D. Carlsmith
Introduction
This Live Script illustrates how to interactively fit data to a polynomial using tools available in a plot menu, and
then how to programmatically fit the data in order to extract, display, and interpret fit parameter values and
uncertainties.
The script is designed for students just beginning to use MATLAB for data analysis. It may be used with real
data substituted for the simulated data. 'Try this' suggestions and coding 'Challenges' are included for further
exploration.
Table of Contents
Introduction...............................................................................................................................................................1
Clear variables and plots.......................................................................................................................................... 1
Generate simulated data.......................................................................................................................................... 1
Interactive polynomial fitting..................................................................................................................................... 3
Try this: Open the plot and fit the data..................................................................................................................3
Export code to reproduce a plot and fit.................................................................................................................4
Try this: Examine and fit a plot interactively and generate code.......................................................................... 4
Use generated code to remake a plot and fit........................................................................................................4
Programmatic polynomial fitting with polyfit..............................................................................................................5
Fit simulated data................................................................................................................................................. 5
Evaluate the polynomial fit at the points in x ........................................................................................................6
Try this: Extrapolate or interpolate to new values of the independent variable.................................................... 6
Plot fit results....................................................................................................................................................... 6
Compute parameter covariance matrix and standard errors............................................................................... 7
Annotate the plot with fit results ...........................................................................................................................7
Calculate a chi-squared for the fit and add the result to the plot.......................................................................... 8
Interpretation.............................................................................................................................................................8
Try this: Rerun this simulation to see the fit results change................................................................................. 9
Challenge: Modify this code to generate data nonlinear in x while fitting to a linear function...............................9
Wrap up.................................................................................................................................................................... 9
Clear variables and plots
clear all;% clear variables
delete(findall(0,'Type','figure'))% close all open figure windows
Generate simulated data
Generate vectors of values for an independent variable x, a dependent variable y which is a polynomial function
of x, and estimated errors on y. The script user can replace these with real data.
1