没有合适的资源?快使用搜索试试~ 我知道了~
资源推荐
资源详情
资源评论
Stack
Stack
Stack
Stack Backtracing
Backtracing
Backtracing
Backtracing Inside
Inside
Inside
Inside Your
Your
Your
Your Program
Program
Program
Program
How to use a backtrace to follow the execution path and find out what went wrong and
where.
如何使用 backtrace 函数追踪函数调用链,并且定位出错的地方以及出错原因。
If you usually work with non-trivial C sources, you may have wondered which
execution path (that is, which sequence of function calls) brought you to a certain
point in your program. Also, it would be even more useful if you could have that
piece of information whenever your beautiful, bug-free program suddenly crashes,
and you have no debugger at hand. What is needed is a stack backtrace and,
thanks to a little known feature of the GNU C library, obtaining it is a fairly easy
task.
如果你经常面对一些大型的 C 程序的话,那么你可能想知道函数间的调用关系(函
数调用链),从而帮助你定位程序特定的位置。 当你的程序突然发生错误的时候
,
而你的环境又不允许使用调试器的话,你却能利用程序本身得到一些错误的信息的
话 , 那就再好不过了 。 幸好 glibc 提供了 backtrace 函数 , 使得这一切变得很容易 。
Stack
Stack
Stack
Stack Frames
Frames
Frames
Frames and
and
and
and Backtraces
Backtraces
Backtraces
Backtraces
栈框架和栈回溯
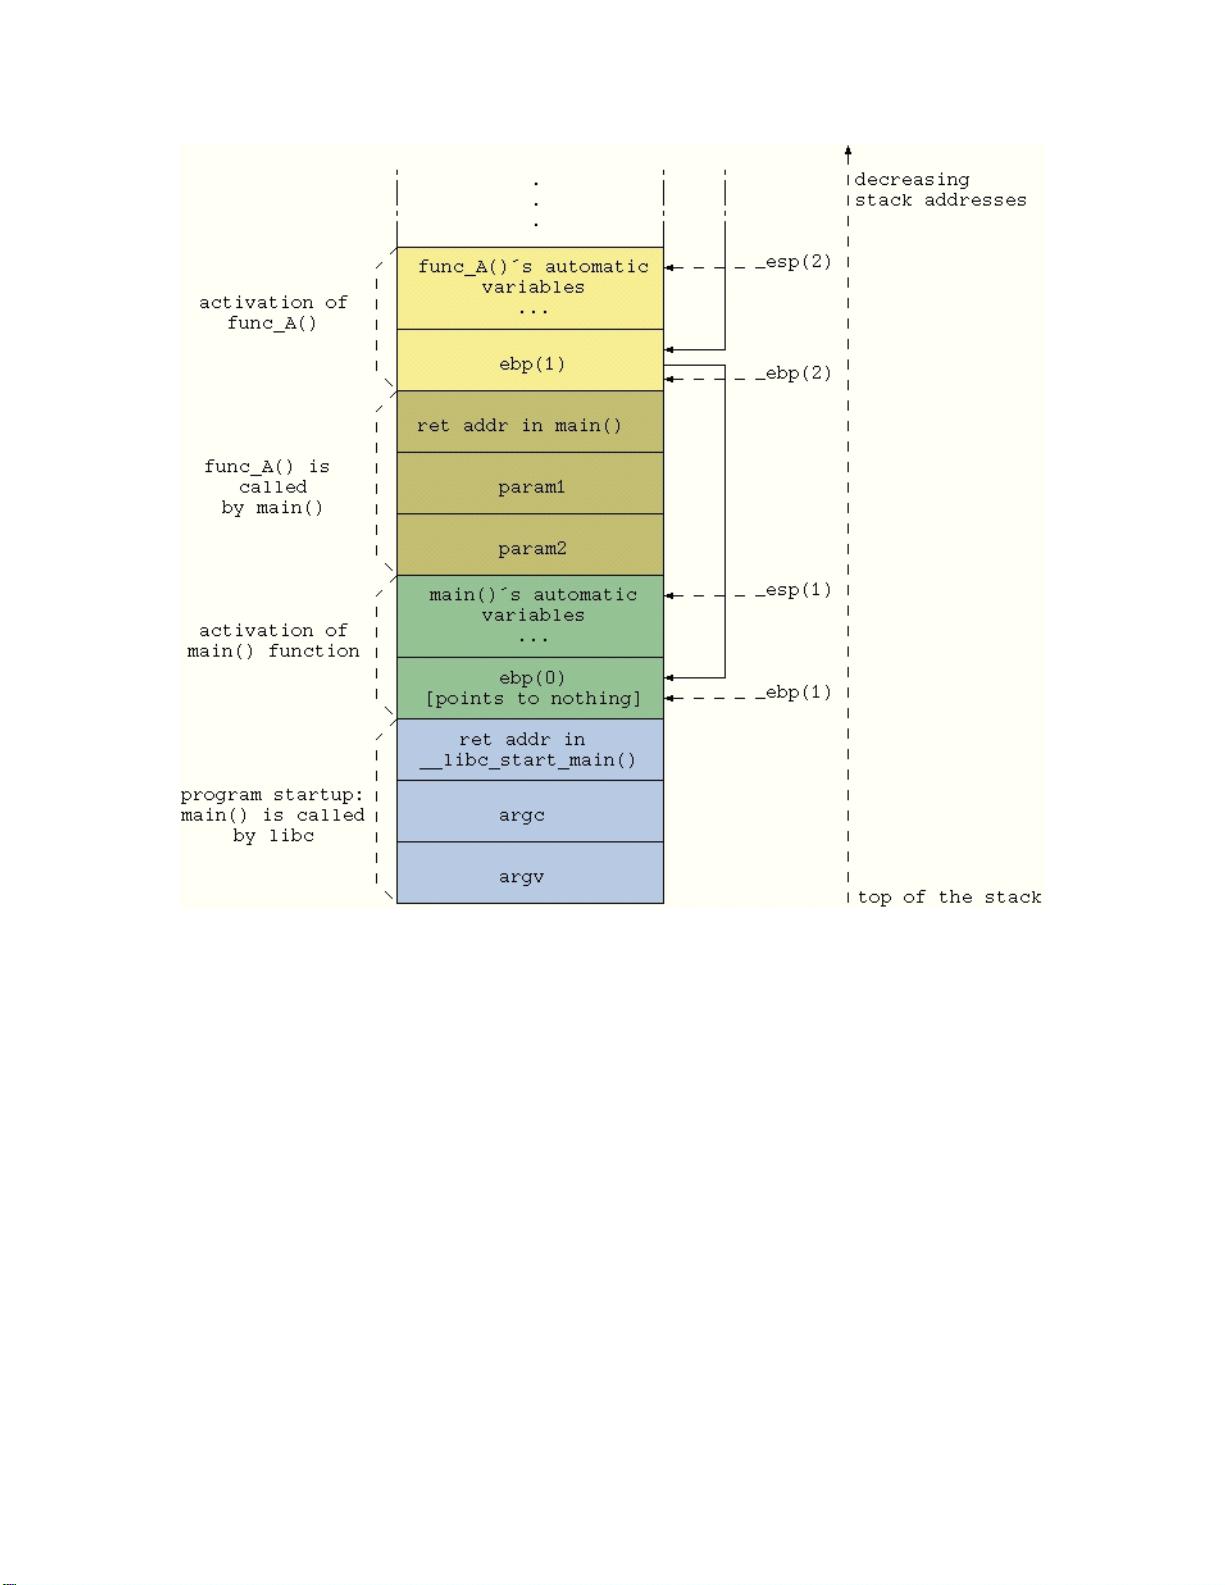
Before diving into the article, let's briefly go over how function calls and
parameters pass work in C. In order to prepare for the function call, parameters
are pushed on the stack in reverse order. Afterwards, the caller's return address
also is pushed on the stack and the function is called. Finally, the called function's
entry code creates some more space on the stack for storage of automatic
variables. This layout commonly is called a stack frame for that particular instance
of the function call. When more function calls are nested, the whole procedure is
repeated, causing the stack to keep growing downwards and building a chain of
stack frames (see Figure 1). Thus, at any given point in a program it theoretically
is possible to backtrace the sequence of stack frames to the originating calling
point, up to the main() function (to be exact, up to the libc function, which calls
main() when the process starts up).
开始本文之前 , 让我们先简略的了解一下 C 语言的函数调用和参数传递 。 在函数调
用之前,参数按照从右向左的顺序入栈。接着,调用函数的返回地址也入栈,再接
着才调用我们想调用的函数。最后,在被调用函数的栈内分配一些空间来存储变量
(自动变量)。这种结构一般被称为栈框架。当有多个函数调用或者发生嵌套调用
时,利用系统的栈空间来建立一个栈框架链(见图 1 )。因此,理论上在程序的任
何一个位置 , 我们都可以回溯整个栈框架链 , 从而到达最初的
main
函数 ( 实际上
,
main 函数也是被 libc 库调用的)。
图
1
:栈框架
Stack
Stack
Stack
Stack Backtracing
Backtracing
Backtracing
Backtracing from
from
from
from within
within
within
within GDB
GDB
GDB
GDB
利用 GDB 来栈回溯
Getting the stack backtrace with GDB (or an equivalent graphical front end)
for a program that crashed while running is straightforward: you simply issue the
bt command, which returns the list of functions called up to the point of the crash.
As this is a standard practice, we do not provide any more details here; have a
look at the GDB info page if you need specifics ( info
info
info
info gdb
gdb
gdb
gdb stack
stack
stack
stack gets you there).
当我们的程序发生错误的使用 , 利用
GDB
回溯栈是最直截了当的办法 : 使用
bt
命
令得到函数调用链 ( 从 libc 库到发生错误的地方 ) 。 因为这是一般的做法 , 在这里
我就不提供详细的操作了(具体查看 gdb 手册)。
Stack
Stack
Stack
Stack Backtracing
Backtracing
Backtracing
Backtracing Using
Using
Using
Using libc
libc
libc
libc
利用 libc 库来栈回溯
If for some reason you're not running inside a debugger, two options are
available for tracing what the program is doing. The first method is to disseminate
it with print and log messages in order to pinpoint the execution path. In a complex
program, this option can become cumbersome and tedious even if, with the help
of some GCC-specific macros, it can be simplified a bit. Consider, for example, a
debug macro such as .
当由于某些原因,你不能使用调试器,此时我们提供两个选择来实现追踪函数的行
为。第一,在程序中插入打印信息的语句来追踪程序的执行顺序。当然,在复杂的
程序中,这种办法会变得很笨重(尽管可以利用
GCC
中特定的宏)。考虑下面的
一个宏:
#define TRACE_MSG fprintf ( stderr , \
"( %s ) [ %s : %d ] here I am \n " , \
__FUNCTION__, __FILE__, __LINE__ )
You can propagate this macro quickly throughout your program by cutting and
pasting it. When you do not need it anymore, switch it off simply by defining it to
no-op.
你可以在程序中大量的插入这个宏。当不再需要时,可以关闭这个宏。
A nicer way to get a stack backtrace, however, is to use some of the specific
support functions provided by glibc. The key one is backtrace(), which navigates
the stack frames from the calling point to the beginning of the program and
provides an array of return addresses. You then can map each address to the
body of a particular function in your code by having a look at the object file with
the nm command. Or, you can do it a simpler way--use backtrace_symbols(). This
function transforms a list of return addresses, as returned by backtrace(), into a
list of strings, each containing the function name offset within the function and the
return address. The list of strings is allocated from your heap space (as if you
called malloc()), so you should free() it as soon as you are done with it.
使用 glibc 提供的函数来栈回溯是比较好的办法 。 其中最重要的是 backtrace 这个函
数 。 backtrace 函数从运行处遍历整个栈框架链 , 获得每个函数栈框架的返回地址
,
然后将这些地址存入一个数组中。接着使用 backtrace_symbols 函数,它 将
backtrace
函数获取的信息转化为一个字符串数组(包括函数名、函数的偏移量和
实际的返回地址 ) 。 这个字符串数组是通过 malloc 函数申请的 , 所以你应该使用 fre e
函数来释放它。
If you prefer to avoid dynamic memory allocation during the
backtrace--reasonable, as the backtrace is likely to happen under faulty
conditions--you can resort to backtrace_symbols_fd(). This prints the strings
directly to the given file descriptor and does not allocate new memory for strings
storage. It is a safer choice in those cases where memory heap potentially is
corrupted.
如果栈回溯时,你想避免动态分配内存 —— 因为栈回溯是在系统不稳定的环境下
进行的 。 那么你可以使用 backtrace_symbols_fd 函数 。 backtrace_symbols_fd 函
数直接将信息打印到给定的文件描述符指定的文件中,这个过程不需要动态分配内
剩余14页未读,继续阅读
资源评论
astrotycoon
- 粉丝: 374
- 资源: 32
上传资源 快速赚钱
- 我的内容管理 展开
- 我的资源 快来上传第一个资源
- 我的收益 登录查看自己的收益
- 我的积分 登录查看自己的积分
- 我的C币 登录后查看C币余额
- 我的收藏
- 我的下载
- 下载帮助
安全验证
文档复制为VIP权益,开通VIP直接复制
信息提交成功