没有合适的资源?快使用搜索试试~ 我知道了~
2017年美国大学生数学建模竞赛O奖论文B-69427.pdf
1.该资源内容由用户上传,如若侵权请联系客服进行举报
2.虚拟产品一经售出概不退款(资源遇到问题,请及时私信上传者)
版权申诉
0 下载量 188 浏览量
2024-03-17
21:47:04
上传
评论
收藏 1MB PDF 举报
温馨提示
![preview](https://dl-preview.csdnimg.cn/88981977/0001-8334bc2c594c30a3f49d0a4c778165bb_thumbnail.jpeg)
![preview-icon](https://csdnimg.cn/release/downloadcmsfe/public/img/scale.ab9e0183.png)
试读
28页
美国大学生数学竞赛获奖论文,历届,单项文件,内容丰富,大学生数学,数学竞赛,参考资料,极具参考价值
资源推荐
资源详情
资源评论
![zip](https://img-home.csdnimg.cn/images/20210720083736.png)
![pdf](https://img-home.csdnimg.cn/images/20210720083512.png)
![doc](https://img-home.csdnimg.cn/images/20210720083327.png)
![pdf](https://img-home.csdnimg.cn/images/20210720083512.png)
![](https://csdnimg.cn/release/download_crawler_static/88981977/bg1.jpg)
For office use only
T1
________________
T2
________________
T3
________________
T4
________________
Team Control Number
69427
Problem Chosen
B
For office use only
F1
________________
F2
________________
F3
________________
F4
________________
2017
MCM/ICM
Summary Sheet
Optimal Design of Toll Plaza Based on Minimum Risk Maximum Flow
The design of highway toll plaza is crucial to the traffic flow and tollbooths operation efficiency.
We study the optimal design program of toll plaza from three aspects:accident rate, traffic flow
and construction cost. At the same time, we give the design figures and merging pattern of toll plaza.
The first stage, we determine the number of tollbooths by assuming that the traffic condition is
normal. The number of toll lanes is decided by traffic capacity, traffic flow and service level. We
establish a function model of tollbooths through the above three indexes. When the number of lanes is
3, we know that the number of single-way toll lanes should be 7 by calculating the traffic data from
the highway tollbooths of 417 highway in Florida. We find in the sensitivity analysis that the traffic
flow is positively related to the number of toll lanes.
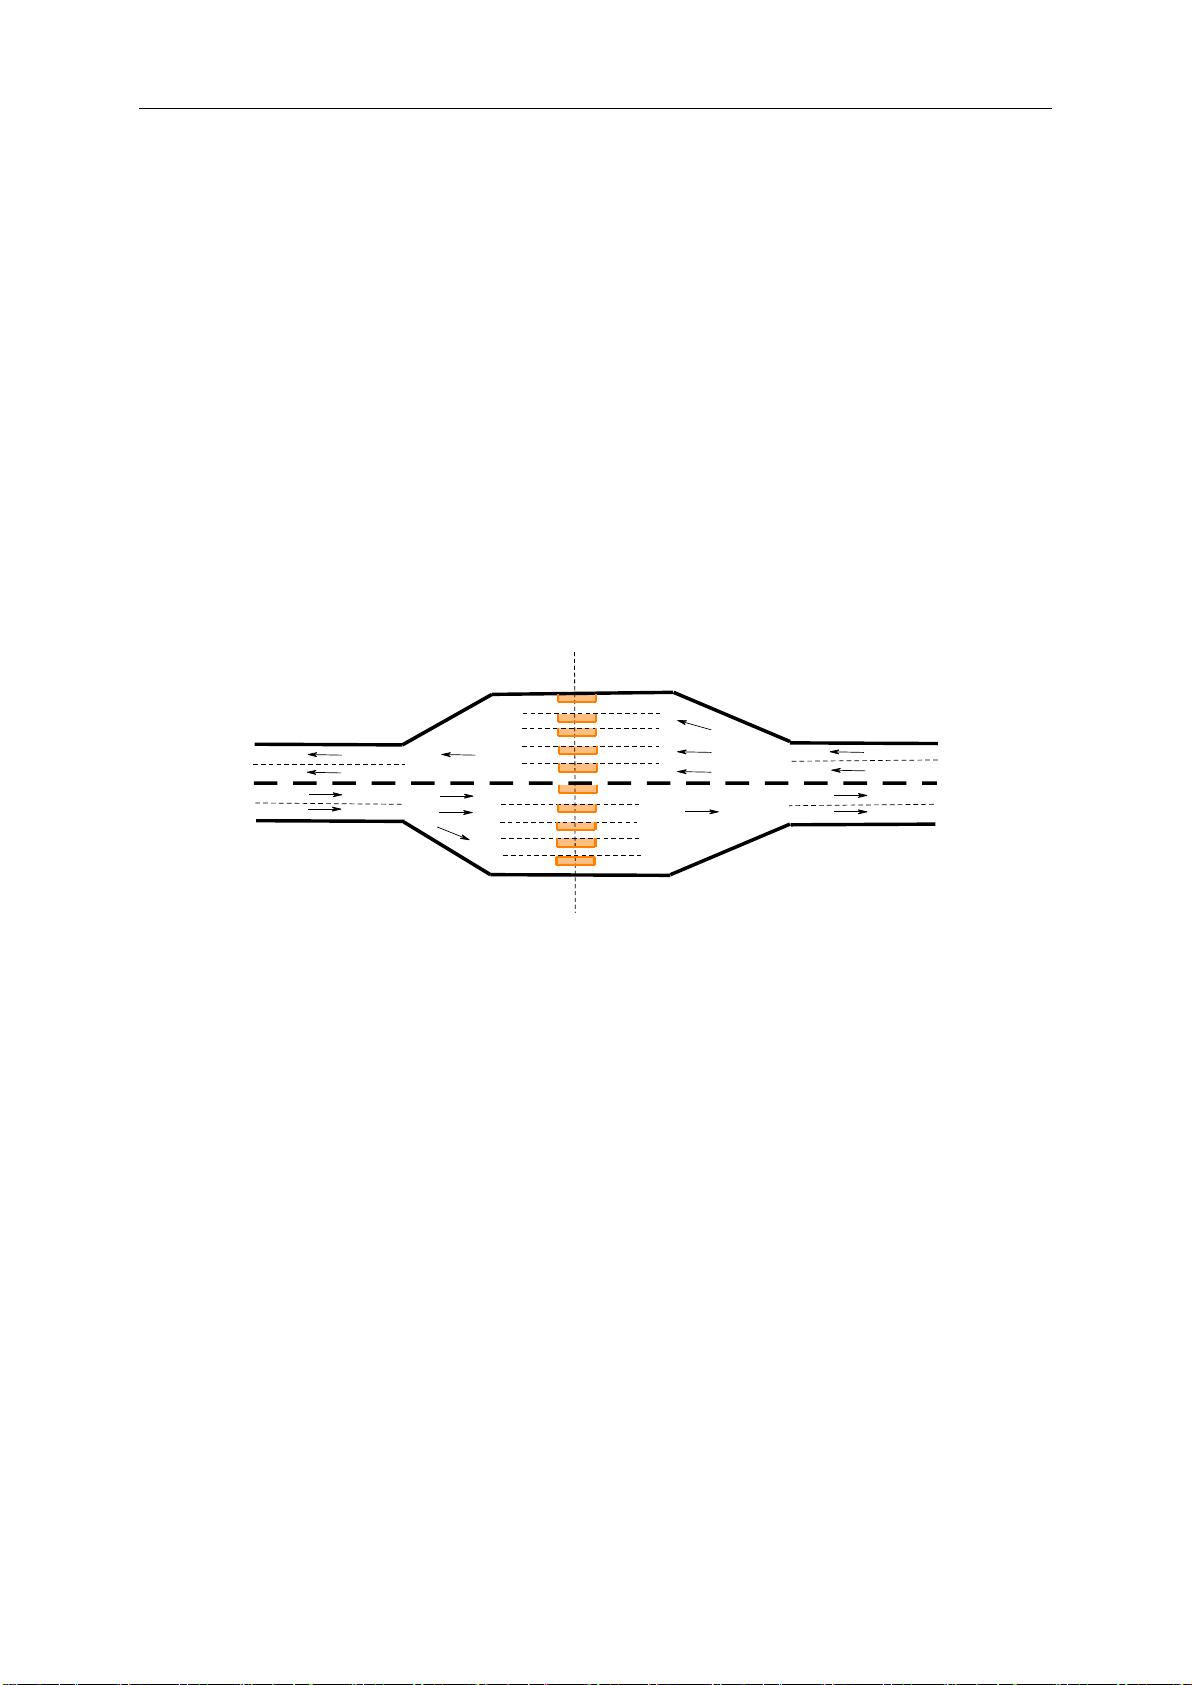
The second stage, the optimal model of the merging pattern based on minimum risk and
maximum throughput is established. This model is on account of the analysis of the performance of
the existing toll plaza to optimize its design program, and we regard the deceleration shunt and
acceleration merging of the whole toll plaza as a directed and weighted network flow. Similarly, by
using the data of the highway tollbooths of 417 road in Florida, we obtain the program of merging
pattern (Shown in Fig.5). The maximum traffic flow of this program can reach 1375 vehicles per hour,
the accident rate can be reduced to 0.9%.
The third stage, taking into account the vehicle's variable motion in the toll plaza, we employ the
driving distance between the front and rear vehicles and the braking distance of the rear vehicle to
determine the size of the toll plaza, and establish a optimization model to minimize the construction
cost. Likewise, using the data from the highway tollbooths of 417 road in Florida, we obtain the
smallest toll plaza (Shown in Fig.6) whose area about 4650.1875 square meters.
Remarkably, we test the model in detail. The traffic flow and the accident rate are lower in light
traffic flow. When the traffic flow is larger, the accident rate is increased by 0.05% compared with the
slight traffic flow, that is, the size of traffic flow on the toll plaza design is not significant. After
examining the impact of adding autonomous vehicles into mixed traffic, we add 500 autonomous
vehicles into the traffic flow based on unit traffic flow on Highway 95 in New Jersey. And the accident
rate was reduced by 0.83%. In view of the proportion of the three tollbooths, the greater the proportion
of automatic tollbooths, the smaller the entire toll area, the smaller the number of tollbooths, the
stronger the capacity of the tollbooths.
Finally, we apply the model to study the optimal design of the highway toll plaza in New Jersey.
We select the New Jersey Highway No.95 as the research object, and we get its shape about toll plaza
and the figure of merge pattern (See Fig.12). The number of toll lanes is 10, and the proportions of the
three tollbooths is 5:3:2, the area of the toll plaza is 9614.56
2
m
. Last but not least, writing a letter to
the New Jersey Turnpike Authority about the design scheme.
![](https://csdnimg.cn/release/download_crawler_static/88981977/bg2.jpg)
Contents
1 Introduction ............................................................................................................................................. 1
1.1 Background ....................................................................................................................................... 1
1.2 Previous Research ............................................................................................................................. 1
1.3 Our Work ........................................................................................................................................... 2
2 Analysis of Overall and Key Points ........................................................................................................ 2
2.1 Overall Analysis ................................................................................................................................ 2
2.2 Key Points Analysis .......................................................................................................................... 3
2.2.1 Analysis of Tollbooth Number ............................................................................................... 3
2.2.2 Performance Analysis of Toll Plaza ........................................................................................ 3
2.2.3 Cost Analysis of Toll Plaza Design ........................................................................................ 3
3 Assumptions and Justification ................................................................................................................. 3
4 Symbols and Definitions ......................................................................................................................... 4
5 The Model ............................................................................................................................................... 4
5.1 Model I: The Determination of the Toll Lane Number B .................................................................. 5
5.1.1 Modeling Ideas ...................................................................................................................... 5
5.1.2 Supplementary Assumptions and Justification ...................................................................... 5
5.1.3 The Calculation of the Toll Lane Number B ......................................................................... 5
5.1.4 Model Calculation and Result Analysis ................................................................................ 8
5.1.5 Sensitivity Analysis——Parameter Sensitivity of DHV ....................................................... 8
5.2 Model II: Optimal Merging Pattern Design Model Based on Minimum Risk and Maximum Flow . 9
5.2.1 Modeling Ideas ...................................................................................................................... 9
5.2.2 Supplementary Assumptions and Justification ...................................................................... 9
5.2.3 Minimum Risk and Maximum Flow Model .......................................................................... 9
5.2.4 Model Calculation and Result Analysis .............................................................................. 11
5.3 Model Ⅲ: An Optimization Model for the Minimum Cost of Toll Plaza ........................................ 13
5.3.1 Modeling Ideas .................................................................................................................... 13
5.3.2 Supplementary Assumptions and Justification .................................................................... 13
5.3.3 The Design of the Minimum Cost Toll Plaza Based on the Optimization Model ............... 13
5.3.4 Model Calculation and Result Analysis .............................................................................. 14
6 Testing the Model .................................................................................................................................. 15
6.1 Influence of Traffic Flow on Model ........................................................................................ 15
6.2 The Influence of Traffic Combination of Autonomous Vehicles on the Model ....................... 16
6.3 The Influence of the Proportion of Three Toll Stations on the Model ..................................... 16
7 Case Study on New Jersey 's Freeway Toll Plaza.................................................................................. 17
7.1 Data Collection ................................................................................................................................ 17
7.2 The Structural Analysis of the Parameters ...................................................................................... 17
7.3 Model Application and Result Analysis .......................................................................................... 18
![](https://csdnimg.cn/release/download_crawler_static/88981977/bg3.jpg)
8 Conclusions ........................................................................................................................................... 19
9 Strengths and Weaknesses ..................................................................................................................... 20
9.1 Strengths .......................................................................................................................................... 20
9.2 Weaknesses ...................................................................................................................................... 20
10 Future Improvements ............................................................................................................................ 20
11 A letter to the New Jersey Highway Authority ...................................................................................... 20
References ..................................................................................................................................................... 22
Appendices .................................................................................................................................................... 23
![](https://csdnimg.cn/release/download_crawler_static/88981977/bg4.jpg)
Team # 69427 Page 1 of 26
1 Introduction
1.1 Background
The development of the automobile industry has stimulated the development of road, especially
highway. Therefore, the world's expressway network is becoming increasingly developed, they
connecting the large and medium-sized cities. The American expressway network is fairly developed,
which not only undertakes more than 21% of the traffic volume and reduces space-time distance, but
also improves the transport efficiency and promotes the further flow of goods and resources. This kind
of perfect highway has made a great contribution to the economic development of the United States,
and changed the American way of travel in life.[1]
Highway toll plaza is an important part of the highway, and it belongs to the category of traffic
construction.[2] In the rush hour, the service efficiency of the tollbooths is greatly reduced. When the
service level cannot meet the demand of traffic volume, the phenomenon of traffic congestion and long
queues will be formed in the toll plaza.[3] How to use a variety of technical means to create a smooth
and convenient barriers tolls environment is the primary task of highway toll plaza design.
Fan in
Fan out
Fan out
Fan in
Fig. 1 A plan graph of the toll plaza
1.2 Previous Research
So far, People have studied all aspects of highway toll plaza design. The previous research topics
of toll plaza are broadly classified into traffic capacity, safety and environmental impact.
The overwhelming majority of people have studied traffic capacity. Kazuhito and Takashi studied
the traffic and queues conditions in traffic flow on toll highways with multi-lane tolls.[4] In the study
of traffic capacity, Zarrillo used the SHAKER method to analyze the traffic capacity of five freeway
tollbooths in Florida. Literature [5] and [6] introduces the principle, advantages, disadvantages and
applicable situations of various construction modes of mainline toll plazas at home and abroad. In
terms of delay analysis, Ayein's Mesoscopic approach is closer to practical delay than the VISSIM
approach. [7]
Security analysis is an indispensable part in the design of highway toll plaza. Literature [8] the
research on applying traffic conflict technology to highway safety evaluation has been carried out.
Through the simulation software VB.NET and Hassan, simulated the stochastic nature of traffic arrival,
toll collection time and driver decision making, then the microscopic traffic simulation model is
established to design, assessment and operational analysis of the highway toll plaza. Literature [9] and
[10], a simple-minded single lane deterministic discrete traffic model is used to investigate the impact
of the presence of toll stations on average vehicle speed. Literature [11] studied the impact of toll plaza
on traffic flow by simulated highway traffic through the Nagel-Schreckenberg model.
![](https://csdnimg.cn/release/download_crawler_static/88981977/bg5.jpg)
Team # 69427 Page 2 of 26
The above studies have their own advantages, the overwhelming majority of them focus on the
impact of existing toll plazas. But these studies do not synthesize these effects to design a solution to
toll plaza traffic difficulties. Therefore, we focus on the design of the toll plaza.
With the support of technology and theory, we developed a mathematical model to determine the
shape, size and merging pattern of the area following the toll barrier. This model can make accident
prevention, throughput and cost most suitable for toll plaza.
1.3 Our Work
When vehicles fan in from
B
tollbooth egress lanes down to
L
lanes of traffic , the area
following the toll barrier has a significant impact on accident prevention, throughput and so on.
Specifically, the toll plaza's traffic flow, accident rate, and cost are strongly correlated with its shape,
size, and merging patterns. In order to determine the best design of the toll plaza, we have done the
following three aspects from the performance analysis of any specific toll plaza.
Determine the number of toll lanes: The number of toll lanes are determined by the traffic flow,
the traffic capacity of each toll lane and the level of service. The toll lane capacity is divided into
single-channel capacity and multi-channel capacity. In the case of multi-channel, we choose M /
G / K queuing model to describe the actual operating state of the toll plaza. The queuing model is
also used to describe the traffic flow, which can be used to divide the service level of toll plaza.
At a certain service level, we convert the traffic flow into traffic intensity, which is the matching
conditions of the number of toll lanes.
Design the optimal merging pattern of traffic flow: The merging pattern plays an important
role in the occurrence of traffic flow and traffic accidents. Because of the U-curve relationship
between the ratio of traffic flow to capacity and the accident rate, we establish the optimal traffic
flow merging pattern design model based on maximum throughput and minimum security risk.
Optimal cost calculation of toll plaza: Vehicles across the toll plaza is a process of slowing
down and then accelerating. We assume that the study is carried out in an ideal traffic state in
order to simplify the model. In the process of speed changing, the size of the toll plaza needs to
meet two conditions, namely, the safety distance between the front and rear cars and the actual
braking distance. Based on this condition, we build the optimization model to get the size of the
toll plaza that minimizes the cost.
Test models and analyze performance in different traffic environments: The increase of the
traffic flow makes the service pressure of the toll plaza increase, and we use variable-controlling
approach to analyze its impact on the program. At the same time, we consider the effect of
autonomous (self-driving) vehicles on the model. Autonomous vehicles have only one choice of
toll modes, so it will change the merging pattern of traffic flow. If the proportion of three toll
plaza identified, the design of the toll plaza will be affected by the proportion of the program.
2 Analysis of Overall and Key Points
2.1 Overall Analysis
As an important part of freeway, expressway sub-confluence area and toll plaza design require a
further research. The ultimate goal of toll plaza design is to avoid the traffic accident and the traffic
congestion. After through the toll plaza, vehicles can have the smooth and safe access to the toll lane
to accept the service, and have enough confluence space to drive back to the normal lane. This can
provide a safe, comfortable and efficient working environment for toll collection and toll plaza
management.
剩余27页未读,继续阅读
资源评论
![avatar-default](https://csdnimg.cn/release/downloadcmsfe/public/img/lazyLogo2.1882d7f4.png)
![avatar](https://profile-avatar.csdnimg.cn/fcd62adb0120465d9af280215b0ff722_snowtshan.jpg!1)
阿拉伯梳子
- 粉丝: 1677
- 资源: 5736
上传资源 快速赚钱
我的内容管理 展开
我的资源 快来上传第一个资源
我的收益
登录查看自己的收益我的积分 登录查看自己的积分
我的C币 登录后查看C币余额
我的收藏
我的下载
下载帮助
![voice](https://csdnimg.cn/release/downloadcmsfe/public/img/voice.245cc511.png)
![center-task](https://csdnimg.cn/release/downloadcmsfe/public/img/center-task.c2eda91a.png)
安全验证
文档复制为VIP权益,开通VIP直接复制
![dialog-icon](https://csdnimg.cn/release/downloadcmsfe/public/img/green-success.6a4acb44.png)