2017年美国大学生数学建模竞赛O奖论文A-55280.pdf
版权申诉
79 浏览量
2024-03-17
21:46:48
上传
评论
收藏 639KB PDF 举报


For office use only
T1
T2
T3
T4
Team Control Number
55280
Problem Chosen
A
For office use only
F1
F2
F3
F4
2017
MCM/ICM
Summary Sheet
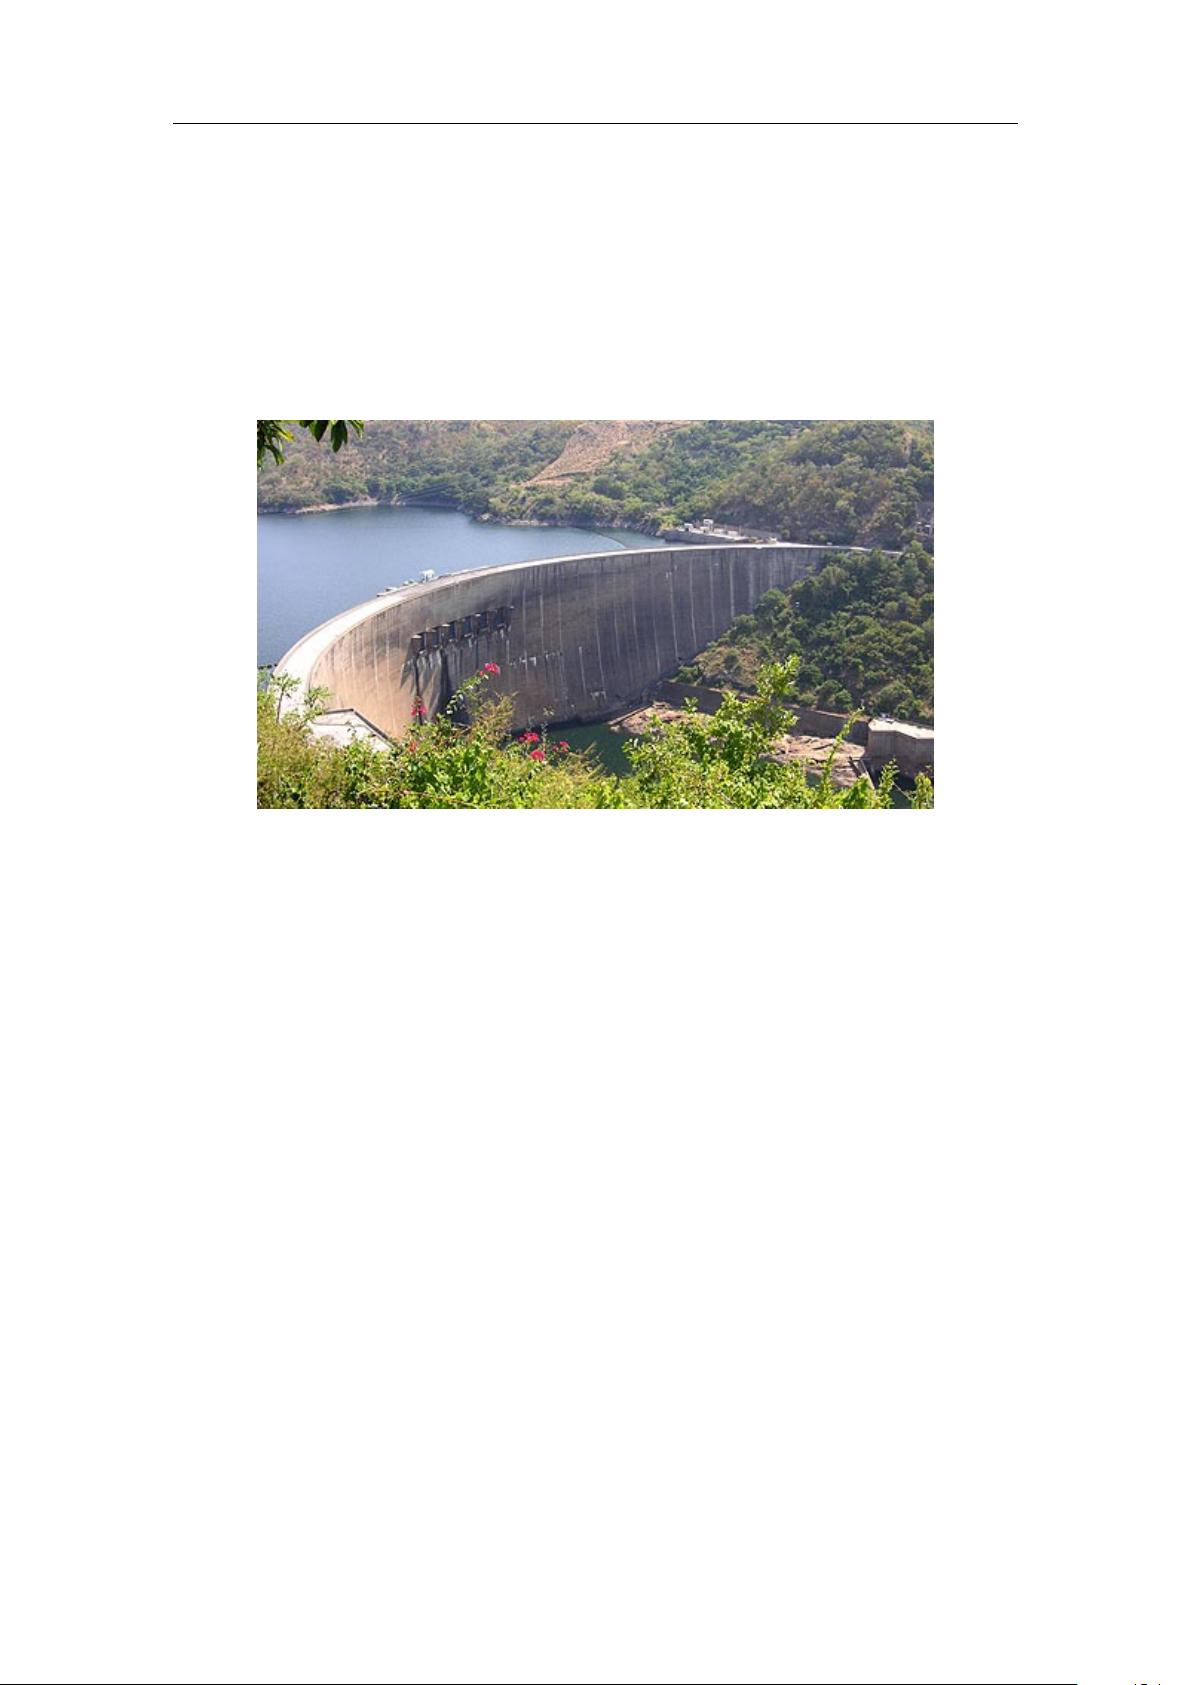
iMoDs: A Treatment to the Kariba Dam
Summary
Located on the Zambezi River, the Kariba Dam holds back the world’s largest reser-
voir. After so many years, despite efforts to slow its structural problems, the Kariba Dam
is in great danger.
To address this situation, our paper provides a detailed analysis of one option, re-
moving the Kariba Dam and replacing it with a series of ten to twenty smaller dams
along the river. We propose a model iMoDS(Integrated Model of Dams in Series) to fully
analyze different aspects, such as the number, placement, and height of the new dams. In
the meantime, we can set the total water management capabilities as same as the existing
dam, providing protection and water management options for Lake Kariba.
We first analyze the water flow using Manning formula which helps us to analyze a
single dam. After that, we simulate a dam in real life with 3ds MAX, show the simplified
dam model on it and derive its storage capacity and building cost.
iMoDS model consists of three main submodels, Risk Cost Model, Power Supply
Ability Model, and Series Safety Model. For explanation, there is a figure which connects
all related parts together.
Risk Cost Model aims at every single dam. It implements risk analysis, using accept-
able risk ratio, P
f
. Thus, it can make a good balance between cost and safety.
Power Supply Ability Model also aims at every single dam, the sum of which mea-
sures the benefits our dam system can produce.
Series Safety Model measures how safe the whole system is, based on an ideal distri-
bution of dams along a river.
Then we use AHP to analyze these three submodels and propose iMoDS.
To get enough data, we surveyed the literature and other sources. Using genetic
algorithm to determine the number and placement, we further solve each dam’s height.
Another section of our paper discusses strategies for addressing several situations,
including the balance between safety and costs, protection for Lake Kariba, guidances
for emergency water flow situations and extreme water flows.
In the end, we make sensitivity analysis and discuss strengths and weaknesses.
Keywords: dam series; water flow; risk analysis; integrated model; dam control strategy


剩余25页未读,继续阅读
资源评论


