myspectrogram.m
Kamil Wojcicki
November 25, 2010
Usage:
1. Start Matlab
2. Run demo by typing: test
myspectrogram
1

%
%
% @file myspectrogram.m
% @date 17/09/2007
% @author Kamil Wojcicki
% @affiliation Signal Processing Laboratory, Griffith University, Nathan QLD4111, Australia
% @brief Spectrogram function
%
%
% @inputs speech − time domain speech signal vector
% fs − sampling frequency (Hz), f.e. 8000
% T − vector of frame width, Tw, and frame shift, Ts, in milliseconds, i.e. [Tw, Ts]
% w − analysis window handle, f.e. @hamming
% nfft − fft analysis length, f.e. 1024
% Slim − vector of spectrogram limits (dB), i.e. [Smin Smax]
% alpha − fir pre−emphasis filter coefficients, f.e. [1 −0.97]
% cmap − color map ('default', 'gray', 'bone', 'copper', 'hot', 'jet')
% cbar − color bar (boolean)
% type − estimator or feature type ('lp', 'per')
%
% @output handle − plot handle
%
%
% @usage [handle] = myspectrogram(speech, fs, T, w, nfft, Slim, alpha, cmap, cbar, type);
%
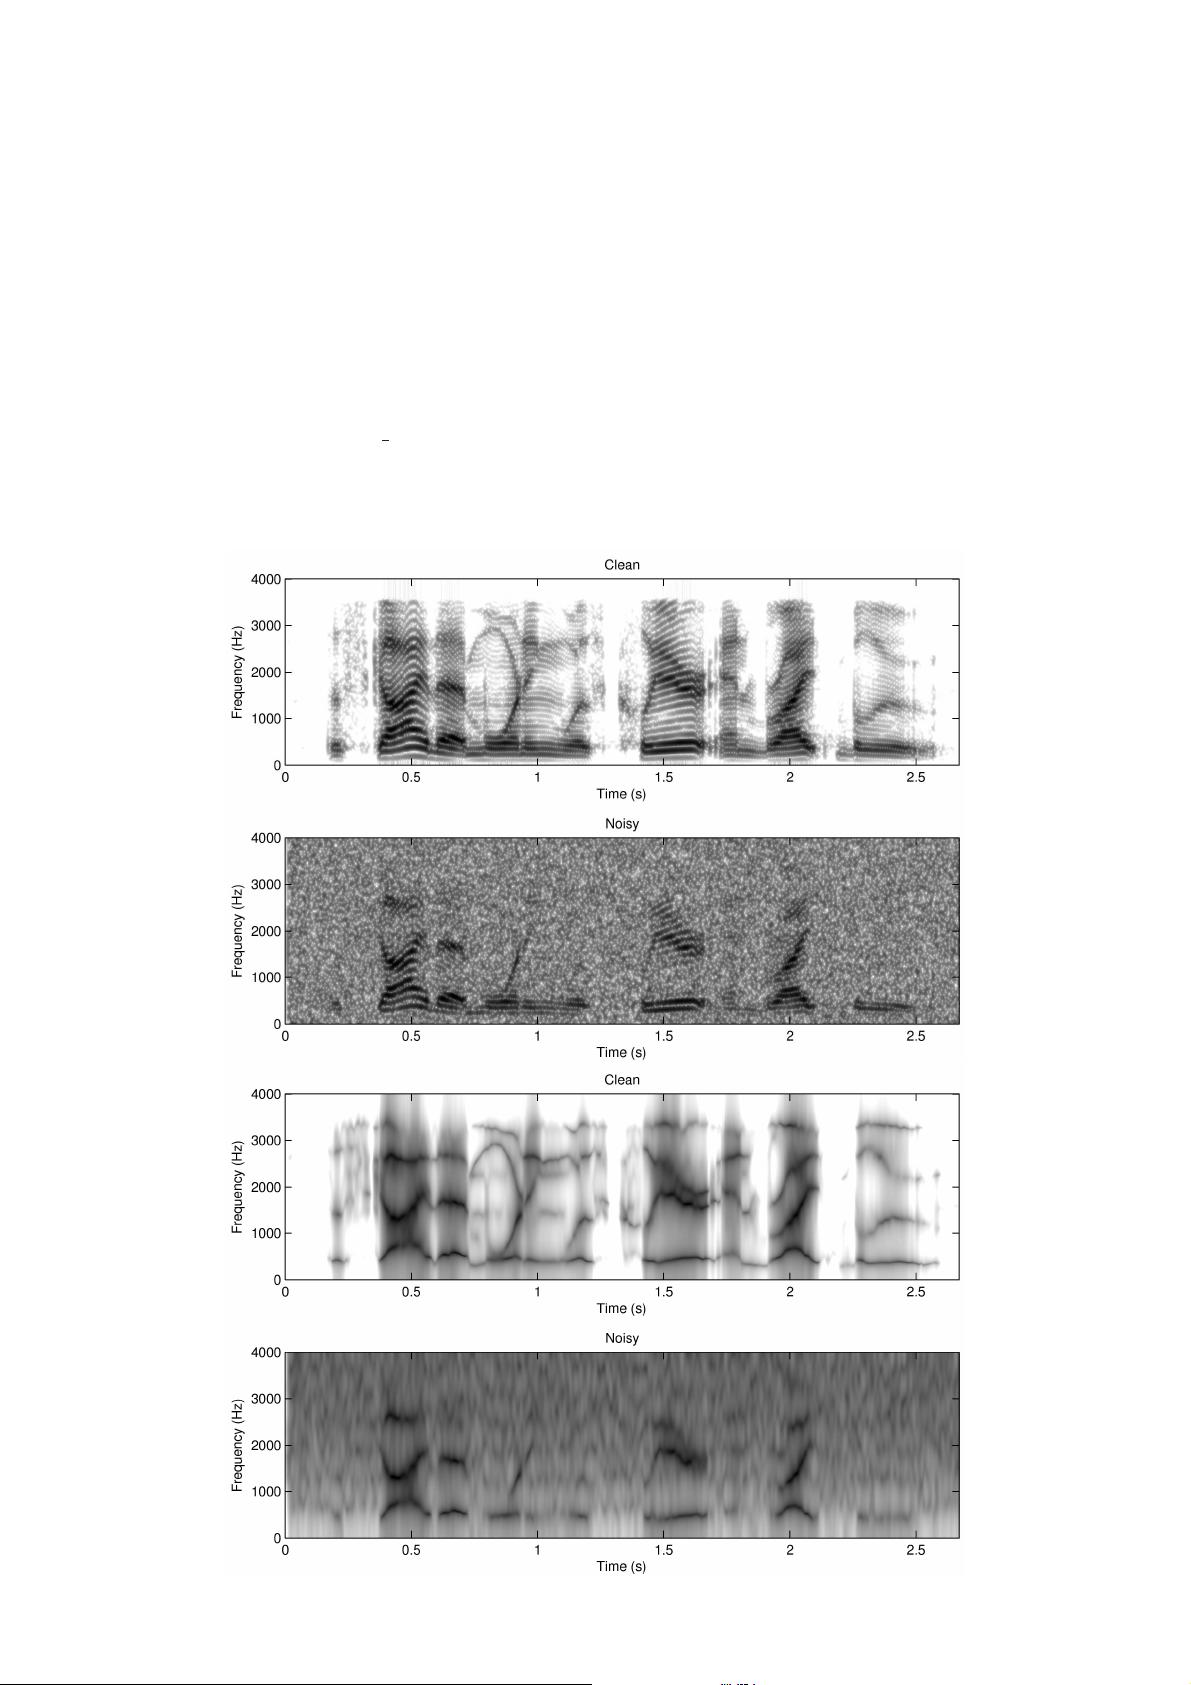
% @examples [handle] = myspectrogram(speech, 8000, [18 1], @hamming, 1024, [−45 −2], false, 'default', false, 'lp');
% [handle] = myspectrogram(speech, 8000, [18 1], @hamming, 1024, [−45 −2], [1 −0.97], 'default', true, 'per');
%
function [handle] = myspectrogram(s, fs, T, w, nfft, Slim, alpha, cmap, cbar, type)
%
% VALIDATE INPUTS, SET DEFAULTS
switch nargin
case 1, type='per'; cbar=false; cmap='default'; alpha=false; Slim=[−59,−1]; w=@hamming; T=[18,1]; nfft=1024; fs=8000;
case 2, type='per'; cbar=false; cmap='default'; alpha=false; Slim=[−59,−1]; w=@hamming; T=[18,1]; nfft=1024;
case 3, type='per'; cbar=false; cmap='default'; alpha=false; Slim=[−59,−1]; w=@hamming; T=[18,1];
case 4, type='per'; cbar=false; cmap='default'; alpha=false; Slim=[−59,−1]; w=@hamming;
case 5, type='per'; cbar=false; cmap='default'; alpha=false; Slim=[−59,−1];
case 6, type='per'; cbar=false; cmap='default'; alpha=false;
case 7, type='per'; cbar=false; cmap='default';
case 8, type='per'; cbar=false;
case 9, type='per';
case 10
otherwise, error('Invalid number of input arguments.');
end
%
% DECLARE VARIABLES
if(isstr(s)), [s, fs] = wavread(s); end; % read audio data from file
Tw = T(1); % frame width (ms)
Ts = T(2); % frame shift (ms)
Nw = round(fs
*
Tw
*
0.001); % frame width (samples)
Ns = round(fs
*
Ts
*
0.001); % frame shift (samples)
N = length(s); % length of speech signal (samples)
Smin = Slim(1); % lower normalized dynamic range limit
Smax = Slim(2); % upper normalized dynamic range limit
if(isstr(w)), w = str2func(w); end; % obtain window function handle from string input
%
% SPEECH PREPROCESSING
if(islogical(alpha) && alpha), s = filter([1 −0.95],1,s); % apply a typical preemphasis filter
elseif(¬islogical(alpha)) s = filter(alpha,1,s); end; % apply custom preemphasis filter
%
% GET SPECTROGRAM DATA
%[S,F,T] = spectrogram(s,w(Nw).',Nw−Ns,nfft,fs); % MATLAB's new spectrogram function
%[S,F,T] = specgram(s,nfft,fs,w(Nw).',Nw−Ns); % MATLAB's depreciated spectrogram function
[S,F,T] = toframes(s,w,T,fs,nfft,type); % Framing function, use this if you do not have the Signal Processing Toolbox
%
% SET DYNAMIC RANGE
S = abs(S); % compute magnitude spectrum
S = S/max(max(S)); % normalize magntide spectrum
% S(S<eps) = eps; % prevent zero spectral magnitude values
S = 20
*
log10(S); % compute power spectrum in dB
%
% PLOT AND LABEL RESULTS
handle = imagesc(T, F, S, [Smin Smax]);
%handle = imagesc(T, F, S, 'CDataMapping', 'direct');
axis('xy');
axis([0 N/fs 0 fs/2]);
% xlabel('time (s)', 'FontSize', 8, 'FontWeight', 'n');
% ylabel('frequency (Hz)', 'FontSize', 8, 'FontWeight', 'n');
% set(gca,'YDir','normal', 'FontSize', 6);
if(cbar), colorbar('FontSize',6); end
%
% DEFINE CUSTOM COLOR MAPS
switch(lower(cmap))
case {'default'}
colormap(
'gray');
map=colormap;
colormap(1−map);
otherwise, colormap(cmap);
end
2