


El Farol Bar Problem Results
Sergio
10/5/2020
El Farol Bar Problem
This is the file with the results ofthe El Farol Bar Problem Simulation (Arthur, 1994)
last_simulation_file <- system("ls -t runs/ |head -n1", intern = TRUE)
runs_dir = "runs/"
sim_results <- read.csv(file.path(runs_dir,last_simulation_file))
Including Plots
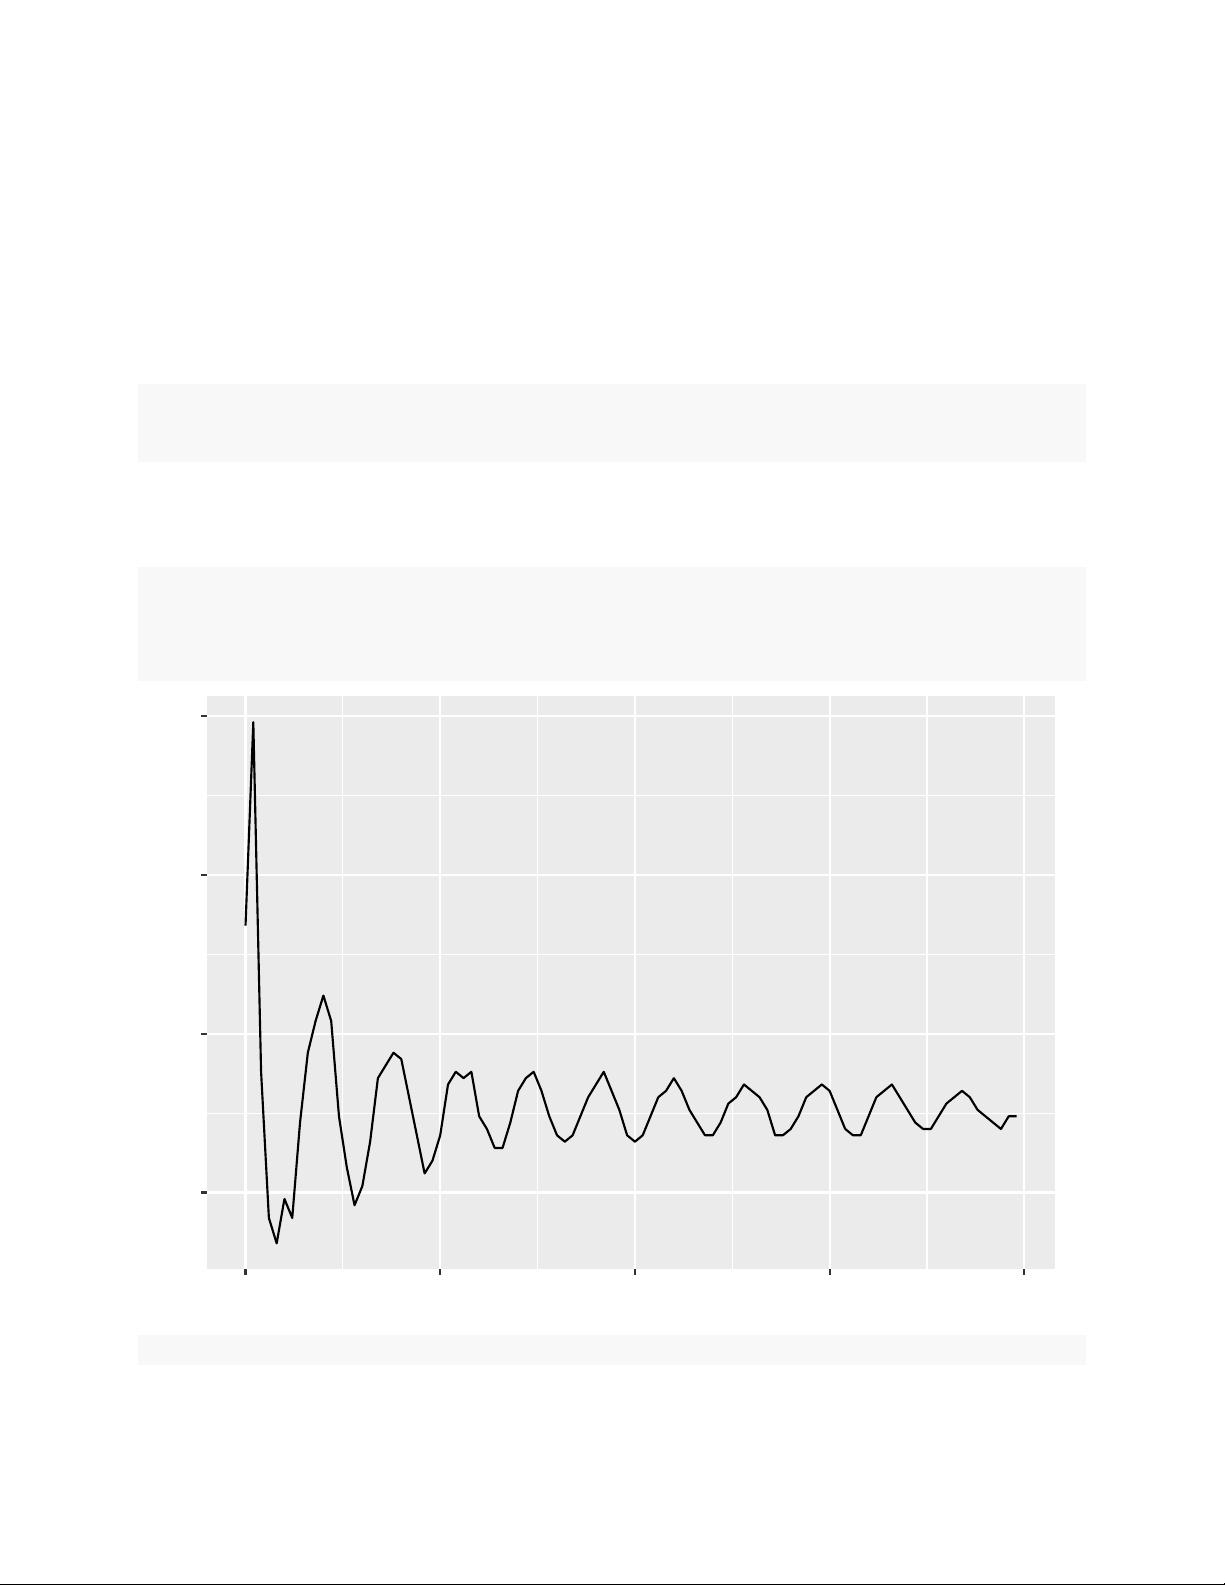
Attendance
attendance <- sim_results %>% group_by(run, step, my_play) %>%
count(my_play)
ggplot(data=subset(attendance, my_play == "GOING"), aes(x = step, y = n)) + geom_line()
25
50
75
100
0 25 50 75 100
step
n
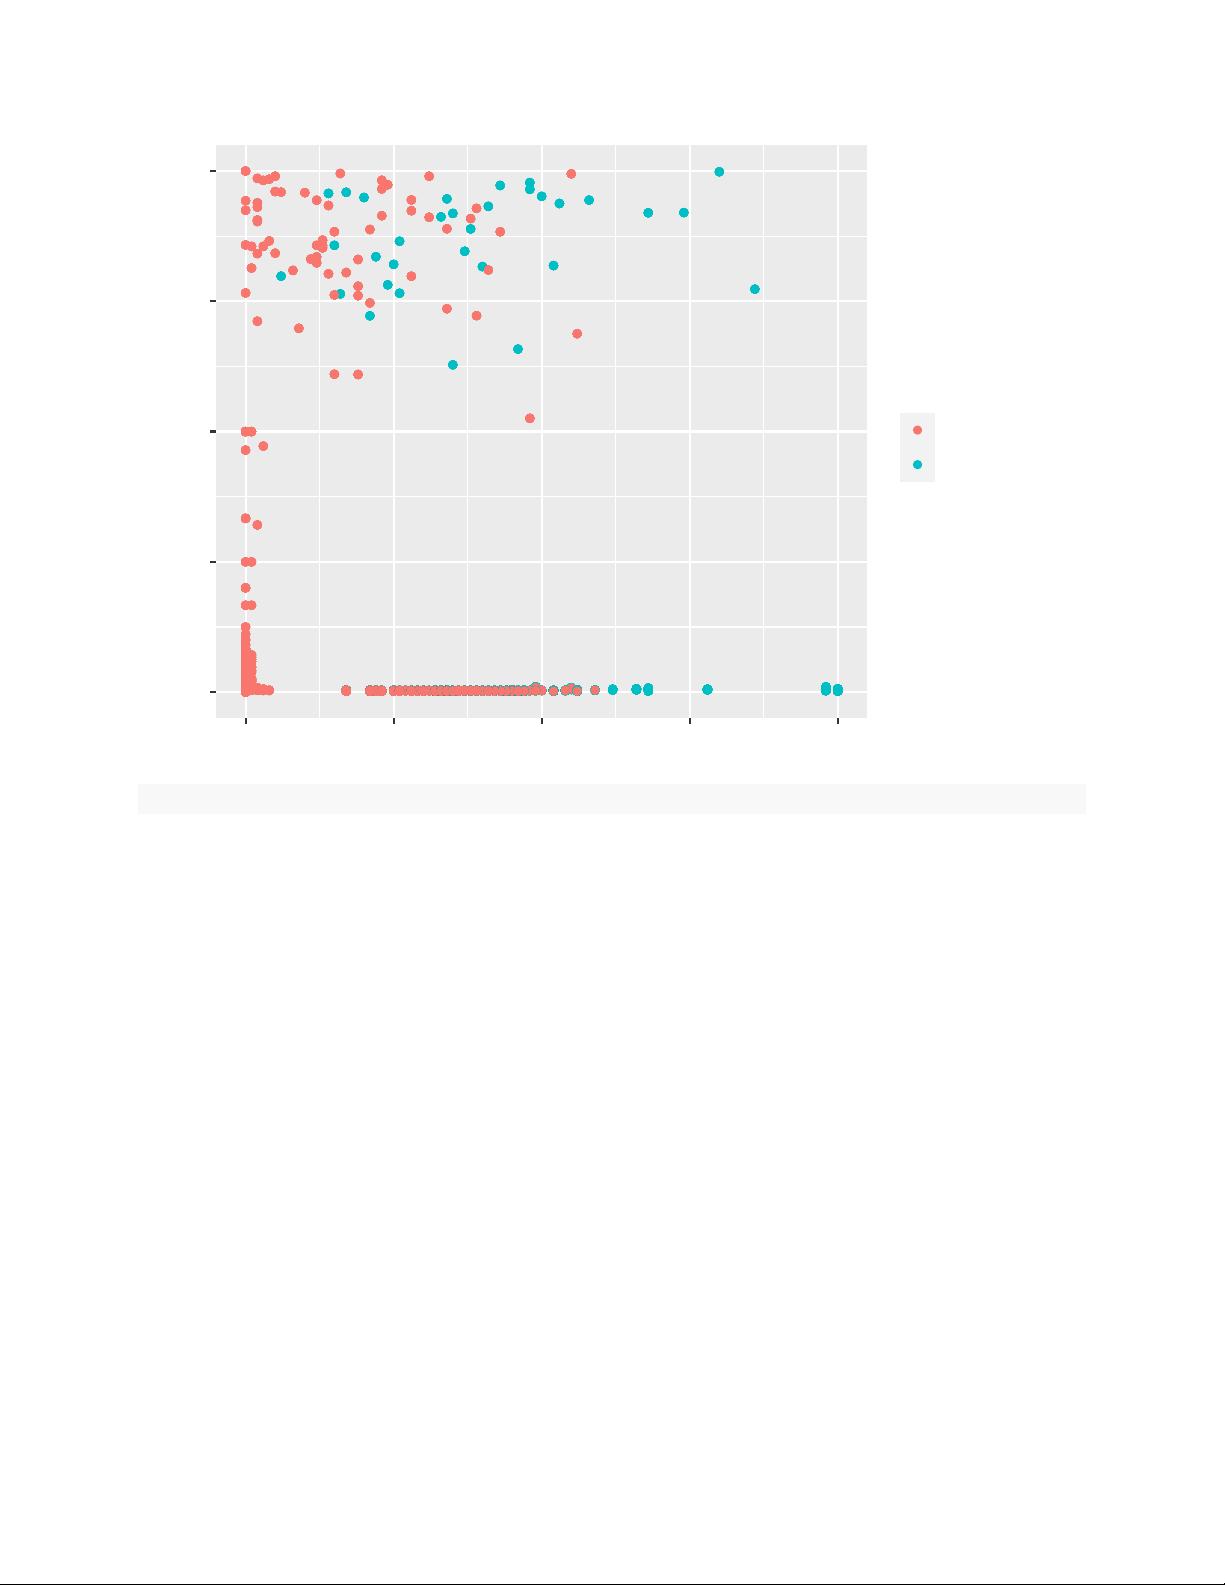
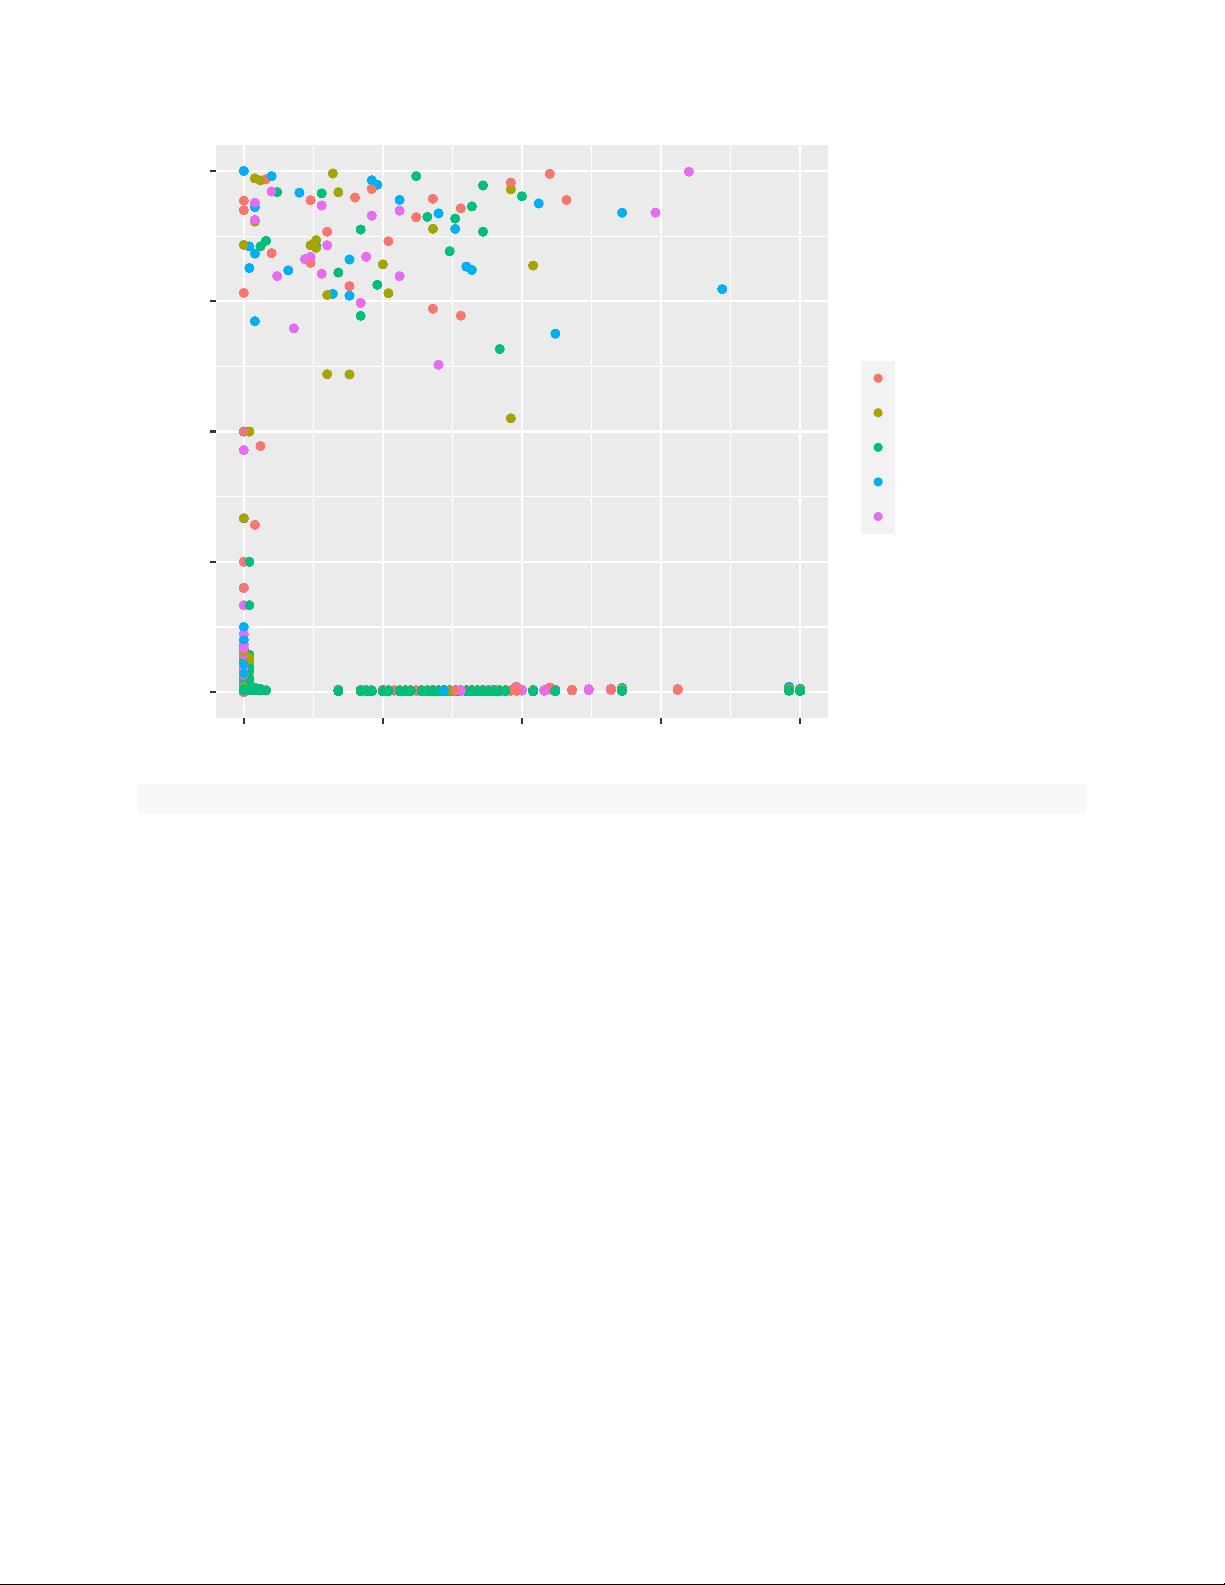
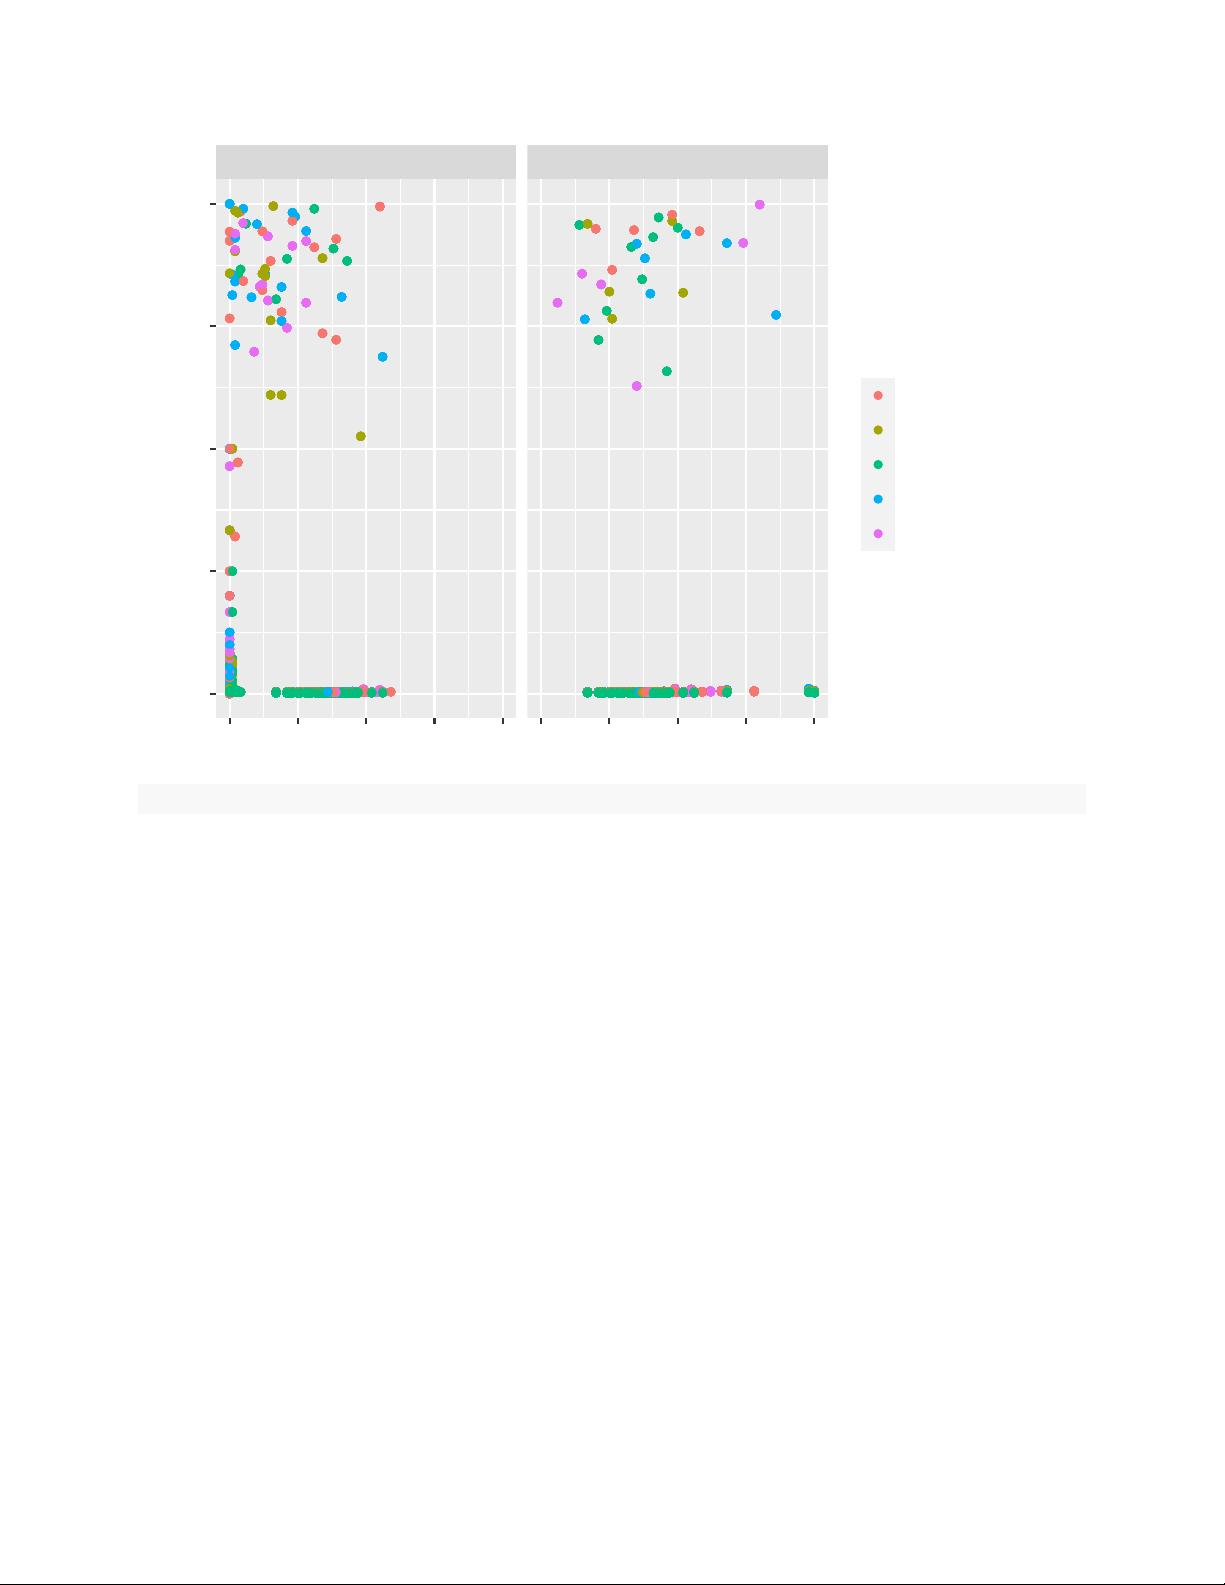
ggplot(sim_results, aes(predictor_prediction, predictor_fitness, color = my_play)) + geom_point()
1


评论0