
# Machine learning and IOT based Temperature monitoring system
This is the final capstone project done during internship in IOT BOLT

# Overview
Monitors the temperature of the room and sends email alert to the user if the temperature crosses the threshold limits(max and min).
Prediction of future temperature value by carrying polynomial regression.
Sends email alert to the user when there is an sudden change in the temperature by carrying z-score analysis.
# Applications of this system.
1.Monitor the temperature of the room by setting the threshold temperature values.It sends email alert to the user when the temperature exceeds the threshold temperature.
Email-“Temperature has reached above threshold value”
Examples :cold storage, pharmacy buildings,etc
2.It carries Z-score analysis and based on input values it sets the threshold values.It also sends email alert to the user when the temperature has dropped suddenly.
Email –“someone has opened the door”
Examples: Refrigerator door system
3. It carries polynomial regression analysis, which helps in predicting the temperature data.
# COMPONENTS
Hardware Components , Software apps and online services
Bolt wifi module
Bolt cloud
LM35 sensor
Ubuntu server
Piezo buzzer
VMware workstation
LED
Mailgun
Bread board
Jumper wires
Data cable
# Introduction
This project has primarily three functionalities i.e. sense the temperature of the room and send the email alert if it crosses the limit,carry out polynomial regression analysis to predict the future temperature data and carry out z-score analysis which will be able to detect the sudden change in temperature and sends the email alert to the user. Temperature monitoring systems are incredibly useful tools to monitor and manage heat levels .The right temperature monitoring system will enable to keep track of critical temperatures at all sites. The temperature of the place can be monitored through internet using internet of things. In this project LM35 sensor is used to sense the temperature.The system will continuously monitor the temperature condition of the room and the data is stored in the cloud.In this project I used Bolt wifi module to process the data and Blot cloud to store it. And it can be monitored at anytime and anywhere from the Internet. The main purpose of this system model is to make it easy for the user to view the current temperature.I have evaluated the system and showed that the framework can be used effectively to put into practice practical Internet of things applications over existing system
# Materials
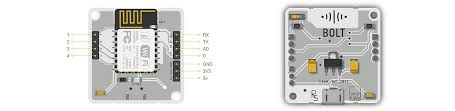
Bolt Wifi module
BOLT is an Internet of Things platform Hardware+Software that enables user to build IoT products and projects. Using BOLT, users can control and monitor devices from any part of the world.For more info visit [here](https://www.boltiot.com/)
LM35- Temperature sensor
The LM35 series are precision integrated-circuit temperature sensors, whose output voltage is linearly proportional to the Celsius(Centigrade) temperature

Piezo Buzzer
• A piezo buzzer is a sound producing device.
• The main working principle is based on the theory that, whenever an electric potential is applied across a piezoelectric material, a pressure variation is generated. A piezo buzzerconsists of piezo crystals in between two conductors

LED-Light emitting diode
An LED is an electronic device that emits light when an electrical current is passed through it. ... LEDs are commonly used for indicator lights (such as power on/off lights) on electronic devices

Mailgun
Mailgun is an Email automation service. It has a very powerful set of inbuilt functions for sending emails. Developers can process their email with the help of Mailgun API
[see here](http://a5theory.com/mailgun/)

VMware Workstation
VMware Workstation Pro is a hosted hypervisor that runs on x64 versions of Windows and Linux operating systems(an x86 version of earlier releases was available) it enables users to set up virtual machines (VMs) on a single physical machine, and use them simultaneously along with the actual machine
For getting some experience with different operating system .I have used this virtual os developer.You can also conduct this project in windows os itself using IDE like jupyter notebook etc

Ubuntu
Ubuntu Server is a server operating system, developed by Canonical , that runs on all major architectures: x86, x86-64, ARM v7, ARM64, POWER8, and IBM System z mainframes via LinuxONE
# Methods
# Polynomial regression
Polynomial regression is a form of regression analysis in which the relationship between the independent variable x and the dependent variable y is modelled as an nth degree polynomial in x. Polynomial regression fits a nonlinear relationship between the value of x and the corresponding conditional mean of y, denoted E(y |x). Although polynomial regression fits a nonlinear model to the data, as a statistical estimation problem it is linear, in the sense that the regression function E(y | x) is linear in the unknown parameters that are estimated from the data.
Prediction Points: This number tells the Visualizer how many future data points need to be predicted. By default, the Visualizer spaces the points with the data collection time in the hardware configuration of the product. So if you set the product to collect data every 5 minutes, and select 6 prediction points, the Visualizer will predict the trend and show 6 points up to 30 minutes into the future.
No. Polynomial Coefficients: Polynomial Visualizer processes the given input time-dependent data, and outputs the coefficients of the function of the form:
which most closely resembles the trend in the input data. This number tells the Visualizer how many elements should be present in the function i.e. the value of n.
Frame Size: These are the number of previous data points the Visualizer will use to predict the trend of the data. For example, if you set this value to 5, the Visualizer will use the previous 5 points to predict the trend.
# Anomaly detection by Z-score analysis
Z-score analysis is used for anomaly detection. Anomaly here means a variable's value (temperature of the surroundings) going beyond a certain range of values. The range of values is called bounds (upper bound and lower bound). These bounds are calculated using the input values, frame size and multiplication factor. The frame size is the minimum number of input values needed for Z-score analysis and the multiplication factor determines the closeness of the bounds to the input values curve.It basically works to detect any sudden change in the sensor value when someone opens the door of fridge the temperature suddenly changes and this anomaly when detected the alert message sent via Email to the user.
we calculate the Z score (Zn) for the data and use it to calculate the upper and lower threshold bounds required to check if a new data point is normal or anomalous. by formula
where Mn is taken as mean Vi is variance and Zn as Z-score.
All repeats again and again with an gap
 ML-and-IOT-based-Temperature-monitoring-system-main.zip (20个子文件)
  ML-and-IOT-based-Temperature-monitoring-system-main images
  IMG20200323235124.jpg 3.42MB temperature monitor circuit diagram_bb 1.jpg 290KB IMG20200323235134.jpg 3.51MB IMG20200325144700.jpg 4.05MB
 temperature monitor circuit diagram_bb.png 169KB IMG20200324222221.jpg 2.04MB temperature monitor circuit diagram_pcb.png 37KB temperature monitor circuit diagram_schem 2.jpg 77KB IMG20200325144651.jpg 3.73MB IMG20200325103223.jpg 6.18MB IMG20200323235328.jpg 3.78MB IMG_20200325_230015.jpg 1.32MB IMG20200323235146.jpg 3.62MB IMG20200325144610.jpg 2.59MB IMG20200325103336.jpg 5.42MB temperature monitor circuit diagram_bb.jpg 282KB IMG20200324222134.jpg 2.06MB IMG20200323235333.jpg 3.89MB
 README.md 15KB Images 1B
资源评论


w4676
- 粉丝: 28
- 资源: 4620


最新资源
- 串联式、并联式、混联式混合动力系统simulink控制策略模型(串联式、并联式、混联式每个都是独立的需要单独说拿哪个,默认是混联式RB) 有基于逻辑门限值、状态机的规则控制策略(RB)、基于等效燃油
- 法码滋.exe法码滋2.exe法码滋3.exe
- python-geohash-0.8.5-cp38-cp38-win-amd64
- Matlab根据flac、pfc或其他软件导出的坐标及应力、位移数据再现云图 案例包括导出在flac6.0中导出位移的fish代码(也可以自己先准备软件导出的坐标数据及对应点的位移或应力数据,可根据需
- 拳皇97.exe拳皇972.exe拳皇973.exe
- 捕鱼达人1.exe捕鱼达人2.exe捕鱼达人3.exe
- 医疗骨折摄像检测29-YOLO(v5至v9)、COCO、CreateML、Darknet、Paligemma数据集合集.rar
- ks滑块加密算法与源代码
- 医护人员检测23-YOLOv8数据集合集.rar
- 1.电力系统短路故障引起电压暂降 2.不对称短路故障分析 包括:共两份自编word+相应matlab模型 1.短路故障的发生频次以及不同类型短路故障严重程度,本文选取三类典型的不对称短路展开研究
资源上传下载、课程学习等过程中有任何疑问或建议,欢迎提出宝贵意见哦~我们会及时处理!
点击此处反馈


