2022-2-32146-Ass2-v11b-update26Sep2022 2022-11-2 232152 4.pdf
73 浏览量
2022-12-02
19:44:00
上传
评论
收藏 1.1MB PDF 举报

2022 Spring – DVVA: Assignment Two Page 1
32146 – Data Visualization and Visual Analytics
- 2022 Spring Semester
Assignment Two: Advanced Data Visualisation (30%) – individual
This assignment aims to ensure that students understand the high-dimensional data types and format. The
high-dimensional data visualisations required using different interaction and illustration tools. This
assignment mimics an analyst’s role in real life. The assignment also ensures that students understand the
various visualisation techniques when dealing with other forms of high-dimensional data.
Students must analyse and visualise the Tennis dataset containing US Open championship matches, which
includes 141 years of championship matches, both men and women, between 1881 and 2021. Dataset has
various data types and forms, including year, gender, champion’s name, nationality, champion seed, match
time, runner-up’s name, nationality, and score. Students have to use the required method to analyse and
visualise, which needs to convert into a different format for comparison.
15 pages, including tables and graphs, excluding bibliography.
Page guideline:
General Requirements:
Students must use the US Open Tennis dataset, which can be found and downloaded from Canvas. After
downloading the dataset, make sure to rename the dataset as Student-ID-Ass2.xlsx. The US Open Tennis
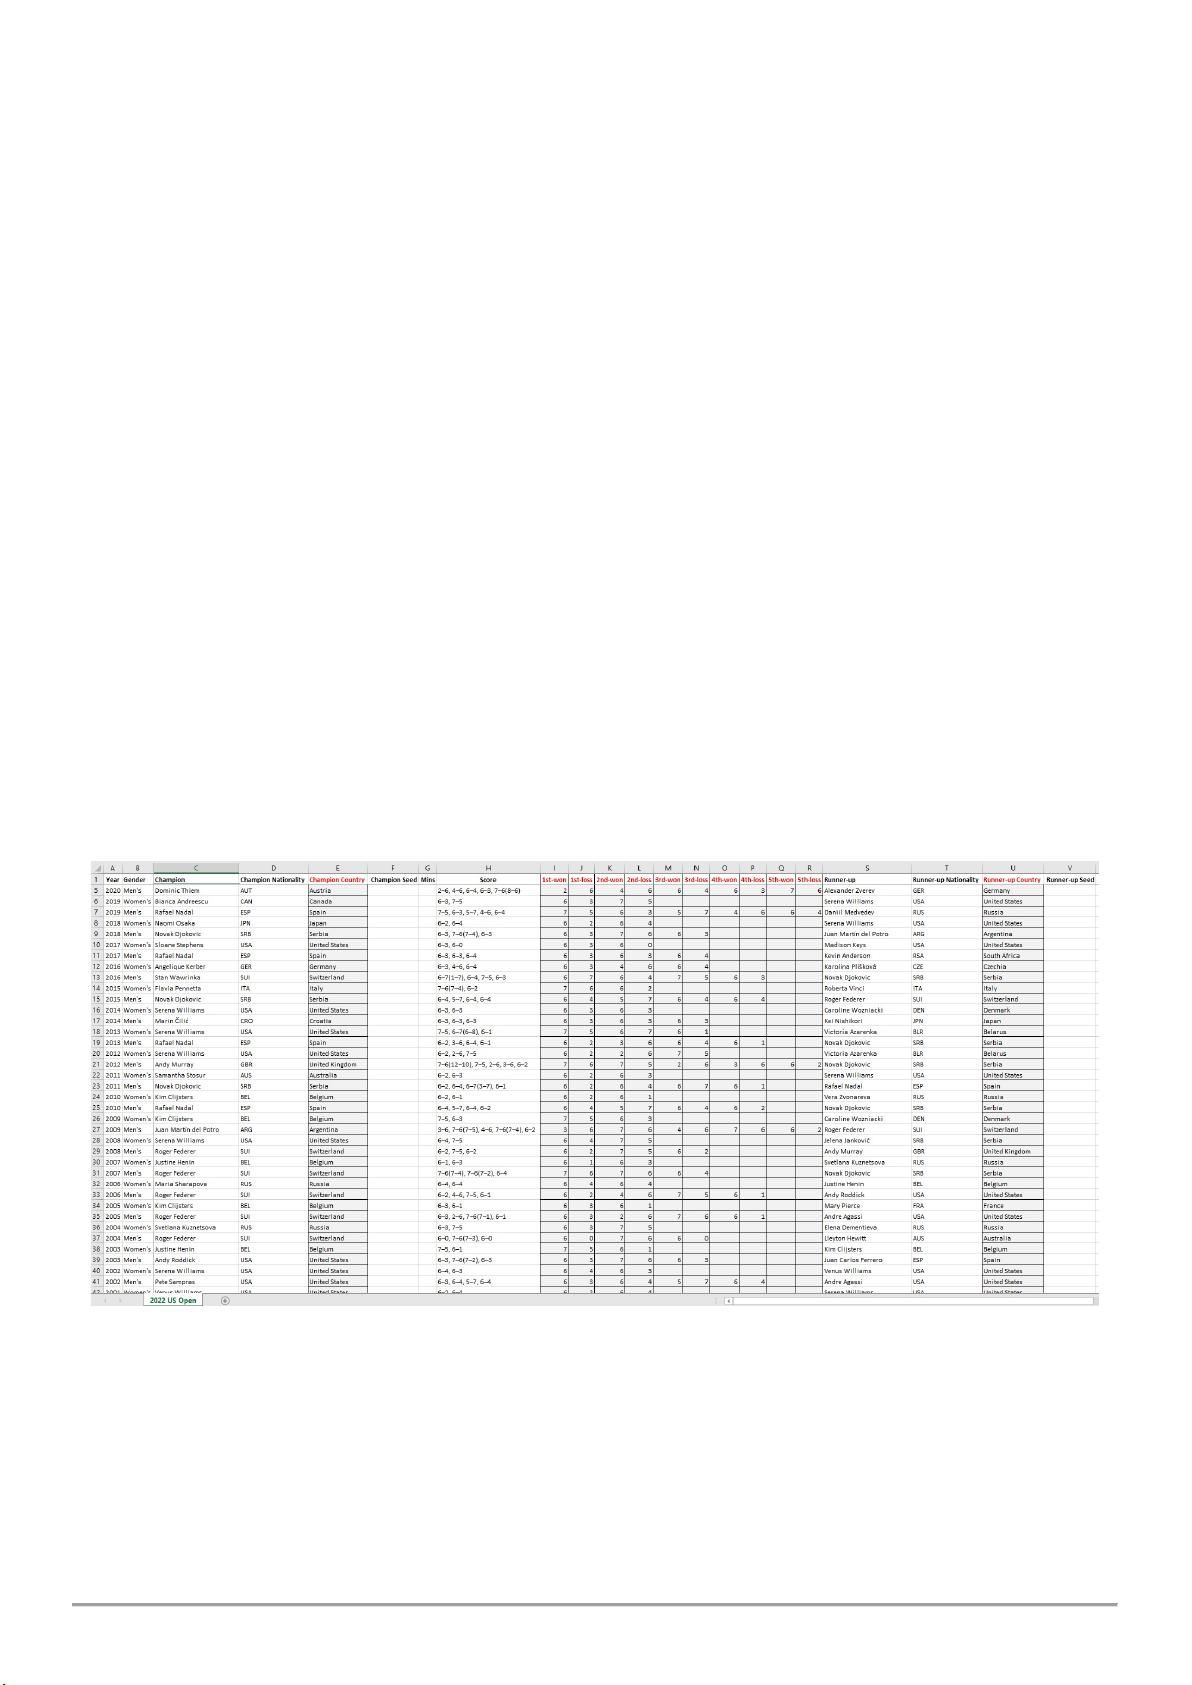
dataset styles are as follows.
There are three blank columns for Champion Seed, Mins, and Runner-up Seed. Those three values hadn’t
been appropriately recorded before 1945, so we removed them from the dataset. Two columns have been
created and filled for champion and runner-up countries because Tableau doesn’t recognise the nationality
code. In the scoreboard field, data is the text format that couldn’t compare. We have converted it into 10x new
columns representing each set of win and loss.
Students should create several new data sheets inside the Student-ID-Ass2.xlsx file to import them into
Tableau apps for visual analysis. Several visualisation graphs need to be created, including Treemap, Parallel
资源评论


