没有合适的资源?快使用搜索试试~ 我知道了~
1-s2.0-S093336572100052X-main(科研通-ablesci.com)1
需积分: 0 1 下载量 98 浏览量
2022-08-04
14:42:19
上传
评论
收藏 8.06MB PDF 举报
温馨提示
试读
16页
1-s2.0-S093336572100052X-main(科研通-ablesci.com)1
资源详情
资源评论
资源推荐
Articial Intelligence In Medicine 115 (2021) 102059
Available online 26 March 2021
0933-3657/© 2021 Elsevier B.V. All rights reserved.
CEFEs: A CNN Explainable Framework for ECG Signals
Barbara Mukami Maweu
a
,
*
,
1
, Sagnik Dakshit
a
,
1
, Rittika Shamsuddin
b
,
Balakrishnan Prabhakaran
a
a
Erik Jonsson School of Eng. & Computer Science, University of Texas, Dallas, Richardson, TX, USA
b
Computer Science, Oklahoma State University, Stillwater, OK, USA
ARTICLE INFO
Keywords:
Deep learning
Convolution neural network
ECG Signals
Explainable AI
Explainable Framework
Synthetic healthcare data
ABSTRACT
In the healthcare domain, trust, condence, and functional understanding are critical for decision support sys-
tems, therefore, presenting challenges in the prevalent use of black-box deep learning (DL) models. With recent
advances in deep learning methods for classication tasks, there is an increased use of deep learning in
healthcare decision support systems, such as detection and classication of abnormal Electrocardiogram (ECG)
signals. Domain experts seek to understand the functional mechanism of black-box models with an emphasis on
understanding how these models arrive at specic classication of patient medical data. In this paper, we focus
on ECG data as the healthcare data signal to be analyzed. Since ECG is a one-dimensional time-series data, we
target 1D-CNN (Convolutional Neural Networks) as the candidate DL model. Majority of existing interpretation
and explanations research has been on 2D-CNN models in non-medical domain leaving a gap in terms of
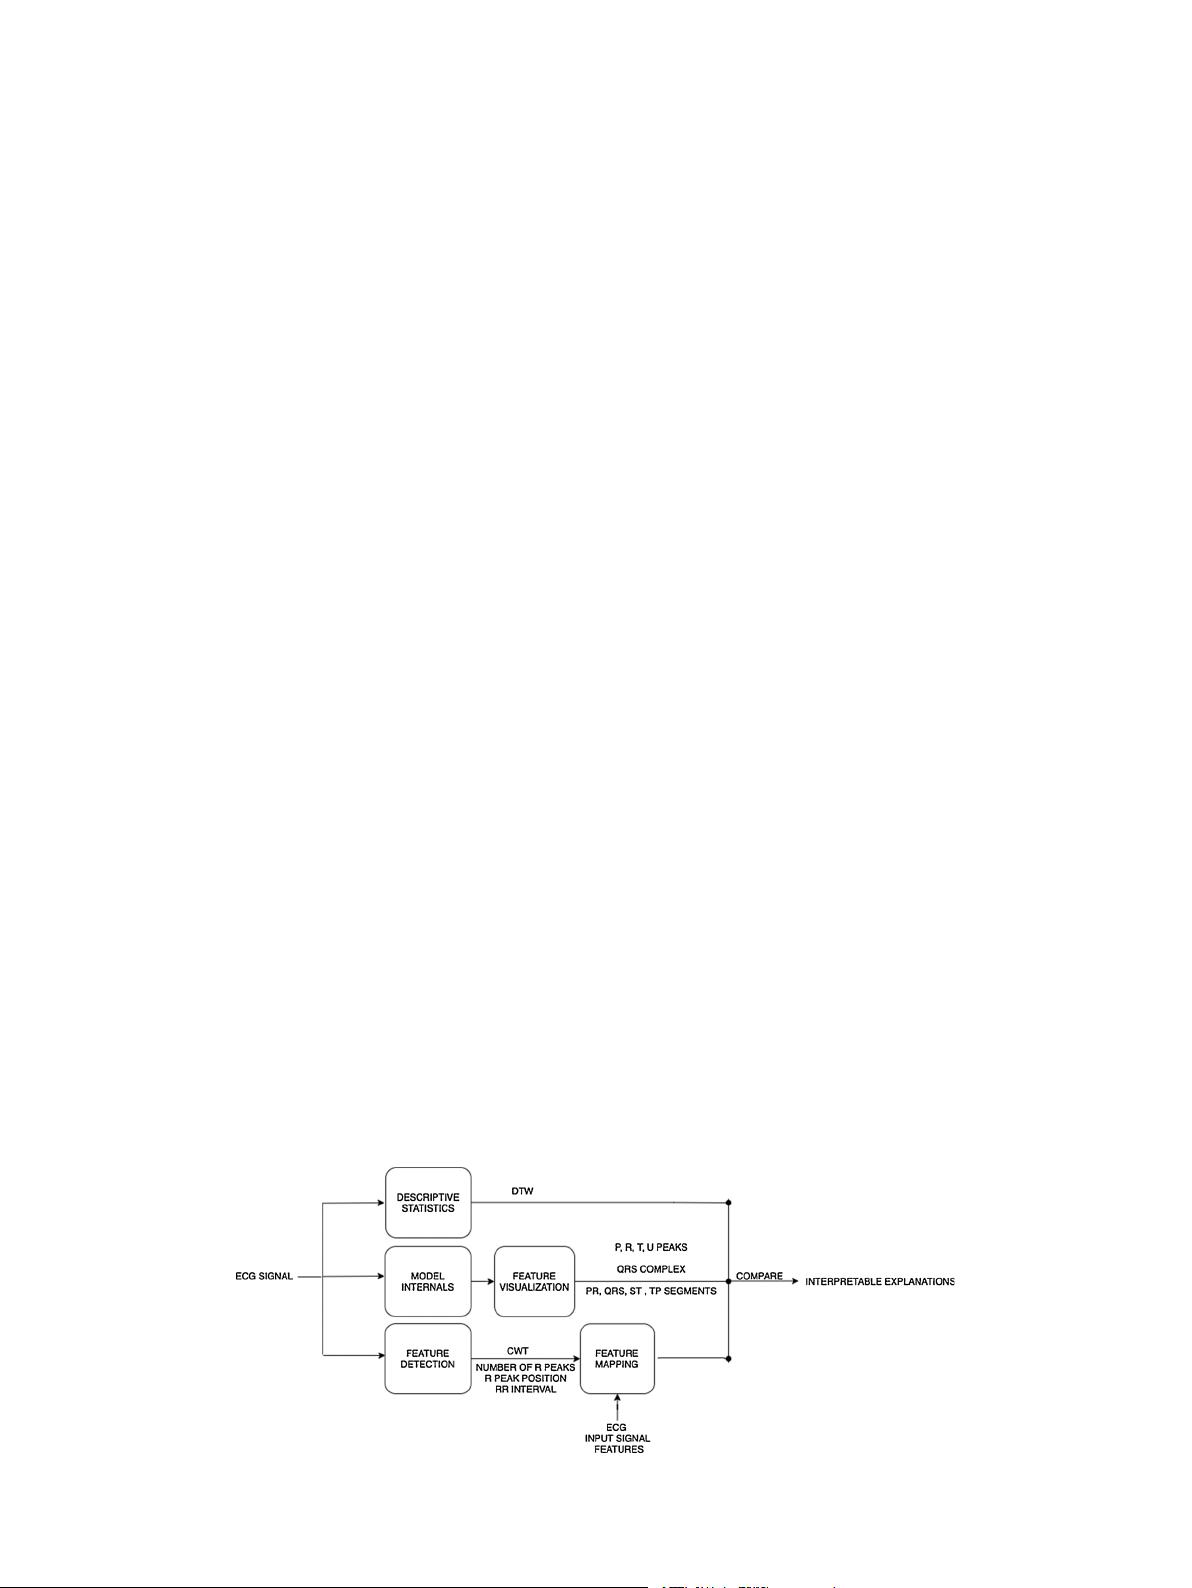
explanation of CNN models used on medical time-series data. Hence, we propose a modular framework, CNN
Explanations Framework for ECG Signals (CEFEs), for interpretable explanations. Each module of CEFEs provides
users with the functional understanding of the underlying CNN models in terms of data descriptive statistics,
feature visualization, feature detection, and feature mapping. The modules evaluate a model’s capacity while
inherently accounting for correlation between learned features and raw signals which translates to correlation
between model’s capacity to classify and it’s learned features. Explainable models such as CEFEs could be
evaluated in different ways: training one deep learning architecture on different volumes/amounts of the same
dataset, training different architectures on the same data set or a combination of different CNN architectures and
datasets. In this paper, we choose to evaluate CEFEs extensively by training on different volumes of datasets with
the same CNN architecture. The CEFEs’ interpretations, in terms of quantiable metrics, feature visualization,
provide explanation as to the quality of the deep learning model where traditional performance metrics (such as
precision, recall, accuracy, etc.) do not sufce.
1. Introduction
Deep learning models in healthcare are traditionally evaluated in
terms of accuracy, precision, and recall over the entire test set. These
metrics tell us the degree to which a model can accurately classify the
data but does not provide an interpretable explanation to the strength or
lack of capacity of the model. By the capacity of a model, we refer to the
model’s capability to correctly classify hard and easy cases alike. The
classication accuracy, precision, and recall alone are not sufcient for
deep learning-based applications in settings such as ICU (Intensive Care
Units) where ECG (Electrocardiogram) signals are monitored
automatically. There also persists the question whether the model has
learned the correct classication features (for instance, ECG features and
not some random Noise). An interpretable explanation-based metric
provides an understanding of the working of a neural network model
which can help researchers improve the model to accommodate both
hard and easy cases. While explainable methods such as class activation
mapping [31], saliency maps [27], and GradCam [11] exist, these are
not used as metrics for evaluation of model capacity and most of these
existing methods work more efciently with images, NLP (Natural
Language Processing) tasks, and 2D non-medical data. Furthermore, it is
not feasible to study each test signal’s activation maps or similar
* Corresponding author.
E-mail addresses: barbara.maweu@utdallas.edu (B.M. Maweu), sdakshit@utdallas.edu (S. Dakshit), r.shamsuddin@okstate.edu (R. Shamsuddin), bprabhakaran@
utdallas.edu (B. Prabhakaran).
1
Authors have equal contribution.
Contents lists available at ScienceDirect
Articial Intelligence In Medicine
journal homepage: www.elsevier.com/locate/artmed
https://doi.org/10.1016/j.artmed.2021.102059
Received 5 July 2020; Received in revised form 18 January 2021; Accepted 23 March 2021
Articial Intelligence In Medicine 115 (2021) 102059
2
explanations and improve the model as the existing explanations are
qualitative and not quantitative.
Model accuracy is a measure of performance in CNN (Convolutional
Neural Networks) models and therefore, models are designed to produce
high accuracy in classication tasks. The design of CNN models com-
prises stacked components such as convolution, activation, normaliza-
tion, subsampling and fully connected layers which produce inherently
complex models. To achieve high model performance, accuracy ulti-
mately becomes a compromise for model complexity and abstractions.
Model complexity tends to reduce both mechanical (inside) and func-
tional (outside) human understanding of a model. The layered feature
abstractions in CNN increase progressively depending on the depth of
the network. Each of these abstraction levels encode knowledge repre-
sentation which can be described and interpreted [23] for better human
understanding. The healthcare settings are a source of both structured
and unstructured data stored in form of medical images, physiological
time-series, and genomic sequences [24]
A majority of healthcare data such as ECG, Photoplethysmogram
(PPG), A-Scans of Optical Coherence Tomography (OCT), Electroen-
cephalogram (EEG) are in the form of time-series signals. Time-series
healthcare datasets present several challenges which include small
dataset size and inconsistently collected data [25]. These limitations
hinder the use of the state-of-the art CNN models because the models
exhibit poor performance when trained on small datasets. In addition to
these challenges, when CNN models are applied to medical decision
support systems, healthcare users seek trustable and interpretable
models that explain model outcomes [26] and insight in the features
learned. Research is continuing to focus on nding methods of both
extending the available small healthcare datasets and explaining these
black-box CNN models.
The structure of ECG signals depends on semantic relationships be-
tween waveform features shown in (Fig. 1) to arrive at a diagnosis. This
waveform dependency highlights the importance of achieving model
explanations that precisely show learned ECG feature and their contri-
bution to ECG classication. Traditional qualitative measures such as
accuracy, selectivity and specicity do not articulate the learned fea-
tures of CNN models thus providing users with only high classication
accuracy without associated explanation or interpretations. Majority of
existing interpretation and explanations research has been on 2D-CNN
models, in non-medical domain (as discussed in Section 2). This cre-
ates a need in terms of explanation of CNN models used on medical time-
series data. In this paper, we seek to explain and interpret knowledge
encoded in 1D-CNN layers trained on highly structured electrocardio-
gram (ECG) signals.
1.1. Proposed approach
We propose a modular framework, named, CNN Explainability
Framework for ECG signals (CEFEs), as shown in Fig. 2. Through the
modules of our framework, we demonstrate how explanations and in-
terpretations of a model are achieved by:
a) Understanding the evolution of machine-learned features across
layers of a model.
b) Comparative analysis of machine learned class discriminant features
and actual ECG observable diagnostic waveform features.
c) Understanding the relationships between machine-learned features
and the features’ contributions to misclassication of target classes.
Each module of CEFEs provides users with the functional under-
standing of the CNN models in terms of data descriptive statistics,
feature visualization, feature detection, and feature mapping. We iden-
tied three possible evaluation paradigms for CEFE: (a) model trained
on different volumes of the same dataset; (b) different models trained on
the same dataset; and (c) different models trained on different datasets.
In this paper, we elected to evaluate CEFEs using one model trained on
varying quantities of training data. CEFEs explanations were derived
from a custom one-dimensional convolution neural network (1D-CNN)
model trained on ECG signals to classify ECG arrhythmias. Following
model training, we performed post-hoc evaluation of the model using
CEFEs’ modular tests. CEFEs-based explanations derived from our 1D-
CNN impart visual, metric and feature based analysis. CEFEs also pro-
vides explanations for model improvement, model degradation, and no-
change model in performance. Additionally, these model explanations
provide insights into how varying quantity of training data affects model
explanations. In other words, our proposed CEFEs method provides a
comprehensive modular technique for post-hoc explanations of the
highly structured ECG data. CEFEs employs observable ECG features and
learned features of target classes to provide explanation. 1D-CNN model
explanations are described in terms of descriptive statistics, overlay
plots and mapping between ECG observable features and learned
features.
1.2. Contribution
The proposed framework, CEFEs, delivers:
1 Interpretable explanations by means of functional understanding of
internal mechanism of CNNs when used in ECG analysis support
Fig. 1. ECG Clinical Features [30] (X axis represents Time and Y axis represents Amplitude).
B.M. Maweu et al.
Articial Intelligence In Medicine 115 (2021) 102059
3
systems and therefore, addressing the trust gap found in these black-
box deep networks.
2 We propose the use of interpretable explanations as metrics that
evaluate the quality of CNN models through a set of tri-fold modular
tests: a) descriptive statistics, b) visualization and c) detction and
mapping of input ECG signal in comparison to its learned feature
maps.
3 We provide a benchmark for interpretable explanation-based eval-
uation of CNN models trained for ECG signal classication task.
1.3. Organization of the paper
Our paper is organized as follows: Section 3 describes the proposed
CEFEs framework together with its explainability modules. Section 4
denes the 1D-CNN that we trained on original ECG signals and we
provide modular results of CEFEs for this model. In Section 5, we use
CEFEs on our 1D-CNN models and provide empirical results that show
model improvements as models are trained with different increments of
training data. Finally, in Section 6 we present discussions surrounding
our results and application of CEFEs followed by the paper conclusion in
Section 7.
2. Related works
In this section, we review research literature on explainable and
interpretable methods for deep networks in two categories:
(a) Explanation from interpretable models
(b) Explanations from post-hoc model analysis.
We present works that show how model explanations have previ-
ously been achieved in various data modalities and in different domains.
2.1. Interpretable models
Interpretable models incorporate design features that inherently
capture interpretable representations of a model’s internal mechanism.
Majority of interpretable models are motivated by image data with very
few applied to physiological timeseries data. The work of Zhang et al.
[18] proposed an automated method that maps higher level CNN lters
to an object-part (CNN semantics) instead of traditional input patterns
on image data. Their interpretable model applies techniques that modify
components of black-box deep learning models in such a way that
interpretable knowledge representations are easily obtained. Other
interpretable models assign a score to input data such as [19], which
uses Layer wise Relevance Propagation (LRP) method to capture
explanation. Although LRP analyzes electroencephalogram (EEG)
timeseries data, this method unlike CEFEs does not provide knowledge
on features or structure of signal learned by the model and only shows an
assigned relevance scores of data points and their contribution to model
prediction.
2.2. Post-hoc model explanations
Post-hoc explanations provide functional explanations that describe
trained models with respect to input data. An important aspect of model
explanation methods [9, 10, and 11] is exibility in use across different
deep learning models, as in our proposed CEFEs. Common post-hoc
explanation methods include data perturbation and feature scoring [9,
29], activation maximization [1,11], and backward propagation [27,
28]. Visual explanations method using activation maximization such as
Gradient-weighted Class Activation Mapping (GRAD-CAM) proposed in
[11], tags the discriminative area of a target class. The tagged discrim-
inative area is dened by computing class specic gradients in the nal
convolution layer and then outputs a localization heat map of the pre-
dicted class [32]. introduced a post-hoc interpretability method Testing
with Concept Activation Vector (TCAV) method of post-hoc interpret-
ability which optimizes a quantitative measure of explanation based on
high level domain concepts. Our proposed CEFEs framework also uses
high-level domain concepts similar to [32]. The difference is that our
goals are: (a) discover whether domain concepts such as ECG diagnostic
waveforms are learnt by deep learning models; (b) provide model ca-
pacity and classication explanations based on how well a trained model
has learned the domain concepts.
While GRAD-CAM localizes the class discriminative area, it does not
give a measure of the error of the model’s localized discriminative area
and relies simply on visual interpretation of the expert user. Image data
explanations found in Local Interpretable Model-agnostic Explanations
(LIME) by [9] are model-agnostic and employ localized data perturba-
tions to compute importance scores of image pixels. An importance
scores subsequently draws attention to image pixels with positive weight
for a specic class. We show through our experiments that visualization
alone is not sufcient and is not always interpretable for complex
medical signals specially in deeper layers.
Springenberg et al. [29], in addition to values that separate feature
by their importance, provides formal mathematical denition in the
axiomatic based method to extract explainable rules a model. Rule
extraction for deep learning models provide rules for diagnosis and class
discrimination but does not provide interpretation or explanation for a
model’s capacity. Furthermore, the extracted rules for medical decision
Fig. 2. CNN Explainability Framework for ECG signals (CEFEs).
B.M. Maweu et al.
Articial Intelligence In Medicine 115 (2021) 102059
4
systems require expert opinion and cannot be used as a metric for model
capacity and understanding performance. Another popular explan-
ability tool SHAP (Shapely Additive Explanations) [10] describe the
contribution of each input feature towards model outcomes. However,
the lack of feature dataset in clinical decision system such as ECG
diagnosis, continuous 1D nature of ECG signals make it unsuitable for
use. None of the methods illustrated are specic to be used as metric for
understanding model capacity and performance in time series medical
datasets.
Explanations for models trained on time-series data use extracted
shapelet [15,16] (time-series subsequences) which are suited for
discovering the best patterns that are representative of a target class.
Time-series tweaking in [16] is a method applied to time-series data
although not applied to provide explanation for deep networks.
Time-series tweaking nds the minimum number of changes needed in
order to change an input classication outcome in a random forest type
of classier. These time series explanations cannot be used as metric for
evaluation of model performance. While CEFEs does not use shapelets to
extract model learned features, it uses ECG waveform segmentation
techniques to discover, map and compare model learned features to
those in input ECG signals. The methods in [9–11] and [27–29] focused
input feature scoring and data perturbation differ with our proposed
CEFEs which provides interpretable insights on specic features learned
by a 1D-CNN model and explanations on how these learned features
affect CNN model capacity and outcomes.
In summary, literature survey shows majority of interpretation and
explanations research has been on 2D-CNN models in non-medical
domain, leaving a gap of explanation of medical time-series data.
Traditional metrics such as accuracy, sensitivity, and selectivity are not
sufcient for providing details of structural ECG features learned by a
CNN model. The challenges posed by medical signal datasets as dis-
cussed in the Introduction section, hinders ability of CNN to learn,
especially specic intricate structural clinical features for clinical diag-
nosis. Developing interpretable and explainable techniques for health-
care timeseries data creates supportive trust and condence in
automated decision support systems. CEFEs framework addresses these
gaps by providing interpretable explanations for CNN models trained on
ECG timeseries data, by focusing on post-hoc model interpretability in
terms of model capacity.
3. CEFEs
We aim to provide transparency and functional understanding of 1D-
CNN model using a layer-wise interpretation of relevant features learned
by the model. Denitions of Interpretation and Explanation in the context
of computation models are often used interchangeably. Montavon et al.
[1] denes Interpretation as the idea of mapping from feature space (e.g.,
predicted class) into a human comprehendible domain and Explanations
as a set of features in the interpretable domain that contribute towards
class discrimination.
Our proposed framework (Figs. 2 and 3) for ECG signals, is a post-hoc
tri-modular evaluation structure that provides local interpretations and
explanations from convolution neural networks. Local interpretations
and explanations of a model explain the “why” of individual test case
predictions. In this section, we present the details of CEFEs modules and
the process by which the framework achieves model interpretation and
explanations.
1 Descriptive Statistics: Descriptive statistics are summary analysis of
representative model features or input data. These representations
help users realize a model’s capacity to learn inherent statistical and
mechanical features of data such as waveform shape features of
signal. CEFEs descriptive statistics module uses task dependent tests
to analyze an input ECG signal and corresponding feature map
extracted from a convolution layer of a trained CNN model. Although
the choice of CNN layer for statistical analysis is not limited to a
specic layer, we were motivated to use the nal convolution layer
(Conv
nal
) because this layer incorporates both low level and high-
level data features and balances spatial and semantics information
contribute to explainable and interpretable class discrimination ar-
tifacts. Descriptive statistics tests are task dependent. We chose Dy-
namic Time Warping (DTW) algorithm to compute the similarities
between the input ECG signal and the CNN model learned features.
DTW enabled us to analyze and observe learned representation of the
rigid ECG signal morphology. DTW distance measures are organized
into intra-model distance (Eq. 1) and inter-model distance (Eq. 2).
Intra-model distance (d
intra
) is the warped Euclidean similarity
measure returned by DTW from an input ECG signal and feature map
projections. We dene (d
intra
) as a value that represents how well a
model has learned input ECG shape features. A low (d
intra
) value
explains that a model has adequately learned ECG shape features.
Once (d
intra
) values of several models are computed, we compute the
difference in learned ECG shape features between two CNN models
using the inter-model distance (d
inter
). The (d
inter
) values are used as a
comparative measure of ECG shape features learned between two
models trained on similar input ECG signals. A high (d
inter
) value
explains the differences in prediction outcomes of two models on a
xed test set [17].
d
intra
=
K
k=1
x
k,m
− y
k,n
∗
x
k,m
− y
k,n
(1)
d
inter
= |d
M
y1
intra
− d
M
y2
intra
| (2)
Where k represents the samples, m
th
data point of one input signal (ECG
Signal), n
th
data point of other input signal (Feature Map) and M
y1
, M
y2
represent the two models under comparison. We approximate d
inter
and
Fig. 3. CEFEs - Explainable Modules.
B.M. Maweu et al.
剩余15页未读,继续阅读
臭人鹏
- 粉丝: 24
- 资源: 328
上传资源 快速赚钱
- 我的内容管理 展开
- 我的资源 快来上传第一个资源
- 我的收益 登录查看自己的收益
- 我的积分 登录查看自己的积分
- 我的C币 登录后查看C币余额
- 我的收藏
- 我的下载
- 下载帮助
最新资源
- 基于Javascript的影视动画设计源码 - cad
- 基于Java和深度学习的瓦斯浓度预测系统后端设计源码 - 瓦斯浓度预测后端
- Screenshot_20240528_103010.jpg
- 基于Python的新能源承载力计算及界面设计源码 - HAINING-DG
- 基于Java的本科探索学习项目设计源码 - 本科探索
- 基于Javascript和Python的微商城项目设计源码 - MicroMall
- 基于Java的网上订餐系统设计源码 - online ordering system
- 基于Javascript的超级美眉网络资源管理应用模块设计源码
- 基于Typescript和PHP的编程知识储备库设计源码 - study-php
- Screenshot_2024-05-28-11-40-58-177_com.tencent.mm.jpg
资源上传下载、课程学习等过程中有任何疑问或建议,欢迎提出宝贵意见哦~我们会及时处理!
点击此处反馈
安全验证
文档复制为VIP权益,开通VIP直接复制
信息提交成功
评论0