综述RNAseq的最佳分析流程A_survey_of_best_practices_for_RNA_seq_data_analy
需积分: 0 72 浏览量
2022-08-03
12:39:10
上传
评论
收藏 1.02MB PDF 举报

REVIE W Open Access
A survey of best practices for RNA-seq data
analysis
Ana Conesa
1,2*
, Pedro Madrigal
3,4*
, Sonia Tarazona
2,5
, David Gomez-Cabrero
6,7,8,9
, Alejandra Cervera
10
,
Andrew McPherson
11
, Michał Wojciech Szcześniak
12
, Daniel J. Gaffney
3
, Laura L. Elo
13
, Xuegong Zhang
14,15
and Ali Mortazavi
16,17*
Abstract
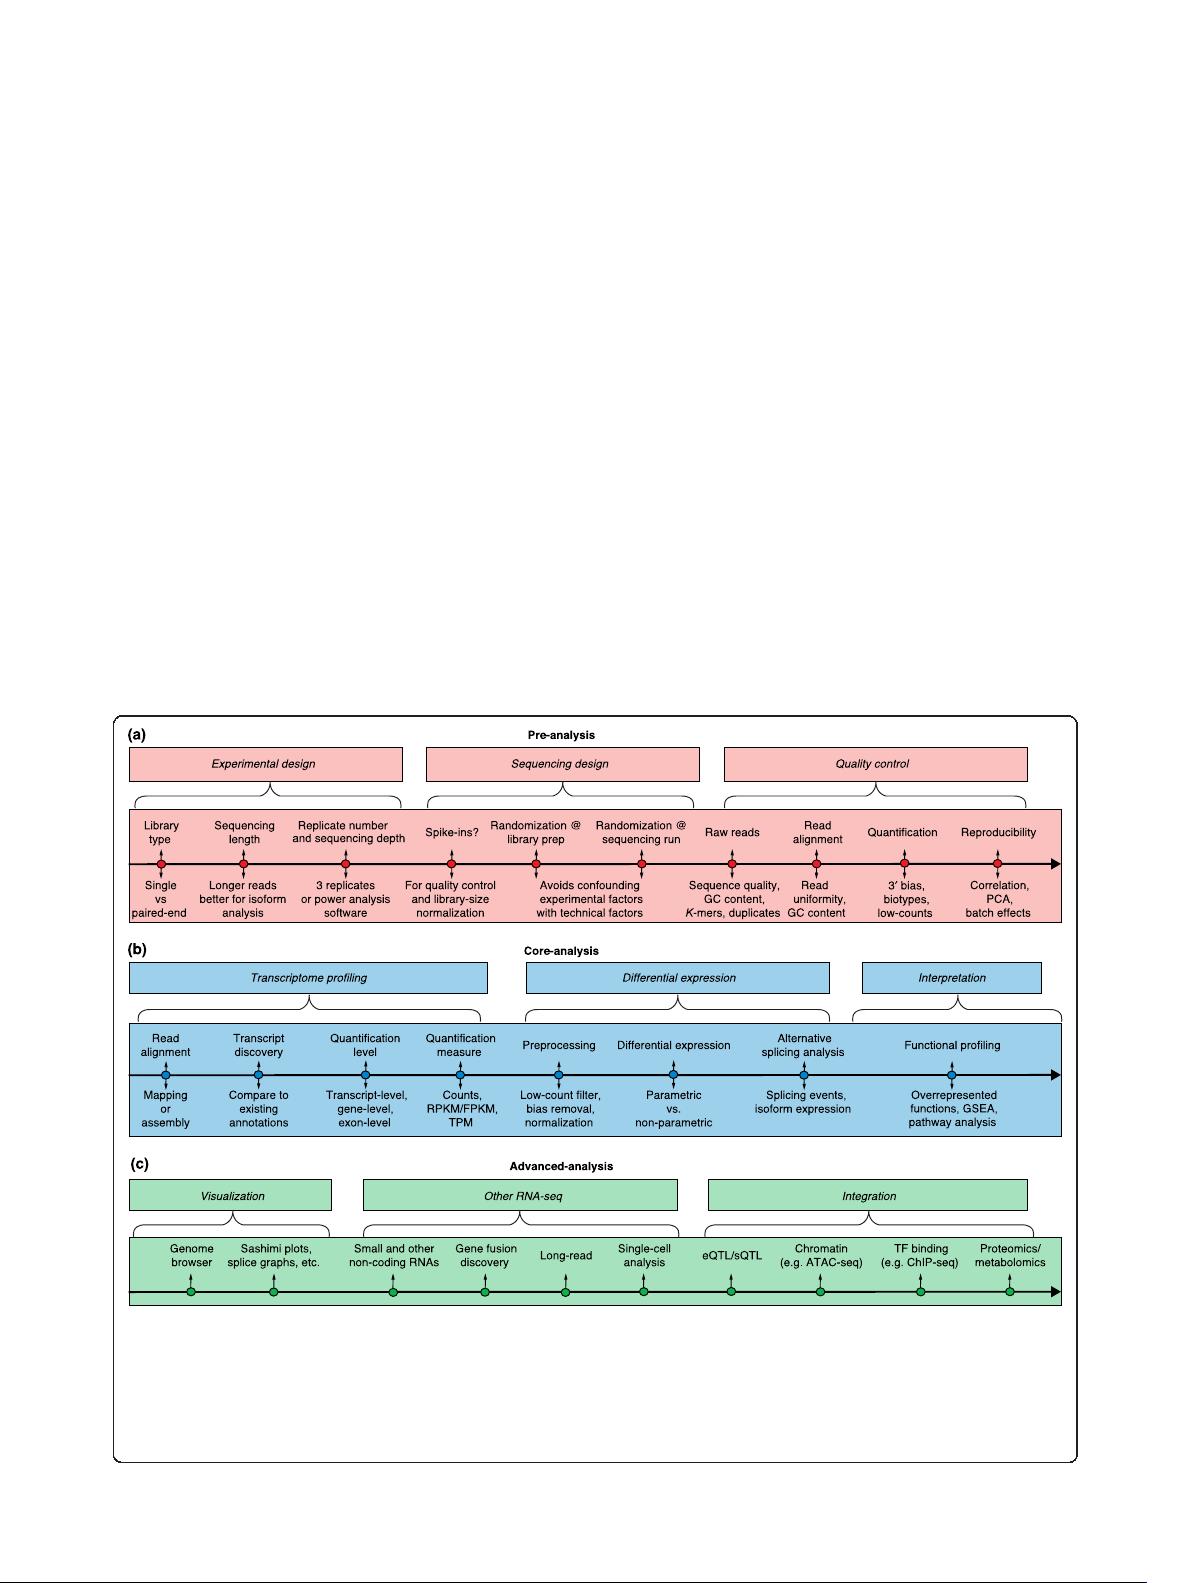
RNA-sequencing (RNA-seq) has a wide variety of
applications, but no single analysis pipeline can be
used in all cases. We review all of the major steps in
RNA-seq data analysis, including experimental design,
quality control, read alignment, quantification of gene
and transcript levels, visualization , differential gene
expression, alternative splicing, functional analysis,
gene fusion detection and eQTL mapping. We
highlight the challenges associated with each step.
We discuss the analysis of small RNAs and the
integration of RNA-seq with other functional
genomics techniques. Finally, we discuss the outlook
for novel technologies that are changing the state of
the art in transcriptomics.
Background
Transcript identification and the quantification of gene
expression have been distinct core activities in molecular
biology ever since the discovery of RNA’s role as the key
intermediate between the genome and the proteome.
The power of sequencing RNA lies in the fact that the
twin aspects of discovery and quantification can be com-
bined in a single high-throughput sequencing assay
called RNA-sequencing (RNA-seq). The pervasive adop-
tion of RNA-seq has spread well beyond the genomics
community and has become a standard part of the toolkit
used by the life sciences research community. Many varia-
tions of RNA-seq protocols and analyses have been
* Correspondence: aconesa@ufl.edu; pm12@sanger.ac.uk; ali.mortazavi@uci.edu
1
Institute for Food and Agricultural Sciences, Department of Microbiology
and Cell Science, University of Florida, Gainesville, FL 32603, USA
3
Wellcome Trust Sanger Institute, Wellcome Trust Genome Campus, Hinxton,
Cambridge CB10 1SA, UK
16
Department of Developmental and Cell Biology, University of California,
Irvine, Irvine, CA 92697-2300, USA
Full list of author information is available at the end of the article
published, making it challenging for new users to appreci-
ate all of the steps necessary to conduct an RNA-seq study
properly.
There is no optimal pipeline for the variety of different
applications and analysis scenarios in which RNA-seq
can be used. Scientists plan experiments and adopt dif-
ferent analysis strategies depending on the organism be-
ing studied and their research goals. For example, if a
genome sequence is available for the studied organism,
it should be possible to identify transcripts by mapping
RNA-seq reads onto the genome. By contrast, for organ-
isms without sequenced genomes, quantification would
be achieved by first assembling reads de novo into con-
tigs and then mapping these contigs onto the transcrip-
tome. For well-annotated genomes such as the human
genome, researchers may choose to base their RNA-seq
analysis on the existing annotated reference transcrip-
tome alone, or might try to identify new transcripts and
their differential regulation. Furthermore, investigators
might be interested only in messenger RNA isoform ex-
pression or microRNA (miRNA) levels or allele variant
identification. Both the experimental design and the ana-
lysis procedures will vary greatly in each of these cases.
RNA-seq can be used solo for transcriptome profiling or
in combination with other functional genomics methods
to enhance the analysis of gene expression. Finally, RNA-
seq can be coupled with different types of biochemical
assay to analyze many other aspects of RNA biology, such
as RNA–protein binding, RNA structure, or RNA–RNA
interactions. These applications are, however, beyond the
scope of this review as we focus on ‘typical’ RNA-seq.
Every RNA-seq experimental scenario could poten-
tially have different optimal methods for transcript
quantification, normalization, and ultimately differential
expression analysis. Moreover, quality control checks
should be applied pertinently at different stages of the
analysis to ensure both reproducibility and reliability of
the results. Our focus is to outline current standards
© 2016 Conesa et al. Open Access This article is distributed under the terms of the Creative Commons Attribution 4.0
International License (http://creativecommons.org/licenses/by/4.0/), which permits unrestricted use, distribution, and
reproduction in any medium, provided you give appropriate credit to the original author(s) and the source, provide a link to
the Creative Commons license, and indicate if changes were made. The Creative Commons Public Domain Dedication waiver
(http://creativecommons.org/publicdomain/zero/1.0/) applies to the data made available in this article, unless otherwise stated.
Conesa et al. Genome Biology (2016) 17:13
DOI 10.1186/s13059-016-0881-8


剩余18页未读,继续阅读


评论0