没有合适的资源?快使用搜索试试~ 我知道了~
瑞信-亚太地区-媒体行业-澳大利亚媒体行业:二月财报季预览-25-39页.pdf
需积分: 0 0 下载量 79 浏览量
2023-07-29
09:41:12
上传
评论
收藏 918KB PDF 举报
温馨提示
试读
38页
瑞信-亚太地区-媒体行业-澳大利亚媒体行业:二月财报季预览-25-39页.pdf
资源推荐
资源详情
资源评论
DISCLOSURE APPENDIX AT THE BACK OF THIS REPORT CONTAINS IMPORTANT DISCLOSURES, ANALYST
CERTIFICATIONS, LEGAL ENTITY DISCLOSURE AND THE STATUS OF NON-US ANALYSTS. US Disclosure: Credit
Suisse does and seeks to do business with companies covered in its research reports. As a result, investors should be aware
that the Firm may have a conflict of interest that could affect the objectivity of this report. Investors should consider this report
as only a single factor in making their investment decision.
5 February 2019
Asia Pacific/Australia
Equity Research
Media
Australian Media Sector
PRE RESULTS COMMENT
Research Analysts
Entcho Raykovski
61 3 9280 1716
Lachlan Brown
61 3 9280 1659
February 2019 reporting season preview
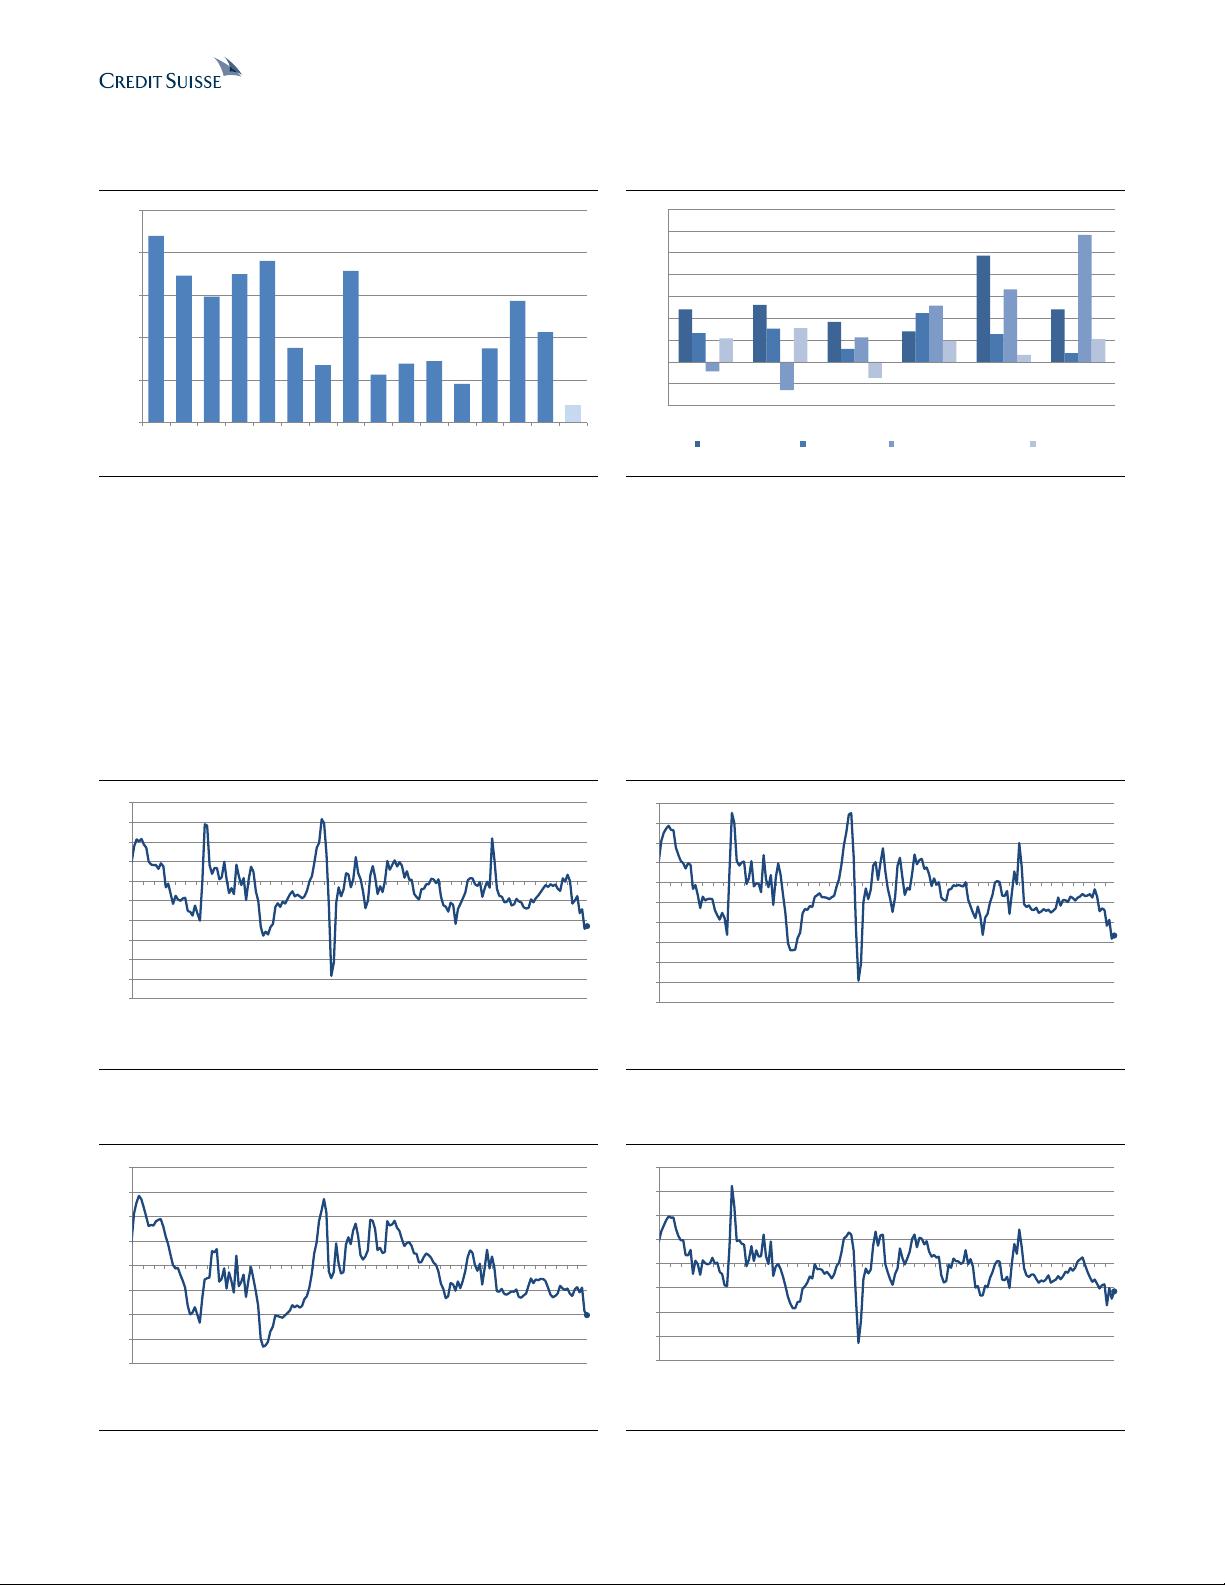
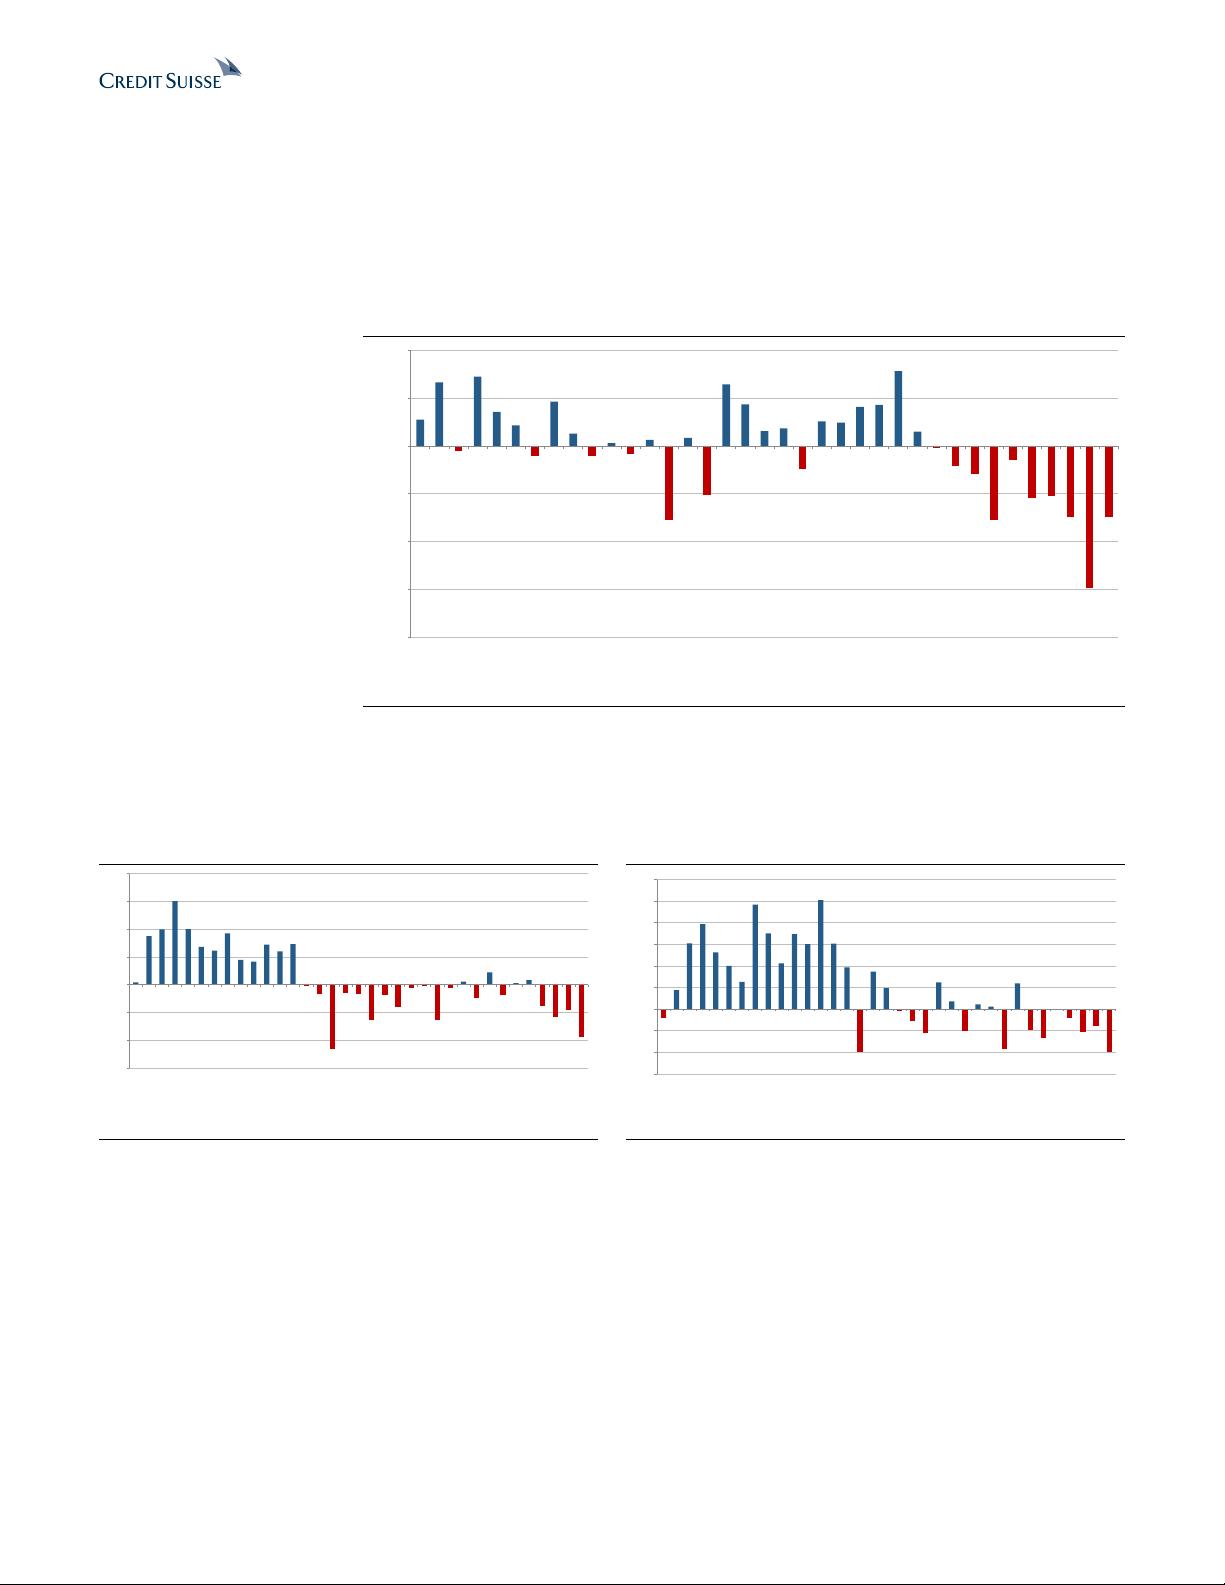
■ Key sector trends: We expect the underlying trends to be fairly subdued
for media names, heading into the February reporting season, with
(1) slowing ad revenues, particularly in the TV market, (2) lower property
listing volumes, especially in Sydney and Melbourne, (3) declines in new
car sales, although we expect the used car market to have held up and (4)
lower growth in job ads, given difficult comps.
■ Preference for NEC and CAR amongst the large caps: In light of the
underlying environment, our preference is for NEC and CAR amongst the
large caps. NEC is exposed to a weaker ad market and lower property
listings through its holding in DHG, but can benefit from the synergies on
offer from the Fairfax merger and improving audience momentum at the
start of CY19. And whilst CAR’s Display segment in particular has been
impacted by weaker new car sales, its core used market has likely fared
better, as illustrated by the company’s ability to put through a price
increase at the start of February.
■ Upgrade HT1 to OUTPERFORM: We upgrade our rating for HT1 to
OUTPERFORM (from Neutral) and even though we have reduced our
earnings estimates, we see upside from current trading levels to our
updated target price of A$1.95/share. The company is exposed to a radio
market which continues to grow and even though it has recently lost
audience share, audiences move in cycles and we see scope for it to
benefit from any recovery.
Figure 1: 1H19 results releases
Company
Results date
REA.AX
8-Feb
NWS.AX
8-Feb
CAR.AX
13-Feb
HT1.AX (FY18)
13-Feb
DHG.AX
15-Feb
SWM.AX
19-Feb
NEC.AX
21-Feb
SEK.AX
27-Feb
Source: Company data
5 February 2019
Australian Media Sector 2
Key sector trends
Metro TV market well down in December half
The Metro TV market has had a tough six months, with industry data and our discussions
with media buyers suggesting the market was down in the mid-single digits in 1H19.
Feedback from industry players suggests that government spend is likely to be a key
swing factor in 2H19, and we expect a level of recovery in 2H (essentially a flat market) to
be supported by spend ahead of the NSW and Federal elections.
Given the data, we have updated our estimates for FY19 Metro FTA TV market growth to
now expect a 2.0% decline (was +0.5% growth)—see Figure 2 for detail.
Beyond FY19, we continue to expect declines in the Metro TV market, linked to the
continued downward trend in linear audiences, with networks needing to focus on the
digital (and catch-up) opportunity to offset the linear audience declines.
We forecast Nine to take share from Seven in 2H19, particularly given the absence of the
Winter Olympics and Commonwealth Games from Seven’s schedule and Nine’s strong
start to the half with the broadcast of the Australian Open and solid ratings for ‘Married at
First Sight’.
Figure 2: Metro FTA TV—market growth
Figure 3: Metro FTA TV—revenue share
-0.4%
-3.9%
-4.5%
-2.8%
1.4%
3.8%
-4.0%
0.2%
-1.5%
-6%
-4%
-2%
0%
2%
4%
6%
1H16 2H16 1H17 2H17 1H18 2H18 1H19e 2H19e 1H20e
1H17 2H17 1H18 2H18 1H19e 2H19e 1H20e
Seven
40.8% 39.5% 36.4% 40.0% 39.5% 39.0% 39.0%
Nine
35.0% 36.5% 40.0% 37.0% 38.5% 39.5% 39.5%
Ten
24.2% 24.0% 23.6% 23.0% 22.0% 21.5% 21.5%
10%
15%
20%
25%
30%
35%
40%
45%
Source: ThinkTV, Credit Suisse estimates
Source: OzTAM, Company Data, Credit Suisse estimates
Figure 4: Metro FTA TV—audience share LTM
Figure 5: All people change in audiences CY18 YTD
10%
15%
20%
25%
30%
35%
40%
45%
50%
Jul-17
Aug-17
Sep-17
Oct-17
Nov-17
Dec-17
Jan-18
Feb-18
Mar-18
Apr-18
May-18
Jun-18
Jul-18
Aug-18
Sep-18
Oct-18
Nov-18
Dec-18
Seven Nine Ten
-2.5%
-8.4%
-11.4%
-6.9%
-6.5%
-6.8%
-7.2%
-6.8%
-14%
-12%
-10%
-8%
-6%
-4%
-2%
0%
Seven Network
Nine Network
Ten Network
Comm FTA
ABC/SBS
Total FTA
Pay TV
Total TV
Source: OzTAM
Source: OzTAM
5 February 2019
Australian Media Sector 3
Radio market growth also slowing but still up YoY
Growth in the radio market is also slowing, but market revenues were still up in the
December half (+1% YoY), showing the resilience of the medium.
Figure 6: Metropolitan Commercial Radio ad revenue growth
7.0%
8.6%
2.7%
-0.3%
-0.6%
-1.9%
2.9%
2.8%
1.2%
5.0%
5.1%
4.6%
7.2%
1.2%
-1.6%
2.3%
5.9%
1.0%
-4%
-2%
0%
2%
4%
6%
8%
10%
1H10 2H10 1H11 2H11 1H12 2H12 1H13 2H13 1H14 2H14 1H15 2H15 1H16 2H16 1H17 2H17 1H18 2H18
Source: Commercial Radio Australia
From a share perspective, SXL has gained audiences in recent surveys, showing a
substantial improvement from 2017, while ARN’s audience share is down YoY following
strong performance in the pcp.
Figure 7: Average audience growth
Figure 8: Weighted commercial share by network
-0.4%
-1.9%
-0.8%
-0.7%
0.4%
-0.7%
0.6%
1.0%
-1.7%
-1.2%
0.6%
1.1%
-0.9%
-0.9%
-1.3%
-1.1%
-0.1%
0.1%
-0.4%
0.7%
0.9%
1.6%
1.4%
0.0%
-2.0%
-1.5%
-1.0%
-0.5%
0.0%
0.5%
1.0%
1.5%
2.0%
1, 2016
2, 2016
3, 2016
4, 2016
5, 2016
6, 2016
7, 2016
8, 2016
1, 2017
2, 2017
3, 2017
4, 2017
5, 2017
6, 2017
7, 2017
8, 2017
1, 2018
2, 2018
3, 2018
4, 2018
5, 2018
6, 2018
7, 2018
8, 2018
16%
18%
20%
22%
24%
26%
28%
30%
1, 2016
2, 2016
3, 2016
4, 2016
5, 2016
6, 2016
7, 2016
8, 2016
1, 2017
2, 2017
3, 2017
4, 2017
5, 2017
6, 2017
7, 2017
8, 2017
1, 2018
2, 2018
3, 2018
4, 2018
5, 2018
6, 2018
7, 2018
8, 2018
SXL ARN MRN NOVA
Source: Commercial Radio Australia, GfK Surveys
Out-of-home highest growth of traditional mediums
While official data from the Outdoor Media Association is yet to be released for the out-of-
home sector, we expect a slowdown in growth for 4Q. Nonetheless, we expect out-of-
home to be the highest growth of the traditional mediums, with forecast growth in the mid-
single digits for the December half.
5 February 2019
Australian Media Sector 4
Figure 9: Australia out-of-home industry revenue
growth
Figure 10: Australia out-of-home industry revenue
growth by segment
22.0%
17.3%
14.8%
17.5%
19.1%
8.8%
6.8%
17.9%
5.6%
6.9%
7.2%
4.5%
8.7%
14.3%
10.7%
2.1%
0.0%
5.0%
10.0%
15.0%
20.0%
25.0%
1Q15
2Q15
3Q15
4Q15
1Q16
2Q16
3Q16
4Q16
1Q17
2Q17
3Q17
4Q17
1Q18
2Q18
3Q18
4Q18e
12%
13%
9%
7%
24%
12%
7%
8%
3%
11%
6%
2%
-2%
-6%
6%
13%
17%
29%
5%
8%
-4%
5%
2%
5%
-10%
-5%
0%
5%
10%
15%
20%
25%
30%
35%
2Q17 3Q17 4Q17 1Q18 2Q18 3Q18
Roadside Billboards Roadside Other Transport (including airports) Retail
Source: Outdoor Media Association
Online classifieds facing more subdued underlying
conditions
Weakness in property listings continues, albeit a slow time of year
The weakness in property listings seen in the later stages of CY18 has continued into the
start of CY19, particularly for Sydney/Melbourne. While we are in a slow time of year for
the housing market, we still expect the property classifieds to face listings headwinds, with
DHG more likely to be impacted given its greater exposure to Sydney/Melbourne.
Figure 11: New listings growth—National
Figure 12: New listings growth—Capital City
-11.5%
-30%
-25%
-20%
-15%
-10%
-5%
0%
5%
10%
15%
20%
Jul-15
Aug-15
Sep-15
Oct-15
Nov-15
Dec-15
Jan-16
Feb-16
Mar-16
Apr-16
May-16
Jun-16
Jul-16
Aug-16
Sep-16
Oct-16
Nov-16
Dec-16
Jan-17
Feb-17
Mar-17
Apr-17
May-17
Jun-17
Jul-17
Aug-17
Sep-17
Oct-17
Nov-17
Dec-17
Jan-18
Feb-18
Mar-18
Apr-18
May-18
Jun-18
Jul-18
Aug-18
Sep-18
Oct-18
Nov-18
Dec-18
Jan-19
-13.2%
-30%
-25%
-20%
-15%
-10%
-5%
0%
5%
10%
15%
20%
Jul-15
Aug-15
Sep-15
Oct-15
Nov-15
Dec-15
Jan-16
Feb-16
Mar-16
Apr-16
May-16
Jun-16
Jul-16
Aug-16
Sep-16
Oct-16
Nov-16
Dec-16
Jan-17
Feb-17
Mar-17
Apr-17
May-17
Jun-17
Jul-17
Aug-17
Sep-17
Oct-17
Nov-17
Dec-17
Jan-18
Feb-18
Mar-18
Apr-18
May-18
Jun-18
Jul-18
Aug-18
Sep-18
Oct-18
Nov-18
Dec-18
Jan-19
Source: CoreLogic
Source: CoreLogic
Figure 13: New listings growth—Sydney
Figure 14: New listings growth—Melbourne
-20.2%
-40%
-30%
-20%
-10%
0%
10%
20%
30%
40%
Jul-15
Aug-15
Sep-15
Oct-15
Nov-15
Dec-15
Jan-16
Feb-16
Mar-16
Apr-16
May-16
Jun-16
Jul-16
Aug-16
Sep-16
Oct-16
Nov-16
Dec-16
Jan-17
Feb-17
Mar-17
Apr-17
May-17
Jun-17
Jul-17
Aug-17
Sep-17
Oct-17
Nov-17
Dec-17
Jan-18
Feb-18
Mar-18
Apr-18
May-18
Jun-18
Jul-18
Aug-18
Sep-18
Oct-18
Nov-18
Dec-18
Jan-19
-11.5%
-40%
-30%
-20%
-10%
0%
10%
20%
30%
40%
Jul-15
Aug-15
Sep-15
Oct-15
Nov-15
Dec-15
Jan-16
Feb-16
Mar-16
Apr-16
May-16
Jun-16
Jul-16
Aug-16
Sep-16
Oct-16
Nov-16
Dec-16
Jan-17
Feb-17
Mar-17
Apr-17
May-17
Jun-17
Jul-17
Aug-17
Sep-17
Oct-17
Nov-17
Dec-17
Jan-18
Feb-18
Mar-18
Apr-18
May-18
Jun-18
Jul-18
Aug-18
Sep-18
Oct-18
Nov-18
Dec-18
Jan-19
Source: CoreLogic
Source: CoreLogic
5 February 2019
Australian Media Sector 5
New car sales and finance also down
New car sales in the Australian market have accelerated their decline, and while we
expect CAR’s Dealer Used segment to be somewhat insulated from this trend (as
illustrated by the recent price increase, with used price per lead increasing from $48 to $50
at the start of February), we expect the Display segment to suffer (with CSe for -10%
revenue growth for Display in 1H19).
Figure 15: Monthly new car sales growth—Australia
2.7%
6.7%
-0.5%
7.2%
3.6%
2.2%
-1.1%
4.6%
1.3%
-1.0%
0.3%
-0.9%
0.6%
-7.7%
0.9%
-5.1%
6.4%
4.4%
1.6%
1.8%
-2.4%
2.6%
2.5%
4.1%
4.3%
7.8%
1.5%
-0.2%
-2.1%
-2.9%
-7.8%
-1.5%
-5.4%
-5.3%
-7.4%
-14.9%
-7.4%
-20%
-15%
-10%
-5%
0%
5%
10%
Jan-2016
Feb-2016
Mar-2016
Apr-2016
May-2016
Jun-2016
Jul-2016
Aug-2016
Sep-2016
Oct-2016
Nov-2016
Dec-2016
Jan-2017
Feb-2017
Mar-2017
Apr-2017
May-2017
Jun-2017
Jul-2017
Aug-2017
Sep-2017
Oct-2017
Nov-2017
Dec-2017
Jan-2018
Feb-2018
Mar-2018
Apr-2018
May-2018
Jun-2018
Jul-2018
Aug-2018
Sep-2018
Oct-2018
Nov-2018
Dec-2018
Jan-2019
Source: FCAI
The declines in auto finance are consistent with December’s write-down of Stratton, and
management guidance for Stratton’s contribution to NPAT to decline to ~$1.0mn in FY19
(was $2.0mn in FY18).
Figure 16: Monthly new motor car finance growth
Figure 17: Monthly used motor car finance growth
0.8%
17.4%
19.8%
30.1%
19.9%
13.6%
12.2%
18.4%
8.9%
8.2%
14.4%
11.9%
14.5%
-0.3%
-3.5%
-23.2%
-3.2%
-3.3%
-12.9%
-3.9%
-8.2%
-1.2%
-0.2%
-12.6%
-1.2%
1.0%
-4.9%
4.4%
-3.6%
0.5%
1.6%
-7.6%
-11.8%
-9.3%
-18.8%
-30%
-20%
-10%
0%
10%
20%
30%
40%
Jan-2016
Feb-2016
Mar-2016
Apr-2016
May-2016
Jun-2016
Jul-2016
Aug-2016
Sep-2016
Oct-2016
Nov-2016
Dec-2016
Jan-2017
Feb-2017
Mar-2017
Apr-2017
May-2017
Jun-2017
Jul-2017
Aug-2017
Sep-2017
Oct-2017
Nov-2017
Dec-2017
Jan-2018
Feb-2018
Mar-2018
Apr-2018
May-2018
Jun-2018
Jul-2018
Aug-2018
Sep-2018
Oct-2018
Nov-2018
-2.0%
4.4%
15.2%
19.7%
13.2%
10.0%
6.3%
24.2%
17.5%
10.6%
17.3%
15.0%
25.2%
15.1%
9.6%
-9.9%
8.7%
4.8%
-0.3%
-2.7%
-5.4%
6.2%
1.8%
-5.0%
1.1%
0.6%
-9.3%
5.9%
-4.9%
-6.7%
-0.3%
-2.1%
-5.2%
-3.9%
-9.9%
-15%
-10%
-5%
0%
5%
10%
15%
20%
25%
30%
Jan-2016
Feb-2016
Mar-2016
Apr-2016
May-2016
Jun-2016
Jul-2016
Aug-2016
Sep-2016
Oct-2016
Nov-2016
Dec-2016
Jan-2017
Feb-2017
Mar-2017
Apr-2017
May-2017
Jun-2017
Jul-2017
Aug-2017
Sep-2017
Oct-2017
Nov-2017
Dec-2017
Jan-2018
Feb-2018
Mar-2018
Apr-2018
May-2018
Jun-2018
Jul-2018
Aug-2018
Sep-2018
Oct-2018
Nov-2018
Source: ABS
Source: ABS
Job listings growth impacted by difficult comps
Job listings have not been immune from the broader trends, with the Seek New Jobs index
marginally down for the month of December. While this has been driven by difficult comps,
it reinforces the importance for mix shift for SEK domestically as the company focuses on
higher take-up of its Premium product.
剩余37页未读,继续阅读
资源评论
supeerzdj
- 粉丝: 11
- 资源: 6184
上传资源 快速赚钱
- 我的内容管理 展开
- 我的资源 快来上传第一个资源
- 我的收益 登录查看自己的收益
- 我的积分 登录查看自己的积分
- 我的C币 登录后查看C币余额
- 我的收藏
- 我的下载
- 下载帮助
安全验证
文档复制为VIP权益,开通VIP直接复制
信息提交成功