没有合适的资源?快使用搜索试试~ 我知道了~
瑞信-亚太地区-公用事业行业-澳大利亚公用事业:拿回权力-72-32页.pdf
需积分: 0 0 下载量 142 浏览量
2023-07-26
12:00:44
上传
评论
收藏 1.26MB PDF 举报
温馨提示
试读
32页
瑞信-亚太地区-公用事业行业-澳大利亚公用事业:拿回权力-72-32页.pdf
资源推荐
资源详情
资源评论
DISCLOSURE APPENDIX AT THE BACK OF THIS REPORT CONTAINS IMPORTANT DISCLOSURES, ANALYST
CERTIFICATIONS, LEGAL ENTITY DISCLOSURE AND THE STATUS OF NON-US ANALYSTS. US Disclosure: Credit
Suisse does and seeks to do business with companies covered in its research reports. As a result, investors should be aware
that the Firm may have a conflict of interest that could affect the objectivity of this report. Investors should consider this report
as only a single factor in making their investment decision.
2 July 2019
Asia Pacific/Australia
Equity Research
Multi Utilities
Australian Utilities
SECTOR REVIEW
Research Analysts
Peter Wilson
61 2 8205 4107
Chloe Lim
61 2 8205 4739
Take the power back; Upgrade ORG/AGL
We upgrade the ratings for both AGL and Origin Energy. Our prior premise
was that forecast decreases in wholesale prices would be passed-through to
customers and earnings FY19-22F. However, wholesale electricity prices
remain high, and July retail repricing introduces doubt over the pass-through.
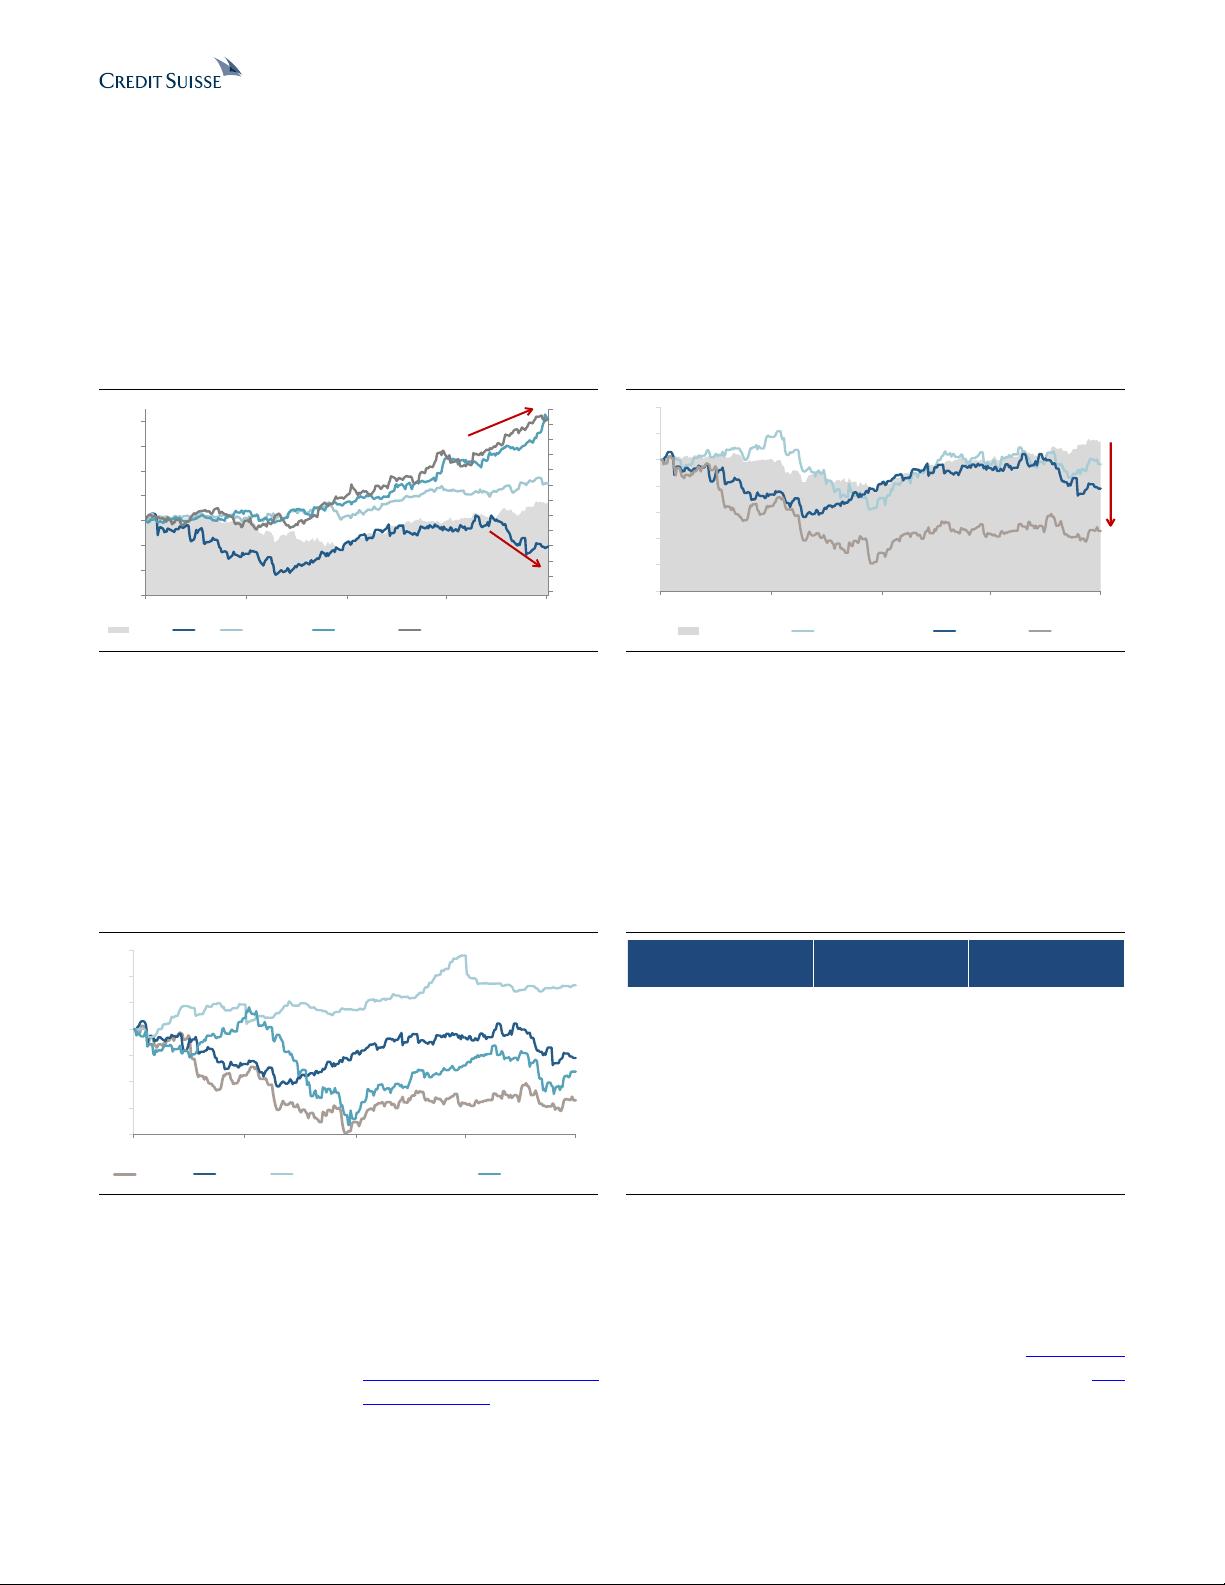
■ Upgrade AGL and Origin: both have underperformed the market,
peers, and key earnings input. Whilst we continue to see downside to
electricity prices from renewables and government intervention, a 12M rally
shows a subdued impact so far. AGL and Origin have underperformed this
key earnings input, underperformed oil (ORG), and underperformed the
ASX200 even as bond yields have pushed peer valuations higher.
■ July retail resets show repricing power retained under DMO,
introduces doubt on pass-through of price downside. The first reset
coinciding with the introduction of the DMO illustrates that retailers have
retained the freedom to reprice their back book, introducing doubt that
wholesale price falls will be passed through in full. For existing customers
on discounts, we estimate that AGL/ORG have retained A$30-55mn in
costs; in ORG's case, it has redirected these savings to other customers.
Further, best offers from the large retailers are now higher than in Apr/May,
indicating an easing of competition, although we expect this to be volatile.
■ Risks. A fall in wholesale electricity futures remains the largest risk, with
soft spot LNG prices and government intervention the contributing factors.
■ Upgrade Origin Energy (ORG.AX) to OUTPERFORM, target price
A$8.50/sh (from A$7.55/sh). Origin has underperformed AGL and E&P
peers; it has a superior earnings, FCF and dividend profile to AGL; and we
expect the FY19 results to be a positive catalyst, with a strong Energy
Markets EBITDA and an update on the ongoing dividend policy.
■ Upgrade AGL Energy (AGL.AX) to NEUTRAL, target price A$19.20/sh
(from A$18.30/sh). Upgrade based on relative underperformance, with
resilient electricity futures and July retail pricing resets diminishing
wholesale price downside.
2 July 2019
Australian Utilities 2
Summary: upgrade ratings
AGL and Origin have underperformed the market and peers
AGL and Origin have underperformed on both 12-month and YTD basis. Figure 1 shows
AGL's 12-month performance vs the ASX200, the MSCI Global Utilities Index and the
average of the New Zealand integrated utilities which we consider to be the most similar in
terms of market structure ('Gentailers'). Figure 2 shows Origin vs the ASX200, AGL, and
the average of the Australian large cap E&P peers.
Figure 1: AGL vs ASX200 vs Global peers (indexed)
Figure 2: ORG vs ASX200 vs local peers (indexed)
1.2%
1.4%
1.6%
1.8%
2.0%
2.2%
2.4%
2.6%
2.8%
3.0%
3.2%
3.4%
3.6%
70
80
90
100
110
120
130
140
Jun-18 Sep-18 Dec-18 Mar-19 Jun-19
ASX200 AGL MSCI utilities NZ peer avg 10yr Aus bond yield (RHS, inverted)
50
60
70
80
90
100
110
120
Jun-18 Sep-18 Dec-18 Mar-19 Jun-19
ASX200 Aus E&P Avg AGL ORG
Source: I/B/E/S, Credit Suisse estimates
AGL and Origin have underperformed their key inputs to earnings
The underperformance of AGL and Origin contrasts to the change in their most important
earnings inputs, in particular, versus the change in wholesale electricity futures. The
sensitivity of both to these inputs is shown in Figure 4.
Electricity futures have rallied consistently since the middle of 2018 due to persistently
high spot price outcomes which were caused by supply constraints for coal and hydro, a
tight gas market, and a slower-than-expected increase in output from new wind and solar.
Figure 3: AGL/ORG vs Electricity futures vs Brent
Figure 4: Key input sensitivities
60
70
80
90
100
110
120
130
Jun-18 Sep-18 Dec-18 Mar-19 Jun-19
ORG.AX AGL.AX Weighted Electricity Price Index Brent (US$/bbl)
FY22 EPS DCF Value FY22 EPS DCF Value
1% change to Electricity +/- 1.8% +/- 1.4% +/- 1.0% +/- 0.9%
1% change to Brent +/- 1.4% +/- 1.0%
AGL
ORG
Source: BLOOMBERG PROFESSIONAL™ service, Credit Suisse estimates
Source: I/B/E/S, the BLOOMBERG PROFESSIONAL™ service, Credit Suisse estimates
We remain of the view that the LT wholesale electricity price is lower than 12M
futures, but futures rally limits 1-2 year downside
We have not changed our view that the long-term wholesale electricity price will revert to
$60-80/MWh, from the current FY20 prevailing forward price of $90-110/MWh. The bottom
end of that range is possible under a scenario of policy induced oversupply (Talkin' bout
my generation: Big Brother), or a scenario of lower global benchmark coal prices (The
coal'd shoulder)
However, we must concede that the impact of wind and solar has to date been subdued,
with other factors coinciding to tighten the market further. This lends merit to the argument
2 July 2019
Australian Utilities 3
that the forward curve may continue to push out as it has YTD limiting downside to
modelled earnings. Realised prices will reflect a 2-3 year rolling average; we model a
reduction from ~$80/MWh in FY19/20 to $70/MWh by FY22, similar to the prevailing
forward curve.
Retained post-DMO repricing freedom introduces doubt on pass-
through of lower wholesale prices
Retailers retain freedom to reprice back-book, retain cost reduction in July resets
We are increasingly confident that the long-term impact of the new DMO/VDO regulations
that apply to retail prices will be less than feared. In particular, we see the watering down
of the final version of the rules as significant, as it limited the regulated reference price to
apply to only a small minority (~10%) of customers that were on standing offers. Because
of this, the reference price amounts to a comparison rate (as Origin has long lobbied for),
rather than a regulated price cap as originally intended; albeit with a significant transitional
impact (A$110mn for Origin) in FY20.
Historically, a significant source of profitability has been the freedom to reprice the back
book of customers, the so-called 'loyalty tax.' As discussed below, the decision by AGL
and Origin to keep prices flat on 1 July for existing customers on discounted market offers
despite a modest reduction in their costs shows that this repricing freedom remains; albeit
in Origin's case, it has used this freedom to reward long-term high value customers at the
expense of those customers on discounted market offers, inverting the loyalty tax.
Aside from retail margins, the implication is that this repricing behaviour introduces doubt
as to whether a fall in wholesale electricity and renewable certificate prices would be
passed on in full. Scrutiny on prices remains high, with the ACCC required to release a
report every six months on the impact of the DMO, ensuring that 'no customer is worse
off'. However, we contend that the heterogeneity of the retail customer base provides
some cover for retailers.
FY19 to be nadir for retail profits
We expect retail gross margins to bottom in FY20 due to the transitional impact of the
DMO/VDO, before recovering in subsequent years as AGL and Origin reassert control of
margins following two years of forced repricing.
EBITDA net of operating costs is expected to bottom a year earlier in FY19, with digitisation
and an abatement of churn and repricing activity expected to allow for AGL and Origin to
start to deliver on cost out targets. We expect cost reductions to translate to EBITDA, given
the incumbents have faced a disproportionate increase in activity in recent years.
Figure 5: AGL consumer EBITDA
Figure 6: ORG consumer EBITDA
-600
-400
-200
0
200
400
600
800
1,000
FY17 FY18 FY19F FY20F FY21F FY22F
A$mn
Consumer Opex
Consumer Gas GM
Consumer Electricity
GM
Consumer EBITDA
-800
-600
-400
-200
0
200
400
600
800
1,000
1,200
1,400
FY18 FY19F FY20F FY21F FY22F
A$mn
Consumer Opex
Consumer Gas GM
Consumer Electricity
GM
Consumer EBITDA
Source: Company data, Credit Suisse estimates
Source: Credit Suisse estimates
2 July 2019
Australian Utilities 4
Upgrade AGL/Origin, preference for Origin
Our preference for Origin over AGL is based on the following points.
■ ORG: FY19 results in August, expect strong result at top end of guidance,
positive dividend catalyst. we forecast Origin to report FY19 Energy Markets
EBITDA of A$1,595mn, at the top end of A$1,500-1,600mn guidance, driven by strong
Eraring generation output, and NPAT of A$1,131mn, 3.1% above consensus. Further,
the company has committed to providing detail on its ongoing dividend policy; we
forecast 40 cps in FY20, 16% above consensus forecasts.
■ ORG: Superior earnings profile, Energy Markets decrease offset by APLNG. To
be clear, our modelled FY19-22 decrease in utilities earnings is similar for AGL and
Origin. However, a roughly flat EBITDA profile and declining ITDA from Origin's LNG
segment substantially offsets the Energy Markets decline.
As such, we forecast a 3% cumulative earnings decline for Origin FY19-22, compared
to a 22% decline for AGL over the same period.
■ ORG: Higher exposure to retail, lower downside risk from wholesale electricity:
Proportionally, Origin's Energy Markets business is more exposed to retail—which we
expect to bottom in FY19 net of costs—and less exposed to wholesale prices which
remain above our estimated long-term equilibrium price. This can be seen in Figure 4,
with Origin's value sensitivity to a change in wholesale electricity prices approximately
35% lower than AGL's. Looking at it a difference way, Origin does not report retail
(consumer) gross margins separately, but we estimate that retail gas and electricity
contributes 20% of segment EBITDA net of costs, compared to 10% for AGL. In both
cases, this share has fallen 10% or more.
■ ORG: Strong FCF position with increasing dividend profile, dividend catalyst
expected at FY19 results in August. Strong free cash flow and the associated
deleveraging (est ~A$1bn per annum pre growth capex) has long been a key
investment driver for Origin. With forward debt levels now within Origin's target 2.0-2.5x
ND/EBITDA band, it has recommenced paying a dividend in FY19, and has committed
to providing guidance on its long-term approach to dividends at the FY19 results. We
expect a doubling of ordinary dividends in FY20, with a stated intention to return capital
in later years as gearing reduces further. We estimate that our modelled 40cps FY20
dividend can be covered by cash flows in a US$40/bbl scenario (i.e., assuming no
distributions from APLNG aside from MRCPS coupon payments).
− AGL: Flat ordinary dividends, with biennial on-market buybacks. For AGL, we
expect ordinary dividends to be flat, reflecting declining FCF. The volatility of FCF in
Figure 7 is a result of large working capital movements (mostly margin lodged
against hedges). While we expect AGL to remain conservative with its balance
sheet given its earnings profile, and the now declared intention post-Vocus to retain
optionality for M&A; in the absence of such M&A we estimate that AGL could
undertake on-market buybacks of ~A$600mn (5% of equity) once every two years.
2 July 2019
Australian Utilities 5
Figure 7: AGL—FCF vs dividend yield vs debt
Figure 8: ORG—FCF vs dividend yield vs debt
0.0x
0.5x
1.0x
1.5x
2.0x
2.5x
3.0x
3.5x
4.0x
0.0%
2.0%
4.0%
6.0%
8.0%
10.0%
12.0%
14.0%
FY18 FY19F FY20F FY21F FY22F
ND/EBITDA (RHS) Div Yield OFCF Yield
0.0x
1.0x
2.0x
3.0x
4.0x
0.0%
5.0%
10.0%
15.0%
FY18 FY19F FY20F FY21F FY22F
ND/EBITDA (Adj, RHS) OFCF Yield
OFCF yield inc APLNG debt repayment Div Yield
Source: Company data, Credit Suisse estimates
■ ORG: Possible growth options in Beetaloo, APLNG production increase. Growth
investment opportunities for both AGL and Origin in the domestic utilities business
appear limited (<A$300mn project size), due to a lack of policy clarity and
interventionist intent at a state and federal government level. AGL's short-lived bid for
Vocus (VOC.AX) was arguably confirmation of this.
However, Origin (through its Integrated Gas segment) does have two genuine growth
possibilities: a large but early/speculative domestic gas project in Beetaloo, and potential
to lift APLNG LNG production to nameplate and above as the LNG market tightens
2022+. We carry Beetaloo at A$300mn, although the future value could be three times
that or more (A$0.35/sh upside). For APLNG, we increase our forecast from 9.0mt to
9.9mt from FY25, which adds $350mn or $0.20/sh to our Origin valuation, net of capex
and assuming that 60% of the additional upstream production comes from the contingent
QCLNG purchase agreement signed November 2018. The third-party gas supply
reduces the earnings and value uplift; with reduced profitability accounting for obvious
risks to this scenario such as export restrictions and JV interests.
剩余31页未读,继续阅读
资源评论
qq_41146932
- 粉丝: 8
- 资源: 6308
上传资源 快速赚钱
- 我的内容管理 展开
- 我的资源 快来上传第一个资源
- 我的收益 登录查看自己的收益
- 我的积分 登录查看自己的积分
- 我的C币 登录后查看C币余额
- 我的收藏
- 我的下载
- 下载帮助
安全验证
文档复制为VIP权益,开通VIP直接复制
信息提交成功