没有合适的资源?快使用搜索试试~ 我知道了~
J.P. 摩根-中国电力设备行业的关键选择-中国能源设备行业-2018.8.13-47页.pdf
需积分: 0 0 下载量 176 浏览量
2023-09-03
04:16:58
上传
评论
收藏 3.52MB PDF 举报
温馨提示
试读
49页
J.P. 摩根-中国电力设备行业的关键选择-中国能源设备行业-2018.8.13-47页
资源推荐
资源详情
资源评论
www.jpmorganmarkets.com
Asia Pacific Equity Research
13 August 2018
Equity Ratings and Price Targets
Mkt Cap
Price
Rating
Price Target
Company
Ticker
($ mn)
CCY
Price
Cur
Prev
Cur
Prev
Shanghai Electric Group Company Limited
-
H
2727 HK
4,839.68
HKD
2.58
N
—
2.50
—
Dongfang Electric Corporation Limited
-
H
1072 HK
1,874.19
HKD
4.76
N
—
4.80
—
Source: Company data, Bloomberg, J.P. Morgan estimates. n/c = no change. All prices as of 13 Aug 18.
China Power Equipment
Bigger, Greener & More Reliable: Key Picks within
China's Power equipment sector (Ex A-shares)
China
Infrastructure & Industrial
Patrick Xu, CFA
AC
(852) 2800 8577
patrick.n.xu@jpmorgan.com
Bloomberg JPMA PXU <GO>
Karen Li, CFA
(852) 2800-8589
karen.yy.li@jpmorgan.com
Calvin C Wong, CFA
(852) 2800 8502
calvin.wong@jpmorgan.com
J.P. Morgan Securities (Asia Pacific) Limited
See page 45 for analyst certification and important disclosures, including non
-
US analyst disclosures.
J.P. Morgan does and seeks to do business with companies covered in its resea
rch reports. As a result, investors should be aware that
the firm may have a conflict of interest that could affect the objectivity of this report. Investors should consider this rep
ort as only a single
factor in making their investment decision.
We initiate coverage of the power equipment sector with a preference for
Transmission & Distribution (T&D) equipment suppliers over generation
equipment suppliers. We see growth in grid investments accelerate to 14-15%
growth p.a. in 2019-20 from -1% in 2017 driven by China’s need of a bigger,
greener and reliable power grid, while generation investments could decline.
Bigger: The State Grid needs to add >150,000km of transmission lines p.a.
in 2019-20 vs the average of 48,000km a year in 2016-18 to reach its length
target by end 2020. We think the target seems stretched, but do expect
additions of 50/61,000km transmission lines in 2019/20 to narrow the gap.
Greener: 6.7% of the power generated in 2017 was lost over transmission
vs the target of <6.0% by 2020. The network needs upgrading towards
higher voltages to help achieve the goal. We estimate this to drive the unit
construction cost to RMB6.7mn/km in 2020 from RMB4.4mn/km in 2017.
More reliable: Households in China had on average 15 hours’ of blackout
in 2017 vs the average of 1 hour of G7 countries. We forecast 7% CAGR of
investments on the distribution networks to raise the reliability of the grid.
Stock picks: We are Neutral on the H-shares of Shanghai Electric and
Dongfang Electric due to declining demand for thermal power equipment.
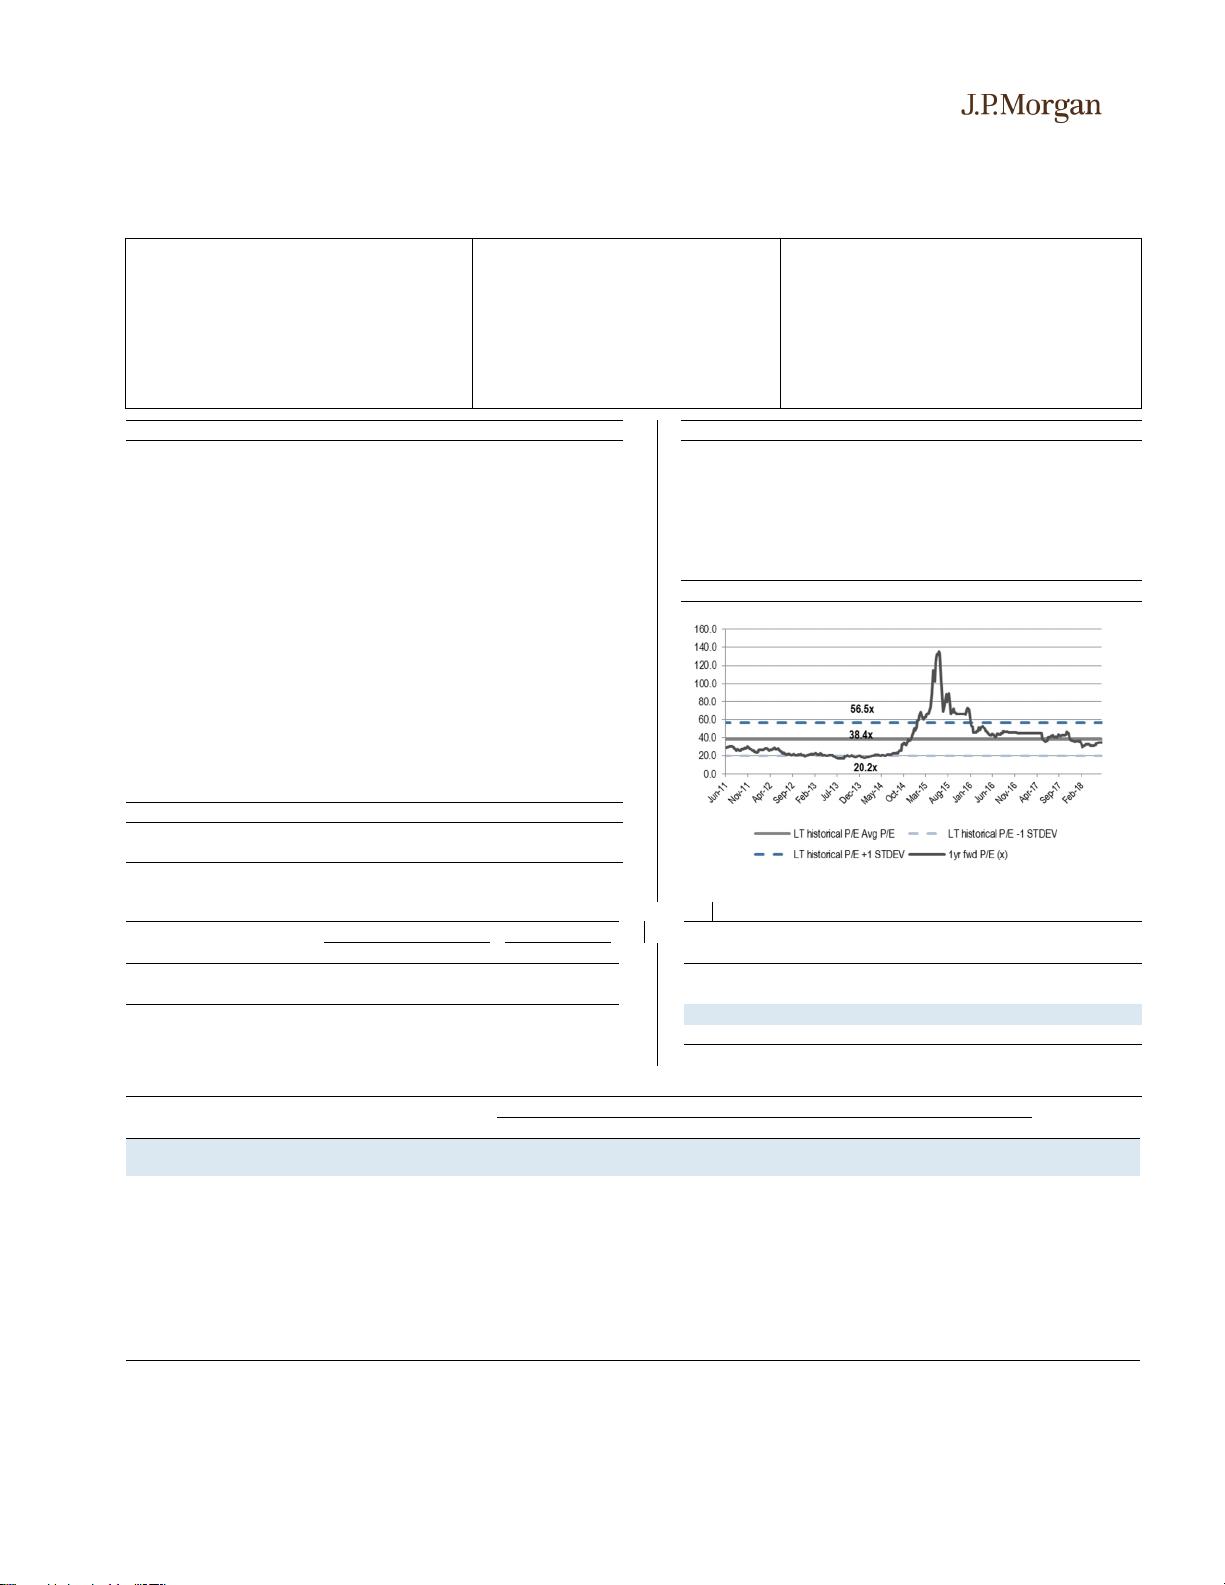
Valuation, catalysts and risks: Our price targets are based on DCF
analysis, cross-checked against P/E vs EPS growth. Our OW-rated stocks
trade below or in line with peers’ average P/E with growth premium.
Positive surprises from grid investments or power consumption could be
catalysts for the sector. The key risk is a break-up of the State Grid that
could disrupt the supply chain.
每日免费获取报告
1、每日微信群内分享5+最新重磅报告;
2、每日分享当日华尔街日报、金融时报;
3、每周分享经济学人
4、每月汇总500+份当月重磅报告
(增值服务)
扫一扫二维码
关注公号
回复:研究报告
加入“起点财经”微信群。
2
Asia Pacific
Equity Research
13 August 2018
Patrick Xu, CFA
(852) 2800 8577
patrick.n.xu@jpmorgan.com
Shanghai Electric Group Company Limited
- H
Elevator is the largest earnings contributor
We initiate coverage of Shanghai Electric-H with a Neutral rating and DCF-derived
Jun-19 PT of HK$2.50, implying 3% downside potential. We also initiate coverage
of Shanghai Electric-A with an Underweight rating and DCF-derived Aug-19 PT of
RMB2.20, implying 58% downside potential. The company is an industrial
conglomerate engaged in the manufacturing of elevators, power equipment and
electromechanical components.
Company background: The company was incorporated in 1985 in Shanghai
consolidating then Shanghai Motor Factory, Shanghai Steam Turbine Factory,
Shanghai Boiler Factory, Shanghai Power Station Auxiliary Machinery Factory
and etc. The stock was listed in HK through IPO in 2005 and later in Shanghai
through a reverse takeover in 2008. The company is an SOE, with no equity
incentive for the management.
Earnings drivers: Elevator was the largest earnings contributor in FY17 and
accounted for 25% of the gross profit. We expect the earnings to be flattish in
FY18-20E with earnings growth from elevator service, automation products and
wind turbines negated by earnings declines from thermal power equipment. The
gross profit contribution from thermal power equipment should decline to 10% in
FY20E from 19% in FY17, based on our estimates.
Valuation: The H/A-share trades at 12/36x FY19E P/E vs the Chinese peers’
average of 18x. We think the H-share looks reasonably valued and the A-share
seems overvalued.
Catalysts & risks: The main catalysts can be 1) higher-than-expected demand
for elevators or thermal power equipment, and 2) mergers among the main
suppliers of power equipment. The main risks are 1) lower-than-expected demand
for elevators or power equipment, and 2) the company overpays for acquisitions.
Company Data
Shares O/S (mn)
14,725
Market Cap (Rmb
mn)
33,135
Market Cap ($ mn)
4,840
Price (HK$)
2.58
Date Of Price
13
-
Aug
-
18
Free Float(%)
-
3M
-
Avg daily vol (mn)
10.96
3M
-
Avg daily val (HK$ mn)
30.70
3M
-
Avg daily val ($ mn)
3.9
HSCEI
1,0943.08
Exchange Rate
7.85
Fiscal Year End
Dec
Price Target End Date
30
-
Jun
-
19
Shanghai Electric Group Company Limited - H (Reuters: 2727.HK, Bloomberg: 2727 HK)
Rmb in mn, year
-
end Dec
FY16A
FY17A
FY18E
FY19E
FY20E
Revenue (Rmb mn)
79,078
79,544
81,533
82,449
84,862
Net Profit (Rmb mn)
2,060
2,660
2,627
2,590
2,656
EPS (Rmb)
0.15
0.18
0.18
0.18
0.18
DPS (Rmb)
0.00
0.09
0.08
0.08
0.09
Revenue growth (%)
1.4%
0.6%
2.5%
1.1%
2.9%
EPS growth (%)
(8.7%)
23.0%
(1.2%)
(1.4%)
2.6%
ROCE
6.7%
7.2%
6.3%
6.1%
6.0%
ROE
5.0%
5.3%
4.7%
4.5%
4.5%
P/E (x)
15.3
12.5
12.6
12.8
12.5
P/BV (x)
0.7
0.6
0.6
0.6
0.6
Dividend Yield
0.0%
4.0%
3.8%
3.7%
3.8%
Source: Company data, Bloomberg, J.P. Morgan estimates.
Neutral
2727.HK,2727 HK
Price: HK$2.58
Price Target: HK$2.50
China
Infrastructure & Industrial
Patrick Xu, CFA
AC
(852) 2800 8577
patrick.n.xu@jpmorgan.com
Bloomberg JPMA PXU <GO>
J.P. Morgan Securities (Asia Pacific) Limited
YTD 1m 3m 12m
Abs -19.9% -2.3% -9.5% -27.1%
Rel -13.4% -3.4% 1.1% -28.6%
2.5
3.0
3.5
4.0
4.5
5.0
HK$
Aug-17 Nov-17 Feb-18 May-18 Aug-18
Price Performance
2727.HK share price (HK$)
HSCEI (rebased)
3
Asia Pacific
Equity Research
13 August 2018
Patrick Xu, CFA
(852) 2800 8577
patrick.n.xu@jpmorgan.com
Key catalysts for the stock price: Upside risks to our view: Downside risks to our view:
1.
Further industry consolidation through M&As;
2. Relaxation of purchasing restrictions on
property;
3. Trade frictions that discourage imports of
automation products.
1. Stronger
-
than
-
expected demand for
power generators;
2. Stronger-than-expected demand for
elevators;
3. Higher-than-expected earnings from JVs
offering automation products.
1. Weaker
-
than
-
expected demand for power
generators;
2. Weaker-than-expected demand for elevators;
3. Lower-than-expected earnings from JVs offering
automation products.
Key financial metrics
FY17A
FY18E
FY19E
FY20E
Valuation and price target basis
Revenues (LC) 79,544 81,533 82,449 84,862
The stock trades 13x FY19E P/E vs Chinese peers' average of 18x. Our TP
is derived from DCF valuation and implies 13x FY19E P/E.
Revenue growth (%)
1%
3%
1%
3%
EBITDA (LC) 8,139 8,964 9,069 9,271
EBITDA margin (%)
10%
11%
11%
11%
Tax rate (%) 9% 14% 14% 14%
Net profit (LC) 2,660 2,627 2,590 2,656
EPS (LC) 0.19 0.18 0.18 0.18
EPS growth (%) 22% -6% -1% 3% P/E chart
DPS (LC) 0.09 0.08 0.08 0.09
BVPS (LC) 3.77 3.86 3.95 4.05
Operating cash flow (LC mn) (7,525) 1,986 2,795 2,225
Free cash flow (LC mn) (11,852) (990) 196 (269)
Interest cover (X)
16.0
13.6
12.8
12.3
Net margin (%) 3.3% 3.2% 3.1% 3.1%
Sales/assets (X)
0.42
0.40
0.40
0.40
Debt/equity (%) 28% 27% 28% 27%
Net debt/equity (%)
-
53%
-
49%
-
24%
-
21%
ROE (%) 5.3% 4.7% 4.5% 4.5%
Key model assumptions
FY17A
FY18E
FY19E
FY20E
Revenue growth (%) 0.6% 2.5% 1.1% 2.9%
Gross profit margin (%)
22.8%
24.0%
23.9%
23.7%
Source: Bloomberg, Company and J.P. Morgan estimates. Source: Bloomberg, Company and J.P. Morgan estimates.
Sensitivity analysis
EBITDA
EPS
JPMe vs. consensus, change in estimates
Sensitivity to
FY18E
FY19E
FY18E
FY19E
EPS
FY18E
FY19E
1ppt chg in revenue growth -3% -6% -4% -10%
1ppt chg in GPM
-
3%
-
6%
-
4%
-
10%
JPMe
0.1
8
0.18
% chg N/A N/A
Consensus
0.17
0.17
Source: Bloomberg, Company and J.P. Morgan estimates. Source: Bloomberg, Company and J.P. Morgan estimates.
Comparative
metrics
CMP Mkt Cap P/E PEG P/BV YTD
LC
$Mn
FY18E
FY19E
FY18E
FY19E
FY18E
FY19E
Stock perf.
Shanghai
Electric-H
2.6 10,152 12.6 12.8 23.0 3.8 0.0 0.0 -19.9
Nari
Technology
16 10,468 18.6 16.2 1.3 2.0 3.1 2.8 -14.4
Hongfa
Technology
21.4 2,330 18.6 16.2 1.3 2.0 3.1 2.8 -27.4
Dongfang
Electric-H
4.8 3,148 17.1 17.4 6.9 0.8 0.6 0.5 -24.6
TBEA 6.9 3,718 13.2 11.1 0.5 0.8 0.8 0.8 -30.8
General
Electric
192.6 57,055 17.3 15.5 13.3 12.2 4.4 3.8 -5.3
Siemens
111
107,909
16.4
14.6
13.5
10.9
1.9
1.8
-
4.7
Source: Bloomberg, Company and J.P. Morgan estimates. Prices are as of 10/08/2018.
4
Asia Pacific
Equity Research
13 August 2018
Patrick Xu, CFA
(852) 2800 8577
patrick.n.xu@jpmorgan.com
Corporate history and major shareholders
The company was incorporated in 2004 with its main operating assets injected by the
majority shareholder - Shanghai Electric (Group) Corporation. Shanghai Electric
(Group) Corporation in turn was incorporated in 1985 consolidating Shanghai Motor
Factory, Shanghai Steam Turbine Factory, Shanghai Boiler Factory, Shanghai Power
Station Auxiliary Machinery Factory and etc. The company made the IPO in HK in
2005 and was listed in Shanghai through an RTO in 2008.
Figure 1: Company key events
Source: Company data.
The company is an SOE, with Shanghai Electric (Group) Corporation as the direct
controlling shareholder (61%) and Shanghai SASAC as the ultimate controlling
shareholder (64%) as of end FY17.
Figure 2: Shareholding structure, Shanghai Electric
Source: Company data.
The majority
shareholder of the
company, Shanghai
Electric Group, was
incorporated in 1985
Shanghai Electric
was incorporated in
2004 with its main
operating assets
injected by
Shanghai Electric
Group
Listed in Hong Kong
Stock Exchange in
2005
Listed in Shanghai
Stock Exchange
through an RTO in
2008
Completed
Fangcheng nuclear
power plant in 2015
Shanghai Electric
(Group) Corporation
59%
SASAC
100%
1%
Shenergy Group Co
Ltd
100%
Shanghai Electric
Group HK Co Ltd
Shanghai Electric Group Co Ltd (2727 HK)
100%
2%
3%
Sarasin & Partners
LLP
剩余48页未读,继续阅读
资源评论
safesmile
- 粉丝: 1
- 资源: 657
上传资源 快速赚钱
- 我的内容管理 展开
- 我的资源 快来上传第一个资源
- 我的收益 登录查看自己的收益
- 我的积分 登录查看自己的积分
- 我的C币 登录后查看C币余额
- 我的收藏
- 我的下载
- 下载帮助
安全验证
文档复制为VIP权益,开通VIP直接复制
信息提交成功