export_fig
==========
A toolbox for exporting figures from MATLAB to standard image and document formats nicely.
### Overview
Exporting a figure from MATLAB the way you want it (hopefully the way it looks on screen), can be a real headache for the unitiated, thanks to all the settings that are required, and also due to some eccentricities (a.k.a. features and bugs) of functions such as `print`. The first goal of export_fig is to make transferring a plot from screen to document, just the way you expect (again, assuming that's as it appears on screen), a doddle.
The second goal is to make the output media suitable for publication, allowing you to publish your results in the full glory that you originally intended. This includes embedding fonts, setting image compression levels (including lossless), anti-aliasing, cropping, setting the colourspace, alpha-blending and getting the right resolution.
Perhaps the best way to demonstrate what export_fig can do is with some examples.
### Examples
**Visual accuracy** - MATLAB's exporting functions, namely `saveas` and `print`, change many visual properties of a figure, such as size, axes limits and ticks, and background colour, in unexpected and unintended ways. Export_fig aims to faithfully reproduce the figure as it appears on screen. For example:
```Matlab
plot(cos(linspace(0, 7, 1000)));
set(gcf, 'Position', [100 100 150 150]);
saveas(gcf, 'test.png');
export_fig test2.png
```
generates the following:
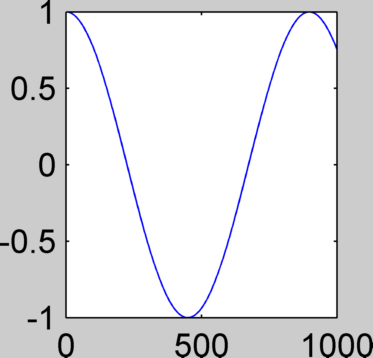
| Figure: | test.png: | test2.png: |
|:-------:|:---------:|:----------:|
|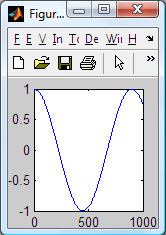|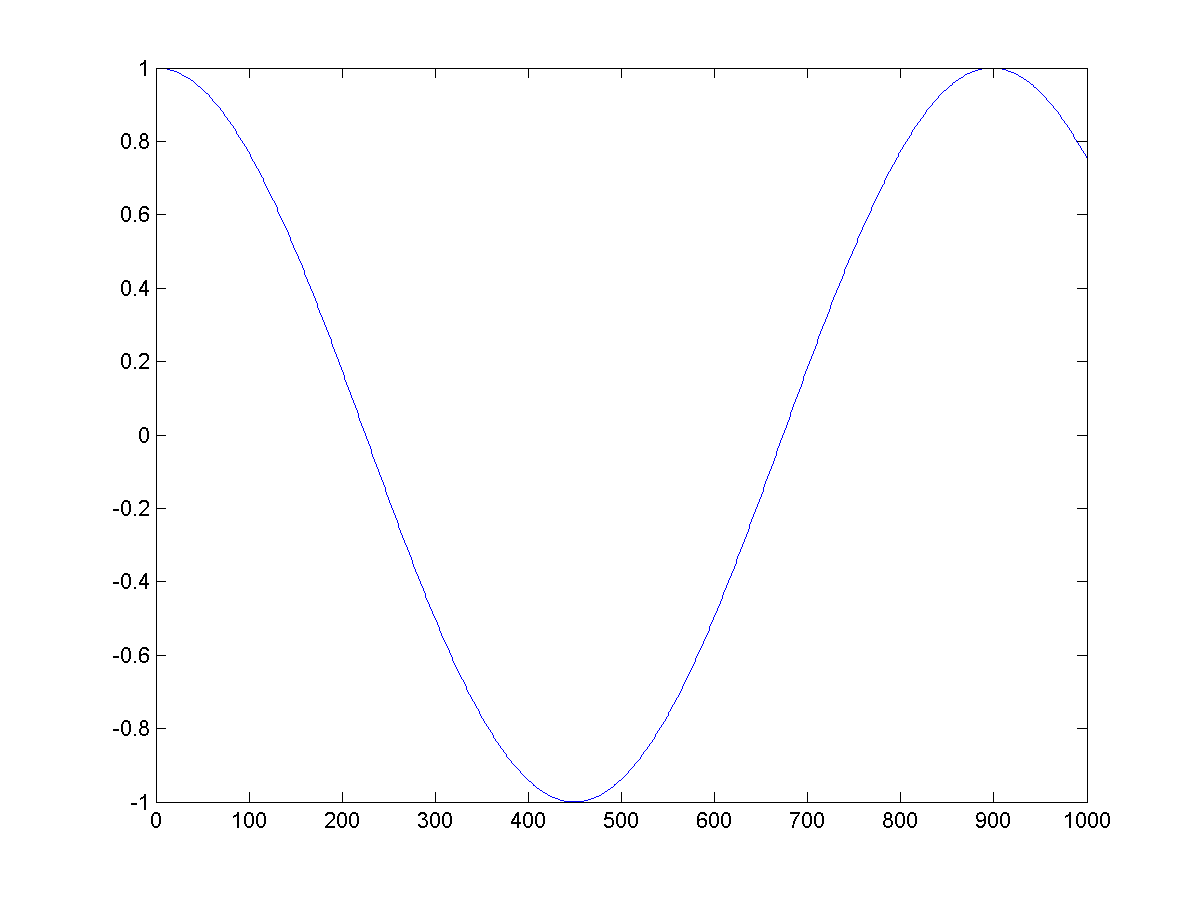|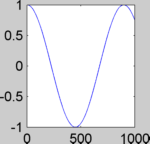|
Note that the size and background colour of test2.png (the output of export_fig) are the same as those of the on screen figure, in contrast to test.png. Of course, if you want the figure background to be white (or any other colour) in the exported file then you can set this prior to exporting using:
```Matlab
set(gcf, 'Color', 'w');
```
Notice also that export_fig crops and anti-aliases (smooths, for bitmaps only) the output by default. However, these options can be disabled; see the Tips section below for details.
**Resolution** - by default, export_fig exports bitmaps at screen resolution. However, you may wish to save them at a different resolution. You can do this using either of two options: `-m<val>`, where <val> is a positive real number, magnifies the figure by the factor <val> for export, e.g. `-m2` produces an image double the size (in pixels) of the on screen figure; `-r<val>`, again where <val> is a positive real number, specifies the output bitmap to have <val> pixels per inch, the dimensions of the figure (in inches) being those of the on screen figure. For example, using:
```Matlab
export_fig test.png -m2.5
```
on the figure from the example above generates:
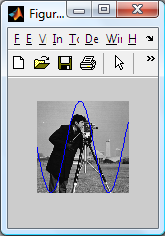
Sometimes you might have a figure with an image in. For example:
```Matlab
imshow(imread('cameraman.tif'))
hold on
plot(0:255, sin(linspace(0, 10, 256))*127+128);
set(gcf, 'Position', [100 100 150 150]);
```
generates this figure:
Here the image is displayed in the figure at resolution lower than its native resolution. However, you might want to export the figure at a resolution such that the image is output at its native (i.e. original) size (in pixels). Ordinarily this would require some non-trivial computation to work out what that resolution should be, but export_fig has an option to do this for you. Using:
```Matlab
export_fig test.png -native
```
produces:
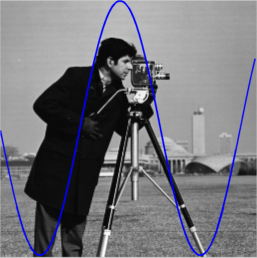
with the image being the size (in pixels) of the original image. Note that if you want an image to be a particular size, in pixels, in the output (other than its original size) then you can resize it to this size and use the `-native` option to achieve this.
All resolution options (`-m<val>`, `-q<val>` and `-native`) correctly set the resolution information in PNG and TIFF files, as if the image were the dimensions of the on screen figure.
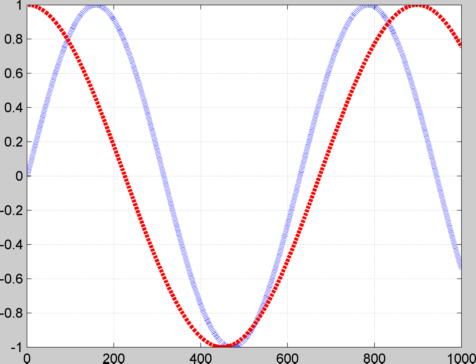
**Shrinking dots & dashes** - when exporting figures with dashed or dotted lines using either the ZBuffer or OpenGL (default for bitmaps) renderers, the dots and dashes can appear much shorter, even non-existent, in the output file, especially if the lines are thick and/or the resolution is high. For example:
```Matlab
plot(sin(linspace(0, 10, 1000)), 'b:', 'LineWidth', 4);
hold on
plot(cos(linspace(0, 7, 1000)), 'r--', 'LineWidth', 3);
grid on
export_fig test.png
```
generates:
This problem can be overcome by using the painters renderer. For example:
```Matlab
export_fig test.png -painters
```
used on the same figure generates:
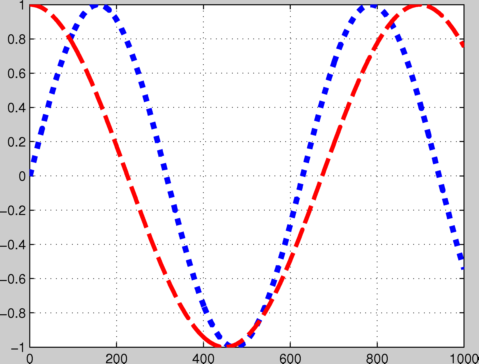
Note that not only are the plot lines correct, but the grid lines are too.
**Transparency** - sometimes you might want a figure and axes' backgrounds to be transparent, so that you can see through them to a document (for example a presentation slide, with coloured or textured background) that the exported figure is placed in. To achieve this, first (optionally) set the axes' colour to 'none' prior to exporting, using:
```Matlab
set(gca, 'Color', 'none'); % Sets axes background
```
then use export_fig's `-transparent` option when exporting:
```Matlab
export_fig test.png -transparent
```
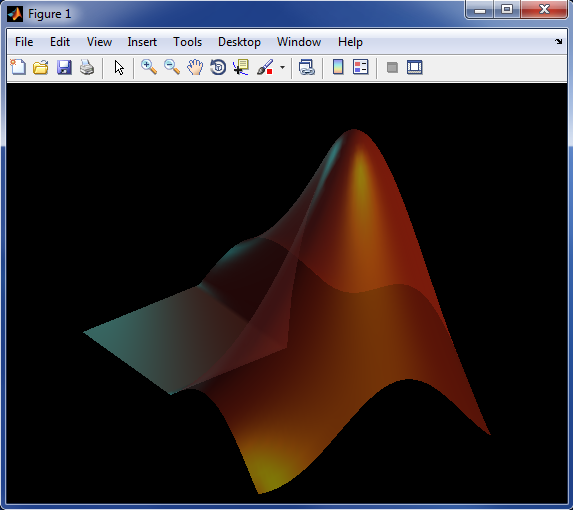
This will make the background transparent in PDF, EPS and PNG outputs. You can additionally save fully alpha-blended semi-transparent patch objects to the PNG format. For example:
```Matlab
logo;
alpha(0.5);
```
generates a figure like this:
If you then export this to PNG using the `-transparent` option you can then put the resulting image into, for example, a presentation slide with fancy, textured background, like so:
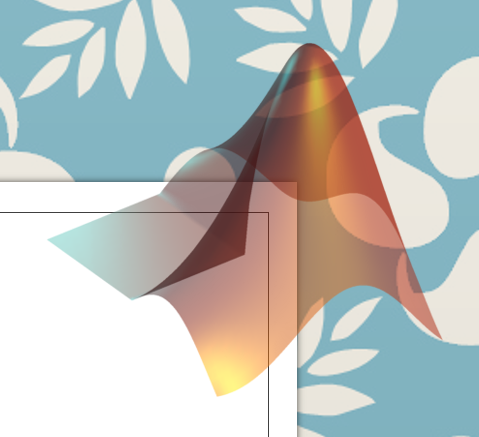
and the image blends seamlessly with the background.
**Image quality** - when publishing images of your results, you want them to look as good as possible. By default, when outputting to lossy file formats (PDF, EPS and JPEG), export_fig uses a high quality setting, i.e. low compression, for images, so little information is lost. This is in contrast to MATLAB's print and saveas functions, whose default quality settings are poor. For example:
```Matlab
A = im2double(imread('peppers.png'));
B = randn(ceil(size(A, 1)/6), ceil(size(A, 2)/6), 3) * 0.1;
B = cat(3, kron(B(:,:,1), ones(6)), kron(B(:,:,2), ones(6)), kron(B(:,:,3), ones(6)));
B = A + B(1:size(A, 1),1:size(A, 2),:);
imshow(B);
print -dpdf test.pdf
```
generates a PDF file, a sub-window of which looks (when zoomed in) like this:
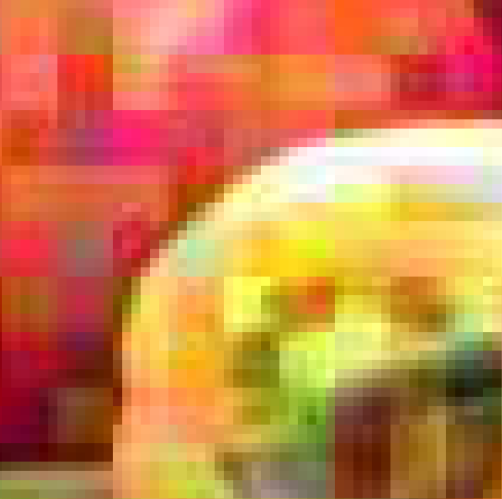
while the command
```Matlab
export_fig test.pdf
```
on the same figure produces this:
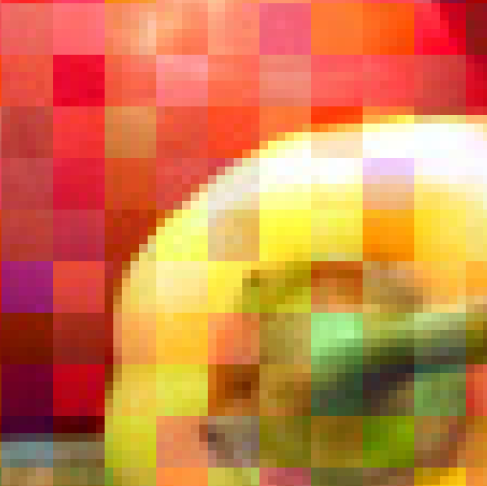
While much better, the image still contains some compression artifacts (see the low level noise around the edge of the pepper). You may prefer to export with no artifacts at all, i.e. lossless compression. Alternatively, you might need a smaller file, and be willing to accept more compression. Either way, export_fig has an option that can suit your needs: `-q<val>`, where <val> is a number from 0-100, will set the level of lossy image compression (again in PDF, EPS and JPEG outputs only; other formats are lossless), from high compression (0) to low compression/high quality (100). If you want lossless compression in any of those formats then specify a <val> greater than 100. For examp
Matlab系列--Matlab日常学习记录.zip

需积分: 5 97 浏览量
2024-02-24
21:28:23
上传
评论
收藏 6.07MB ZIP 举报
 Matlab系列--Matlab日常学习记录.zip (90个子文件)
  kwan1118 Colormaps Colormaps
  magma.asv 15KB viridis.m 12KB
 demo1_output.png 221KB fake_parula.m 3KB magma.m 15KB Thumbs.db 15KB plasma.asv 16KB demo1.m 3KB
 README.txt 314B plasma.m 16KB inferno.m 16KB demo2.m 1KB license.txt 1KB 无损导出fig crop_borders.m 5KB im2gif.m 6KB using_hg2.m 1KB ImageSelection.java 1016B read_write_entire_textfile.m 924B pdf2eps.m 2KB print2array.m 10KB LICENSE 1KB ImageSelection.class 1KB ghostscript.m 8KB test.png 74KB test2.png 3KB export_fig.m 76KB eps2pdf.m 9KB append_pdfs.m 4KB isolate_axes.m 5KB copyfig.m 2KB fix_lines.m 6KB pdftops.m 6KB user_string.m 4KB README.md 22KB print2eps.m 32KB AshuCNN AshuCNN bpcnn.m 10KB cnnAddPoolLayer.m 930B Predict_gender_CNN.m 3KB cnnAddFCLayer.m 2KB Example_gradientchecking_CNN.m 2KB gradientdescentcnn.m 843B initcnn.m 863B my_face_cnn5.mat 852KB Example_MNIST_CNN.m 4KB HowToBuildYourOwnCNN.m 3KB applyactfunccnn.m 2KB Internet_Images
  f (2).jpg 24KB Info.txt 100B f (1).jpg 58KB f (3).jpg 26KB loadcnn.m 107B traincnn.m 2KB gradient_checker.m 5KB predictcnn.m 613B testcnn.m 737B ffcnn.m 5KB cnnAddConvLayer.m 2KB checkvalues.m 312B cnnAddActLayer.m 266B savecnn.m 3KB
 a.xlsx 25KB license.txt 1KB awesome-matlab.md 293KB GUI GUI_41.m 7KB GUI_28.m 2KB GUI_35.m 4KB GUI_39.m 4KB GUI_27.m 2KB 短时傅里叶变换 track.wav 415KB stft.m 1KB license.txt 1KB example.m 1KB 大仙一品堂 6 因子分析 yinzi1.m 2KB yinzi2.m 2KB
 examp12_02.xls 21KB 命名大仙一品堂的文件.py 399B DeepLearningDemos DeepLearningDemos readFunctionTrain.m 253B Demo_FeatureExtraction.mlx 5KB saveCIFAR10AsFolderOfImages.m 3KB
 cifar-10-matlab.tar.gz 4.25MB Demo_TransferLearning.mlx 5KB Demo_TrainingFromScratch.mlx 11KB DownloadCIFAR10.m 993B license.txt 1KB README.md 16B 排序文件-多种 natsortfiles.m 5KB natsortfiles_doc.m 6KB html
  natsortfiles_doc.html 18KB natsort.m 12KB license.txt 1KB
资源评论


Kwan的解忧杂货铺
- 粉丝: 1w+
- 资源: 3671


