没有合适的资源?快使用搜索试试~ 我知道了~
麦格理-美股-消费品行业-消费之王:堡垒坚固-318-23页.pdf
需积分: 0 0 下载量 32 浏览量
2023-07-26
11:55:52
上传
评论
收藏 681KB PDF 举报
温馨提示
试读
23页
麦格理-美股-消费品行业-消费之王:堡垒坚固-318-23页.pdf
资源推荐
资源详情
资源评论
18 March 2019 North America/United States/Canada
Sales and Trading personnel at Macquarie are not independent and, therefore, the information herein may be subject to certain conflicts of
interest, and may have been shared with other parties prior to publication. Note: To the extent Macquarie Research is referenced, it is
identified as such and the associated disclaimers are included in the published research report. Please refer to the important disclosures
www.macquarie.com/salesandtradingdisclaimer.
ECONOMICS
Source: Federal Reserve, Macquarie Macro Strategy, March 2019
Source: BLS, Bloomberg, Macquarie Macro Strategy, November 2018
Economists
Macquarie Capital Markets Canada Ltd.
David Doyle, CFA +1 416 848 3663
david.doyle@macquarie.com
Neil Shankar +1 416 607 5055
neil.shankar@macquarie.com
Macquarie Securities (Australia) Limited
Ric Deverell +61 2 8232 4307
ric.deverell@macquarie.com
This publication has been prepared by Sales and Trading personnel at Macquarie
and is not a product of the Macquarie Research Department.
King Consumer
The Fortress stands strong
Powerful fundamentals underpin the US Consumer
As the economic expansion approaches ten years, its engine, the US consumer,
appears as resilient as ever. Spending has risen over $600 billion over the past
four quarters and ~$4.4 trillion over the past decade.
Consumer confidence is strong and unemployment is near multi-decade lows and
likely to fall further. While recent spending data have shown some softness, we
do not believe this is representative of consumer health. Real income growth is
robust supported by favourable trends in jobs growth and real wage growth.
These anchor our consumer outlook and view of still solid growth in the US.
2019 is likely to be a banner year for real wage growth. Nominal wages are
pushing higher even as inflation stays contained. Strength in real wage growth is
not a recent phenomenon. Despite what some naysayers may suggest, the past
ten years have been amongst the strongest in history.
Real wage growth has not been confined to those with higher incomes. Recently,
wage gains have been strongest in the lowest paying sub-industries. Moreover,
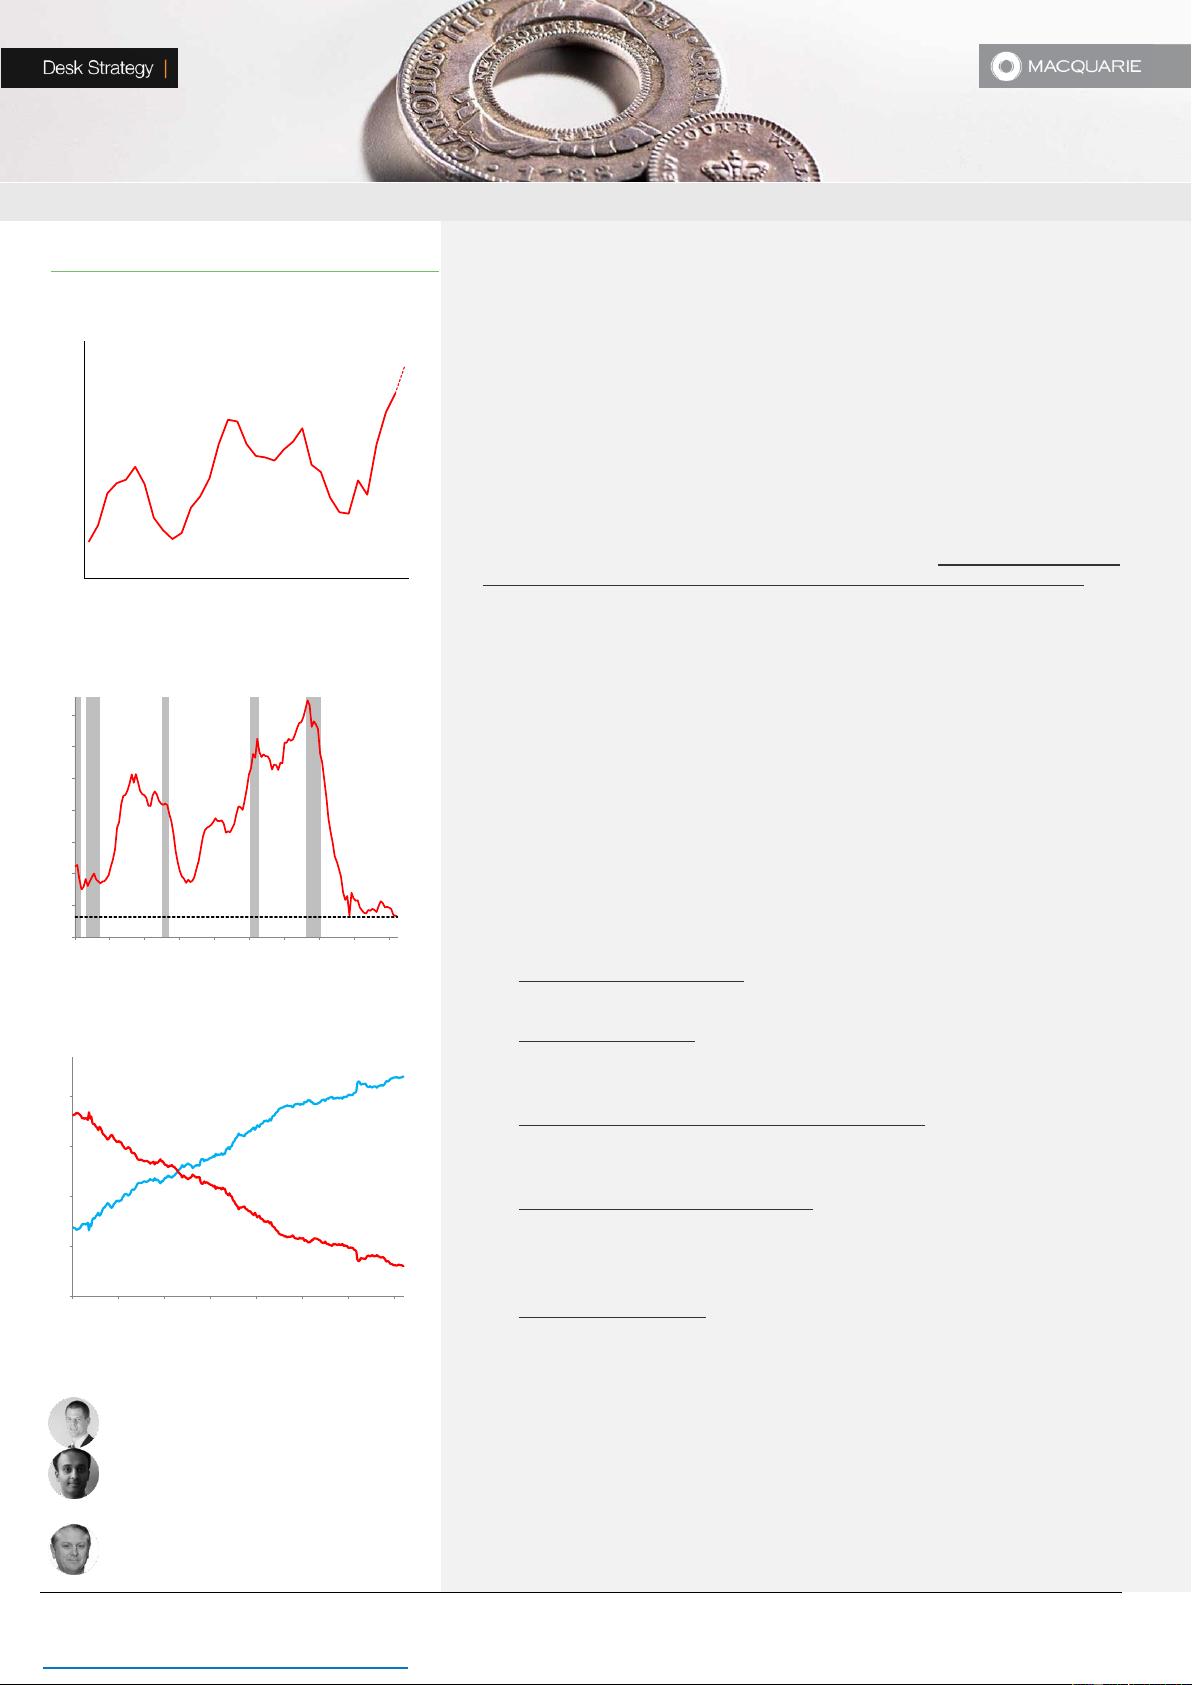
real median household income, after trending sideways for nearly three decades
(through 2014), has risen ~13% over the past 4 years.
The US consumer has deleveraged and is as resilient as ever
Deleveraging has put the consumer in a favourable position. There are few signs
of froth or concern – delinquencies and bankruptcies remain low. Several factors
suggest the consumer is well positioned to withstand potential shocks.
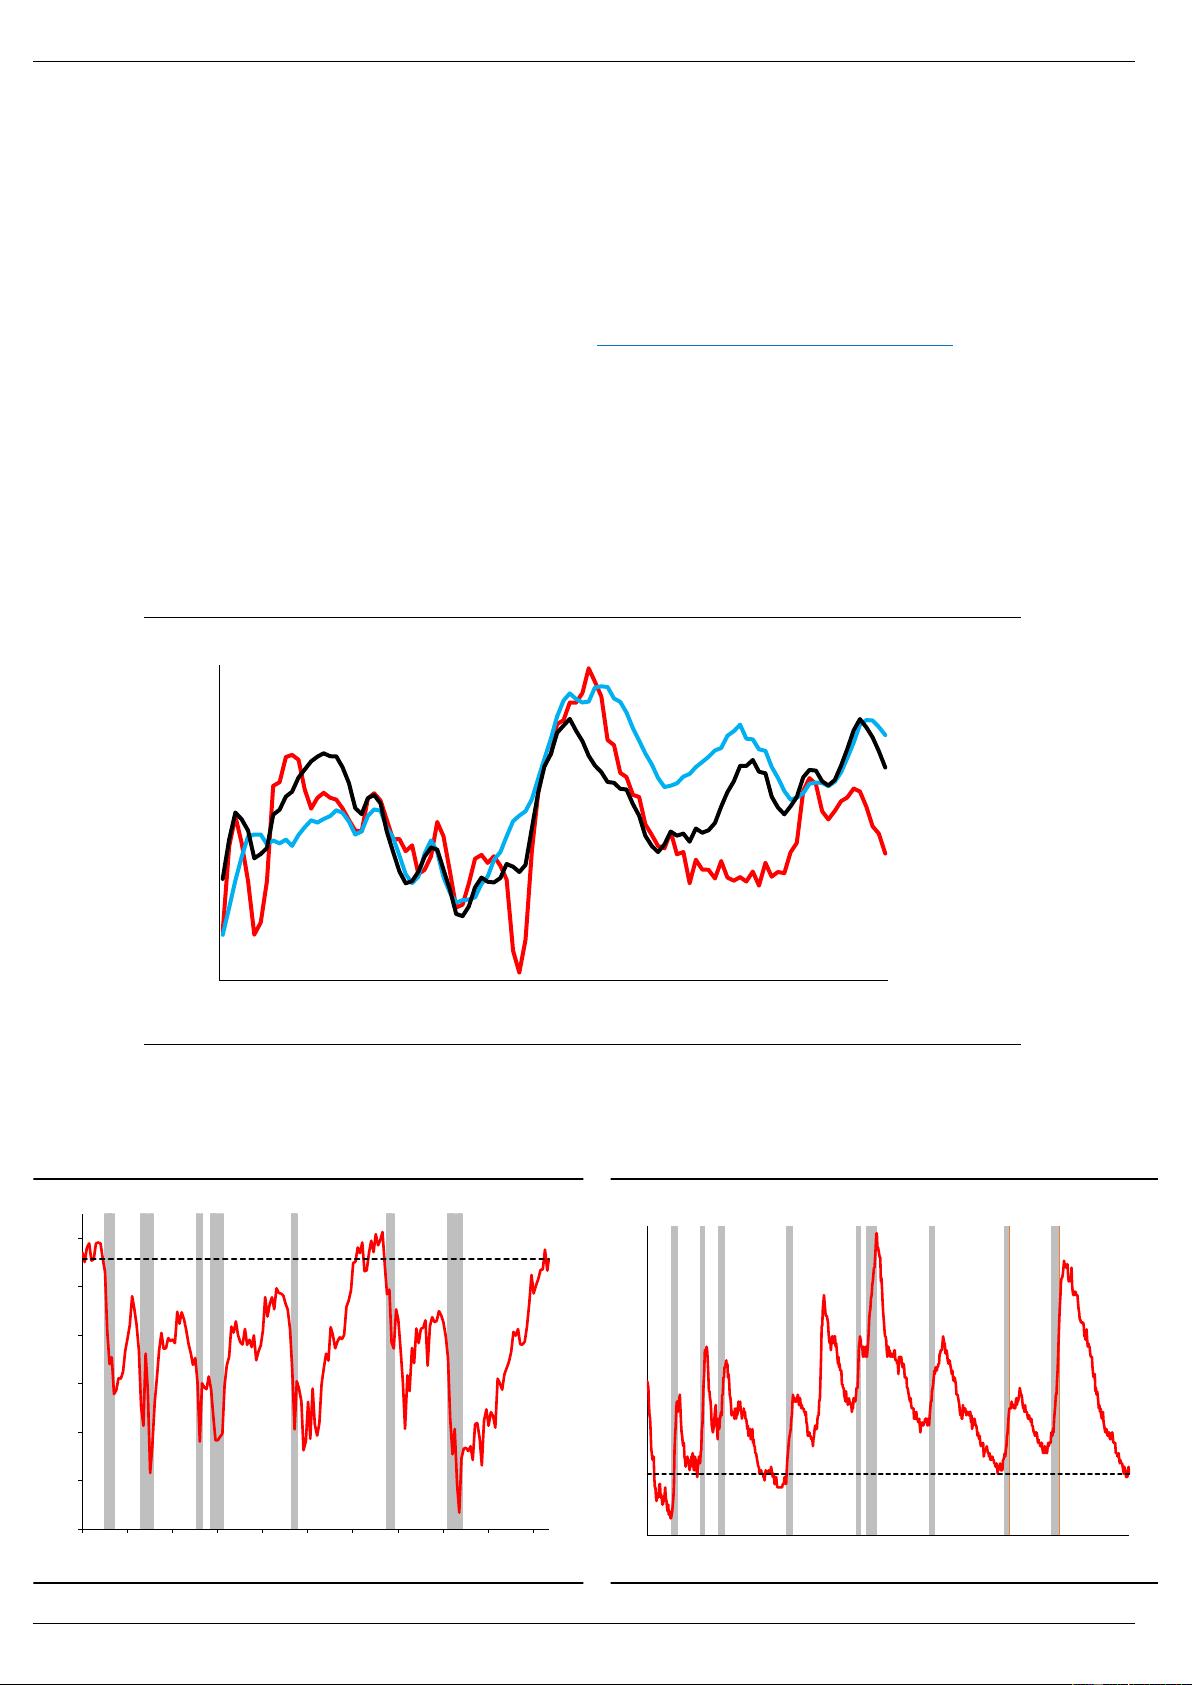
1) Household debt service low. As a share of disposable income it has never
been lower, suggesting ample capacity to absorb higher interest rates.
2) Gasoline expense low. As a share of disposable income, this stands at just
~2.2%, near the lowest level in 70 years and suggesting the consumer is well
positioned to absorb any potential increases in energy prices.
3) Secular rise in services reduces spending volatility. Spending on services
comprises ~70% of total personal consumption and has been rising. As it is
less volatile than goods spending, its rising share adds to resiliency.
4) Retirements and an aging population. As the share of population over 65
rises so has the share of income generated from sources such as defined
benefit pension plans and social security. These are more stable than
employment income, providing an added source of consumption stability.
5) Low labor force growth. Due to retirements, this should be much lower than
in prior decades. The result should be that only ~70K jobs per month will be
needed to prevent the unemployment rate from rising, suggesting the labor
market can withstand slowing jobs growth.
Key themes likely to impact consumption trends ahead
Consumption patterns are shifting. The fastest growth categories over the past
year are concentrated in services and include spectator sports, air transportation,
and internet access. Categories in decline are skewed more towards goods.
We analyze three key themes likely to impact spending patterns ahead: e-
commerce, the wealth effect, and financial pressures on the millennial generation.
52,000
54,000
56,000
58,000
60,000
62,000
64,000
66,000
1984 1988 1992 1996 2000 2004 2008 2012 2016
Real median HH income (2018 $s)
2018
est.
0
0.1
0.2
0.3
0.4
0.5
0.6
0.7
0.8
0.9
1
9.5
10.0
10.5
11.0
11.5
12.0
12.5
13.0
13.5
1980 1984 1988 1992 1996 2000 2005 2009 2013 2017
US HH debt service payments as a % of disposable personal income
3Q18 level = 9.8%
69.0%
31.0%
25%
35%
45%
55%
65%
75%
1947 1957 1967 1977 1987 1997 2007 2017
Share of personal consumption expenditures
services
goods
King Consumer
18 March 2019 2
Fig 1 Table of Contents
Source: Macquarie Macro Strategy, March 2019
Section # Subsection Title Key takeaway page
A
Consumption is rising by
~$600 billion/year and
fundamentals are robust
Fundamentals are supportive of the 2019 consumer outlook. Consumer confidence is near all
time highs and the unemployment rate is close to the lowest level achieved in nearly 50 years.
3
B
Income growth underpins
spending - and the outlook is
powerful in coming quarters
Consumer spending is ~70% of GDP. Income growth is robust, underpinned by favourable jobs
growth trends and improving wage growth.
4
C
Real personal consumption
could surprise many on the
upside
Real wage growth PLUS jobs growth have exhibited an ~80% correlation with real PCE and
suggest strong real consumption growth in 2019 and 2020.
5
A
Lagged effects from tax
reform
The Joint Committee on Taxation estimated that the Child tax credit would have an impact of
~$68bn in FY19. This may lead to higher average tax refunds in 2019, although data to date
suggests the impact may be limited.
6
B
Social security increase - the
largest $ impact of any year
thus far in the expansion
Social security has increased by 2.8% YoY, the largest increase since 2012, and an aggregate
increase of ~$28bn, another boon for the consumer.
6-7
C
Non-wage benefits are
increasing and should provide
a boost to consumption
Business are also increasing non-wage benefits in order to attract/retain employees and will
provide households with income that would otherwise not have been available. Supplemental
pay has grown by 10.9% on a YoY basis.
7
A
Wage growth acceleration is
strongest for lowest wage
quartile
Low wage sub-industries recorded wage growth of 4.6% YoY in January. Median sub-industry
wage growth across all sub-industries also remained near a cycle high of 3.3% YoY.
8
B
Real wage growth has been
better than popularly
perceived
5-year cumulative real average hourly earnings growth accelerated further to 6.9% in December
and has been trending steadily higher since 2014, a boon for consumer spending. Furthermore,
wages have risen by ~75% over the most recent ~20 years, while prices have only increased by
~44% over this time period.
9
C
Real median household
income growth
In recent years, real median household income has grown at a faster pace than any prior period
(history dates back to 1984), exceeding even the highly regarded boom period of 1993 to 1999.
10
A
Household debt service and
gasoline are low as a share of
income
Household debt service payments as a % of income have never been lower. Releverging has yet
to commence. Spending on gasoline and other energy goods as a share of disposable personal
income also stands at only ~2.2%.
11
B
The secular rise in services
spending reduces volatility
Services spending makes up ~69% of total consumption and services employment makes up
>85% of total employment. Services employment has declined by less than goods in prior
recessions and implies greater stability for the consumer cycle going forward.
12
C
The aging population also
means greater economic
stability
Over the coming decade, our analysis suggests fully 90% of population growth will be driven by
the 65 & older age group. This means nearly all population growth will come from retirees whose
propensity to consume is no longer correlated to their employment status.
13
D
Lower breakeven jobs growth
means greater economic
stability
During the 2000-7 period, a ~500K employment decline over a twelve month period would lead
the unemployment rate to rise by 1.4 percentage points. In contrast, in the current expansion, we
estimate the rise would be just 0.8 percentage points, suggesting lower volatility for consumption.
14
V - The Absence of
Froth and
Deleveraging
A
Deleveraging has continued
and credit growth is modest
Household debt service payments as a % of income have never been lower. Credit scores reveal
a healthy borrower. Bankruptcies and foreclosures are well below prior peaks. The recent rise in
the savings rate alongside the government shutdown has likely been behind the moderation in
real consumption growth. As the rate normalizes, consumption should receive a boost.
15-17
A
E-commerce sales continue
to show disproportionate
growth
Goods sales are likely to be increasingly driven by e-commerce spending. Over 40% of the
increase in core retail sales spending for nearly 3 years can be attributed to the increase in
spending on e-commerce goods.
18
B
Wealth effect and the
consumer
The typical household’s wealth is concentrated in housing, rather than the equity market.
Academic studies suggest the immediate effect of a 10% increase in housing wealth on a panel
of US states is an increase on consumption of 0.4%. In contrast, a 10% increase in financial
wealth had no effect.
19
C
Pressures on the Millennial
generation
Millennials face other financial challenges that may hamper their consumption in the years to
come. This includes i) student loan repayment, ii) rising child care costs, and iii) the purchase of
a home that has been delayed to a greater extent than in the past.
20
VII - Detailed
analysis of
consumption
categories
A
Detailed analysis shows
largest $ increase
concentrated in services
Of the top 20 subcategories of spending (based on $ increase) over the past year, the top 5
subcategories are services. Moreover, 18 of the top 20 subcategories (based on YoY % change)
are services with most being discretionary in nature.
21-22
VI - Consumption
Themes and
Trends
Table of Contents
I - Consumption
and Income -
Fundamentals and
Outlook
II - Upside risks to
income growth
projections
III - A Golden Age
for Main Street
IV - The Resilient
Consumer
King Consumer
18 March 2019 3
I – Consumption and Income - Fundamentals and Outlook
A) Consumption rose by ~$600 billion over the past year and fundamentals are robust
Nominal personal consumption has risen by over ~$600 billion over the past four quarters, continuing at a
robust pace. Spending gains overall in 2018 rivalled some of the best years of the expansion, particularly
for services (Fig 2).
While data have been softer in recent months (see: What happened to retail sales in December?),
we attribute this to the recent government shutdown and stock market volatility in December.
Fundamentals remain robust. Our outlook is for solid spending gains in coming quarters.
Consumer confidence is at levels that have only been exceeded twice before (the late 60s and the late
90s) (Fig 3).
Unemployment currently stands at 3.8%, close to the lowest level in nearly 50 years (Fig 4). Moreover,
jobs growth trends remain robust and well above underlying labor force growth, suggesting a further
decline in unemployment remains likely.
Fig 2 Services spending growth continues to outpace that of goods
Source: BEA, Macquarie Macro Strategy, March 2019
Fig 3 Consumer confidence rebounded in February after
moderating in 4Q18
Fig 4 Unemployment continues to hover around multi decade
lows
Source: BEA, Macquarie Macro Strategy, March 2019
Source: Bloomberg, Macquarie Macro Strategy, March 2019
1.4%
1.9%
2.4%
2.9%
3.4%
3.9%
4.4%
4.9%
5.4%
5.9%
2010 2011 2012 2013 2014 2015 2016 2017 2018
Nominal personal consumption expenditures - YoY % change (3mma)
goods excl.
gasoline and other
energy goods
services
total
0
0.1
0.2
0.3
0.4
0.5
0.6
0.7
0.8
0.9
1
20
40
60
80
100
120
140
1967 1972 1977 1982 1987 1992 1997 2002 2007 2012 2017
Conference Board consumer confidence index
Feb-19 level
2
3
4
5
6
7
8
9
10
11
1950 1955 1960 1965 1970 1975 1980 1985 1990 1995 2000 2005 2010 2015
US unemployment rate
Feb-18 level
King Consumer
18 March 2019 4
B) Income growth underpins spending – and the outlook is powerful in coming quarters
Consumer spending is ~70% of GDP making it a lynchpin of any economic forecast. Spending drivers
include tax policy, government benefits and social programs, wealth effects, the savings rate, and
demographics.
More significant than all of these, however, is how many dollars consumers are earning in aggregate on a
real basis.
Our framework for forecasting real spending gains is based on two key inputs that drive real income:
i) jobs growth, ii) real wage growth.
o The pace of jobs growth accelerated for much of 2018 and only with February’s soft monthly
print (see: US Wage Growth and Employment – Friendly trends for the long durable expansion)
has the trend begun to moderate. Our forecast suggests a moderation over the coming four
quarters to 150K per month in 4Q19 and then to 100K per month in 4Q20 (Fig 5).
Fig 5 Jobs growth is likely to decelerate, but still exceed labor force growth
Source: BLS, Macquarie Macro Strategy, March 2019
o Real wage growth is likely to push higher near-term as wage growth momentum continues and
headline inflation remains moderate due to lower oil prices. Subsequently, real wage growth
may decline modestly as wage growth holds firm at ~4.0% and inflation improves (Fig 6).
Fig 6 Wage growth is likely to remain firmly in positive territory
Source: BLS, BEA, Macquarie Macro Strategy, March 2019
0
0.1
0.2
0.3
0.4
0.5
0.6
0.7
0.8
0.9
1
-5%
-4%
-3%
-2%
-1%
0%
1%
2%
3%
4%
1995 1997 1999 2001 2003 2005 2007 2009 2011 2013 2015 2017 2019 2021
employment
(NFP)
labor force
US - YoY % change (six months smoothed)
forecasts
-2%
-1%
0%
1%
2%
3%
4%
5%
1995 1998 2001 2004 2007 2010 2013 2016 2019
forecasts
PCE
price index
AHE- production
and nonsupervisory
employees
YoY % change
King Consumer
18 March 2019 5
C) Real personal consumption could surprise on the upside
The combination of low inflation, accelerating wage growth, and still firm jobs growth suggests an upbeat
outlook for consumer spending.
o On inflation, our forecast has the PCE price index rising to 2.0% by end-19 and 2.4% at end-20.
o Jobs growth decelerates to a trend (3 month average pace) of 150K at end-19 and further to ~100K
at end-20.
o Wage growth continues to move gradually higher to 4% at end-19 and continues to hold this level.
These three inputs have been useful at tracking the growth in real consumption over the course of this
expansion (Fig 7) and suggest real consumption growth of ~3% for 2019 (4Q on 4Q).
o Since 2006, the combination of these inputs have exhibited an ~80% correlation with real personal
consumption expenditures.
The full table of our outlook for real consumption growth is presented below (Fig 8).
Fig 7 Real wage growth PLUS jobs growth suggests firm consumption ahead
Source: Bloomberg, BEA, BLS, Macquarie Macro Strategy, March 2019
Fig 8 Table of inputs underpinning our forecast for real income growth
Source: Bloomberg, BEA, BLS, Macquarie Macro Strategy, March 2019
-4%
-3%
-2%
-1%
0%
1%
2%
3%
4%
5%
2006 2007 2008 2009 2010 2011 2012 2013 2014 2015 2016 2017 2018 2019 2020
forecasts
real personal
consumption
expenditures
(Wage growth PLUS
Jobs growth LESS PCE
inflation)
YoY % change
A B C D = A+B-C
Monthly jobs
growth average in
quarter
Jobs growth Wage growth PCE price inflation
Real income
growth
1Q19 174 1.7% 3.4% 1.7% 3.4%
2Q19 175 1.6% 3.6% 1.7% 3.4%
3Q19 160 1.5% 3.7% 1.9% 3.3%
4Q19 150 1.3% 3.7% 2.1% 2.9%
1Q20 140 1.2% 4.0% 2.3% 3.0%
2Q20 130 1.1% 4.0% 2.3% 2.9%
3Q20 115 1.1% 4.0% 2.4% 2.7%
4Q20 100 1.0% 4.0% 2.4% 2.6%
YoY % change
剩余22页未读,继续阅读
资源评论
qq_41146932
- 粉丝: 8
- 资源: 6309
上传资源 快速赚钱
- 我的内容管理 展开
- 我的资源 快来上传第一个资源
- 我的收益 登录查看自己的收益
- 我的积分 登录查看自己的积分
- 我的C币 登录后查看C币余额
- 我的收藏
- 我的下载
- 下载帮助
安全验证
文档复制为VIP权益,开通VIP直接复制
信息提交成功