没有合适的资源?快使用搜索试试~ 我知道了~
建筑设计人工智能论文参考
资源推荐
资源详情
资源评论
Building-GAN: Graph-Conditioned Architectural Volumetric Design Generation
Kai-Hung Chang
*
1
, Chin-Yi Cheng
*
1
, Jieliang Luo
1
, Shingo Murata
2
, Mehdi Nourbakhsh
1
, and
Yoshito Tsuji
2
1
Autodesk Research, United States
2
Obayashi AI Design Lab, Japan
Abstract
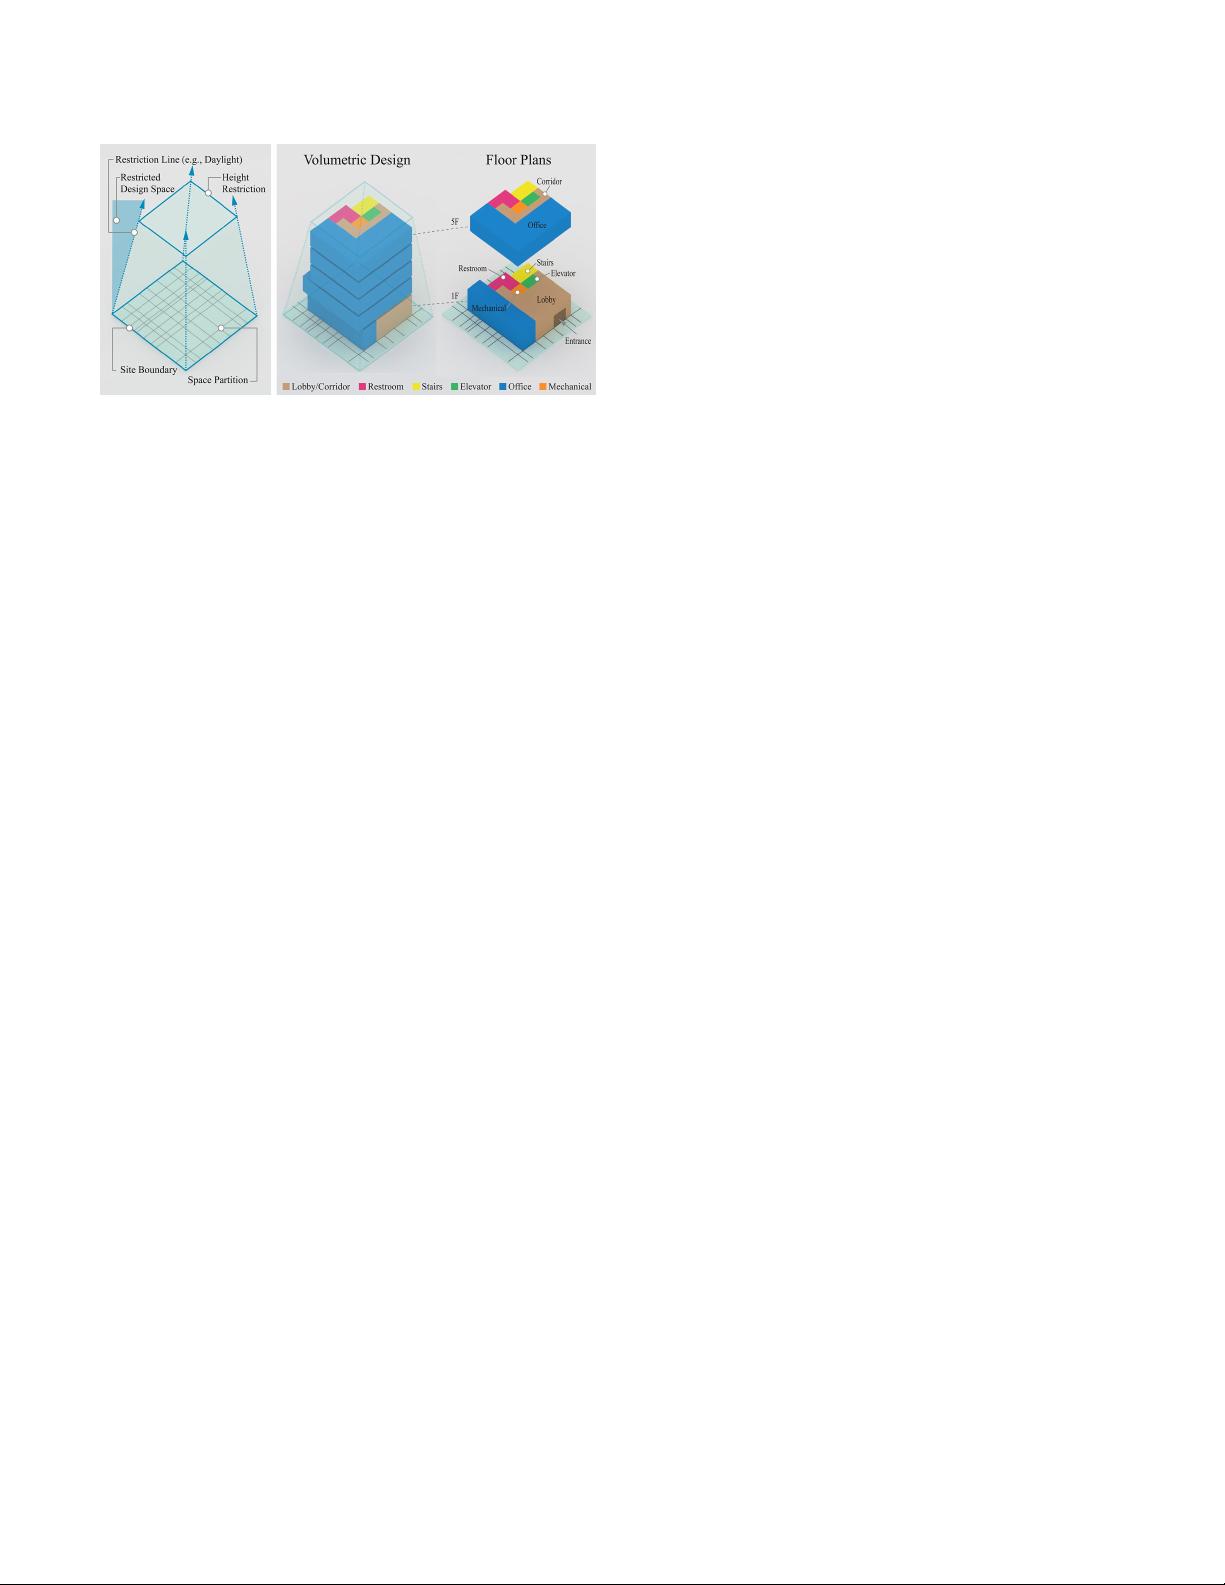
Volumetric design is the first and critical step for pro-
fessional building design, where architects not only depict
the rough 3D geometry of the building but also specify the
programs to form a 2D layout on each floor. Though 2D
layout generation for a single story has been widely studied,
there is no developed method for multi-story buildings. This
paper focuses on volumetric design generation conditioned
on an input program graph. Instead of outputting dense 3D
voxels, we propose a new 3D representation named voxel
graph that is both compact and expressive for building ge-
ometries. Our generator is a cross-modal graph neural
network that uses a pointer mechanism to connect the in-
put program graph and the output voxel graph, and the
whole pipeline is trained using the adversarial framework.
The generated designs are evaluated qualitatively by a user
study and quantitatively using three metrics: quality, diver-
sity, and connectivity accuracy. We show that our model
generates realistic 3D volumetric designs and outperforms
previous methods and baselines.
1. Introduction
Volumetric design (also called massing design or
schematic design) is the first step when an architect designs
a building on a given land site. Based on the local building
codes applied to the site, the building can only be designed
within a valid design space, which is usually not a regular
cuboid. For instance, the daylight restrictions prevent the
building from casting too much shadow over its neighboring
building by drawing a slant line as upper bound. Within the
valid design space, a volumetric design not only depicts the
volumetric 3D shape of the building, but also produces 2D
program layouts for each story. An example is illustrated in
Figure 2. The architect then uses the finalized volumetric
*
Contributed equally.
Figure 1. Our model takes in a program graph (also called bubble
diagram) and a design space in voxel graph representation, and
outputs a variety of volumetric designs. Professional architects
can convert the output into detailed building design efficiently.
design to gradually develop all the details for construction,
including fac¸ade design, interior design, structure systems,
etc. While volumetric design is the foundation of the design
and construction process, making a good volumetric design
usually requires a significant amount of time and effort. An
efficient pipeline to generate volumetric design will bring a
great impact on the architecture and construction industry.
Generating realistic 2D room layouts has been a pop-
ular topic for many years. Existing methods include
arXiv:2104.13316v1 [cs.LG] 27 Apr 2021
Figure 2. Left: an example of valid design space. Right: an exam-
ple of volumetric design within the valid design space
optimization-based [14, 1] and learning-based [28, 17, 11,
5] approaches. Recently, researchers start looking at how to
integrate program graphs into layout generation tasks using
graph neural networks (GNNs) [17, 11, 5]. Program graph,
also called bubble diagram, is a graph that illustrates the
relations between programs or rooms and is a common rep-
resentation used by professional architects to explore design
ideas. Similar to House-GAN [17], this paper also focuses
on the graph-conditioned layout generation task. The task
requires the output layouts to be compatible to the condi-
tion input program graphs. However, there is no literature
on extending the task to 3D. Our goal is to produce multiple
layouts, which stack up and form a volumetric design for a
multi-story building.
Though it might seem straight-forward to transfer previ-
ous 2D approaches to 3D, there are several challenges and
limitations when applying previous approaches:
• Compared to the 2D counterparts, 3D program graphs
are not only larger in size, but also more complex
with additional inter-story relations. The output design
space also increases by the number of stories.
• The raw rasterized output used in previous works can-
not produce clean corners and edges due to the fine dis-
cretization of pixels. For instance, boundaries are usu-
ally jagged, rooms can be poorly aligned and overlap-
ping each other, there might be small dents or bulges
in some rooms, etc.
• Volumetric images (usually defined as 3D regular grids
with uniformly discretized voxels) have the closest
structural similarity to rectangular buildings than other
3D representations, such as point clouds or meshes.
However, it is not computational and memory efficient
to use this dense representation for polygonal rooms.
Moreover, there are voxels within the regular grid but
not in the irregular valid design space that take un-
needed memory and computation.
To overcome these challenges and limitations, we pro-
pose voxel graph, a novel 3D representation that can en-
code irregular voxel grids with non-uniform space partition-
ing. To bridge between the input program graph and the
output voxel graph, we design a pointer-based cross-modal
modules in our generative adversarial graph network. The
pointer module can be used not only for message passing,
but also as a decoder to output probability over a dynamic
set of valid programs.
We also work with professional architects to create a
synthetic dataset that contains 120,000 volumetric designs
based on realistic building requirements. We evaluate our
model qualitatively and quantitatively, and it outperforms
existing method by a large margin in all the three metrics:
quality, diversity, and connectivity accuracy.
In summary, our main contributions are: 1) a new 3D
representation, voxel graph; 2) a graph-conditioned gener-
ative adversarial network (GAN) using GNN and pointer-
based cross-modal module; 3) an automated pipeline to gen-
erate valid volumetric designs through simple interaction;
and 4) a synthetic dataset that contains 120,000 volumetric
design and their corresponding program graphs. We will
share the code, model, and dataset.
2. Related Work
2.1. Voxel Representations
Regular grid representation using voxels, such as occu-
pancy grids, has been studied since the 3D extension of 2D
convolution. To achieve 3D shape synthesis, researchers
build encoder-decoder models, such as deep belief network
[29], variational auto-encoder (VAE) [12], generative ad-
versarial network (GAN) [27, 22], and energy-based model
[30]. However, due to the dense representation for sparse
occupancy, voxel representation is notorious for its cubic
computational cost and poor scalability to higher resolu-
tions and larger sizes. Existing methods to mitigate the
problem include sparse convolution [8, 7, 4] and octree rep-
resentation [20, 25, 26].
Our proposed voxel graph combines voxel-based and
graph-based representations by encoding voxels into graph
nodes. Similar idea was proposed in Point-Voxel CNN [13].
To enhance the local modeling capability, it has a high-
resolution point-based branch as well as a low-resolution
voxel-based branch for point cloud encoding. Another fea-
ture of our voxel graph is the ability to support non-uniform
space partition. Polyfit [15, 6] reconstructs 3D models by
selecting space partition planes extracted from point clouds.
BSP-Net [3] learns to generate compact meshes using bi-
nary space partitioning. NeuralSim and NeuralSizer [2] also
use graphs to represent structure grids (i.e., columns and
beams) of buildings instead of dense voxels.
Figure 3. Left: the hierarchical program graph. Right: the irregular grid with non-uniform voxel size and the equivalent voxel graph.
2.2. Graph-conditioned Layout Generation
To the best of our knowledge, there is no prior works
on learning-based 3D layout generation. Alternatively, we
review several work on graph-conditioned 2D layout gener-
ation. Graph2Plan [11] generates bounding boxes for each
room, and refines box locations with a cascaded refinement
network. The input graphs are retrieved based on user con-
straints and outline similarity. The user can get various lay-
outs by feeding different graphs, but the model itself can-
not produce variation. House-GAN [17] proposes a graph-
conditioned GAN, where the generator and discriminator
are built upon relational architecture - ConvMPN [31]. Xin-
han Di et al. [5] uses a similar adversarial approach on in-
terior design with doors, windows, and furniture. Layout-
GMN [19] learns to predict structural similarity between
two layouts with an attention-based graph matching net-
work. Wamiq Para et al. [18] explores the idea of generative
modeling using constraint generation for layouts.
3. Representation and Data Collection
The goal of this paper is to generate 3D volumetric de-
signs given a program graph and a valid design space. The
program graph illustrates the intra-story and inter-story re-
lations between programs. Besides program graph and valid
design space, there are other design conditions that are con-
sidered by architects in industry practice. Floor area ratio
(FAR, derived by dividing the total area of the building by
the total area of the parcel), should not exceed a regulation
limit. In addition, target program ratio (TPR) defines the
approximate ratio between programs. For example, office :
corridor : restroom : elevator : stairs = 50 : 20 : 15 : 5 : 10.
Both TPR and FAR are encoded into the program graph as
described in Section 3.2 and are used as the model input.
Another input is a valid design space, which may be ir-
regular due to building codes. The design space can be
further partitioned freely based on architect’s decisions or
statistical heuristics. In practice, before starting the design
process, architects usually partition the space by consider-
ing construction standards, structure systems, and conven-
tional modules. Inspired by this partitioning process, we
invent the representation, voxel graph, as described in Sec-
tion 3.3.
3.1. Data Collection
Since there is no publicly available dataset for volu-
metric designs from real buildings, we create a synthetic
dataset with 120,000 volumetric designs for commercial
buildings using parametric models. The site of each de-
sign is bounded within 40×40 ×50m
3
, where different site
conditions are randomly generated. The heuristics behind
the parametric models are based on the rules and knowl-
edge provided by professional architects. Although these
parametric models are able to explore possible volumet-
ric designs, they are not capable of fitting the constraints.
Therefore, we generate the designs first and then compute
the voxel graph, program graph, FAR, and TPR for each
design. Please refer to the supplementary for more details
and visualization of the synthetic dataset. The dataset can
also be used to explore other learning-based design tools or
relevant tasks in computer vision and graphics.
3.2. Hierarchical Program Graph
Given a building datum, we first construct 2D program
graphs for each story. Each program node feature includes
the program type and the story level. Here, we consider
6 program types: lobby/corridor, restroom, stairs, eleva-
tor, office, and mechanical room. A program edge shows
the two programs are connected by a door or opening. To
construct the 3D program graph, we stack all 2D program
graphs and chain the stairs and elevators, since they are the
only paths for moving vertically. In practice, the 3D pro-
gram graph also represents the circulation of the building.
Recall that there are two other design condition inputs:
FAR and TPR. The FAR limit is stored as a graph-level fea-
ture. As for TPR, we add one hierarchy on top of the 3D
program graph. We create one master program node for
each program type and connect them to all program nodes
of the same type. The edges allow the master node to al-
locate different area sizes on each program node through
message passing. Please refer to left of Figure 3.
3.3. Voxel Graph
To overcome the challenges and limitations listed in Sec-
tion 1, we invent a 3D representation called voxel graph.
Each node represents a voxel and the voxel information (co-
ordinate and dimension) is stored as node features. Differ-
ent from volumetric images with voxel grids, voxel graph
does not assume regular grids and consumes memory only
for occupied voxels. Moreover, it allows non-uniform space
partitioning, which avoids over-discretization when using
the uniform voxel size.
Theoretically, voxel nodes can encode arbitrary 3D prim-
itives, but in this paper, only cuboids with varying sizes are
used to build up the approximated valid design space. When
parsing the data, the space partition is defined by the projec-
tion of all 2D layouts. In real-world practice, walls tend to
align across different stories for structural stability or con-
struction considerations, which leads to a reduced amount
of voxels in the space partition. Next, we turn the voxels
into graph nodes and store the voxel information (location
and dimension) as node features and program type as node
labels. Node mask is also stored in case of nodes that are
left unused and does not have any program type. Lastly, a
voxel edge connects two voxel nodes if they share a face.
The final voxel graph should look like an irregular cubic
lattice as illustrated in the right of Figure 3.
4. Method
We formulate the framework as a graph-conditioned
GAN. The generator is composed by two GNNs for the pro-
gram graph and voxel graph, connected by a cross-modal
pointer module. The discriminator is composed by a GNN
with two decoders to evaluate design from both building
and story level. An overview of our model is illustrated in
Figure 4.
4.1. Generator
4.1.1 Program GNN
Our generator starts with a program graph neural network
to encode the input program graph. Denote random pro-
gram noise as z
p
, FAR limit as F , program node feature i
as x
i
, neighbor of node i as N e(i), node cluster of i’s pro-
gram type as Cl(i), target program ratio of i’s program type
as r
Cl(i)
, multi-layer perceptron as M LP , mean pooling as
Mean, and concatenation operator as [·, ·]. We first map
the node feature to the embedding space (1), then compute
message passing T times. In each message passing step, we
compute the message from neighboring nodes (2) and mean
pool all nodes with the same program type as the master
node embedding (3). Lastly, we update the node embed-
dings with residual learning to avoid gradient vanishing (4).
After T = 5 steps of message passing, the final embedding
of program node i is denoted as x
T
i
.
x
0
i
= MLP
p
enc
([x
i
, z
p
i
, F ]) (1)
m
t
i
=
1
|Ne(i)|
X
j∈Ne(i)
MLP
p
messag e
([x
t
i
, x
t
j
]) (2)
c
t
i
= Mean
j∈Cl(i)
({x
t
j
}) (3)
x
t+1
i
= x
t
i
+ M LP
p
update
([x
t
i
, m
t
i
, r
Cl(i)
c
t
i
, F ]) (4)
4.1.2 Voxel GNN
The input voxel features v
k
and voxel noise z
v
k
are first en-
coded by the voxel GNN encoder. To better encode the story
index, we choose positional encoding (PE) as proposed in
[23] and add it to the processed embedding (5). Instead
of appending the absolute coordinates in voxel features, we
use the relative displacements p
k
− p
l
in message computa-
tion (6). Voxel node embeddings are updated with residual
learning (7).
v
0
k
= MLP
v
enc
([v
k
, z
v
k
]) + P E(story
k
) (5)
n
t
k
=
X
l∈Ne(k)
MLP
v
messag e
([v
t
k
, v
t
l
, p
k
− pl]) (6)
v
t
k
= v
t
k
+ M LP
v
update
(v
t
k
, n
t
k
) (7)
4.1.3 Pointer-based Cross-Modal Module
After processing the program graph with the program GNN,
the final embedding of program nodes can be viewed as the
virtual ”blueprint” of a design. Therefore, it is necessary to
”look” at this blueprint to generate the output. To bridge
between the program graph and the voxel graph, we intro-
duce a pointer-based cross-modal module. Inspired by the
application [21, 16] of the Pointer Network [24] in natu-
ral language processing and mesh generation tasks, we con-
struct a pointer module to achieve message passing between
the voxel nodes and all the program nodes on the same
story. We cannot use a fixed length output to model program
type distribution since 1) different stories can have different
numbers of program nodes to choose from, for example,
one floor has five rooms and another one has seven rooms;
and 2) if there are two program nodes with the same pro-
gram type, we want to differentiate between the two nodes,
such as two restrooms in the same floor.
The pointer module returns three terms: mask
k
, att
k
,
and v
t+1
k
(8). mask
k
is used as a soft prediction whether
the voxel node k is used or not (9). If it is not used, it
is left unused and has no program type. Otherwise, att
k
Figure 4. An overview of Building-GAN. Top: the Program GNN, Voxel GNN, and Cross-Modal Pointer Module for the generator. Bottom:
the discriminator with the building and story level decoders.
is the attention distribution over the set of program nodes
on the same floor (10, 11). An updated embedding v
t+1
k
is
computed by the weighted sum of the program embeddings
x
T
i
multiplied by the soft prediction mask
k
with residual
learning (12).
mask
k
, att
k
, v
t+1
k
= P ointer(v
t
k
, {x
T
i
}) (8)
mask
k
= σ(M LP (v
t
k
)) (9)
e
k,i
= θ
T
tanh(W
x
x
T
i
+ W
v
v
t
k
) (10)
att
k
= gumbel softmax(e
k
) (11)
v
t+1
k
= v
t
k
+ mask
k
X
i
att
k,i
x
T
i
(12)
We experiment different ways to integrate the pointer
module. It can be placed after every several message pass-
ing steps in voxel GNN. Our baseline model uses 12 steps
of message passing and call the pointer module once every
2 steps. Please refer to the supplementary for the complete
model and algorithm. Conceptually, these pointer modules
should gradually improve the design. Note that the output
att
k
indicates which program node is associated to the pro-
gram type of the voxel node, instead of merely the program
type prediction.
4.2. Discriminator
Our discriminator is trained to distinguish if a given de-
sign is generated by the generator or sampled from the
dataset. Therefore, we take a similar architecture as voxel
GNN, but without using the pointer modules. The program
type predictions are concatenated to the encoded voxel node
features. After T = 12 message passing steps, two sep-
arate decoders are used. A graph-level max-pooling de-
coder evaluates the design as a whole while a story-level
max-pooling decoder evaluates the per-story layouts indi-
vidually.
o
g lobal
= MLP
dec
g lobal
(
X
k
v
T
k
) (13)
o
story
= Mean
story s
(MLP
dec
story
(
X
k∈s
v
T
k
)) (14)
4.3. Loss
We use the WGAN-GP [9] loss with gradient penalty set
to 10. The two decoder outputs from the discriminator are
equally weighted. The gradient penalty is computed by lin-
early interpolating the cross-modal attention between real
data and generated output, while fixing the voxel graph con-
nectivity.
4.4. Evaluation Metric
We evaluate the generated design in terms of quality, di-
versity, and connectivity accuracy. The quality and diversity
of the output design is evaluated with the Fr
´
echet Inception
Distance (FID) score [10]. FID score has demonstrated high
correlation to human judgement and has been widely used
in many 2D and 3D studies. Our reference model is based
on a larger version of 3D Descriptor Net [30]. We replace all
convolution layers with 6 residual blocks due to the higher
complexity of our data. Then we flatten the embedding to a
128-dimension tensor using convolution operation and pass
it to a dense layer for loss computation. The FID score is
measured over 10,000 samples. We also run a user study
with architects to measure the quality in Section 5.5.
The connectivity accuracy (Con.) is measured by the
number of the program (room) connections observed from
both the generated design and in the program graph, divided
by the amount of all edges in the program graph. Note that
only when two rooms are connected in the program graph
but disconnected in the voxel graph, it is considered as in-
accurate, since there is no shared wall to put a door. It is
accurate when two rooms are connected in voxel graph but
剩余23页未读,继续阅读
资源评论
Schulynn
- 粉丝: 1
- 资源: 10
上传资源 快速赚钱
- 我的内容管理 展开
- 我的资源 快来上传第一个资源
- 我的收益 登录查看自己的收益
- 我的积分 登录查看自己的积分
- 我的C币 登录后查看C币余额
- 我的收藏
- 我的下载
- 下载帮助
安全验证
文档复制为VIP权益,开通VIP直接复制
信息提交成功