


1/8 www.ni.com
1.
2.
3.
4.
5.
Getting Started with the Data Dashboard for LabVIEW
Publish Date: May 06, 2013
Overview
Data Dashboard allows you to create custom, portable views of National Instruments LabVIEW applications. Using this application, you can create dashboards to display the values of
network-published shared variables and deployed LabVIEW Web services on indicators, such as charts, gauges, textboxes, and LEDs.
Data Dashboard 2.0 is available for the Apple iPad in the Apple App Store. This tutorial describes the basic steps for getting started with Data Dashboard 2.0. You can find the same content plus
more in the tutorials that are included in Data Dashboard 2.0.
Table of Contents
Creating a Dashboard
Deploying Shared Variables
Connecting to Shared Variables
Deploying Web Services
Connecting to Web Services
1. Creating a Dashboard
Open Data Dashboard 2.0 on your device. When the app opens you will see the screen shown below. This main view is the dashboard carousel, you can use the dashboard carousel to manage
your dashboards. To create a new dashboard tap the sign at the bottom of the carousel and select "+" New Dashboard.
You will then be prompted to choose the orientation of your dashboard, or . For this tutorial you can select either option.Portrait Landscape
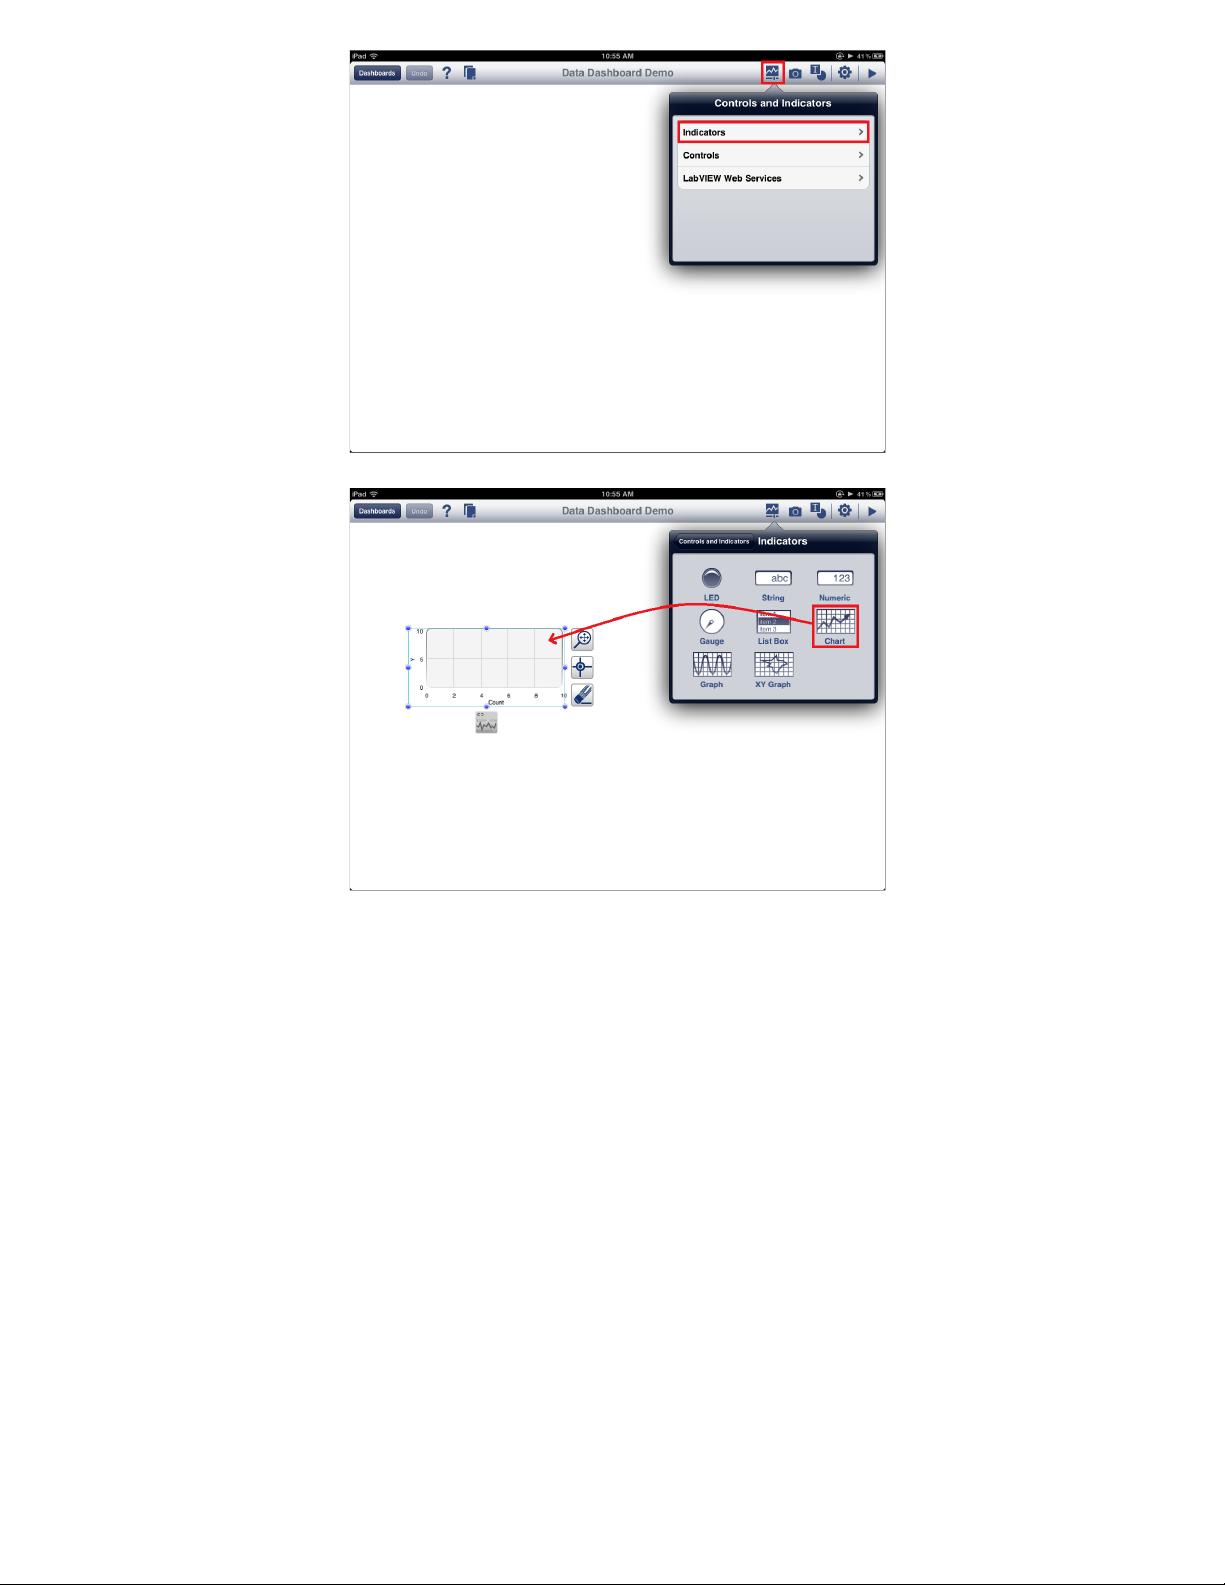
Your new dashboard will open and appear as below. To place an indicator on the dashboard tap the and select . This will open the indicators pallet. Controls and Indicators Icon Indicators


- 1
- 2
前往页