没有合适的资源?快使用搜索试试~ 我知道了~
资源推荐
资源详情
资源评论
City Momentum Index 2017
Which cities are changing fastest?
Cities Research Center I 2017
JLL City Momentum Index 2017 Edition2
The Cities Changing Fastest
The world’s 30 most dynamic cities
1
2
3
4
5
6
7
8
9
10
11
12
13
14
15
16
17
18
19
20
Bangalore
Ho Chi Minh City
Silicon Valley
Shanghai
Hyderabad
London
Austin
Hanoi
Boston
Nairobi
Dubai
Melbourne
Pune
New York
Beijing
Sydney
Paris
Chennai
Manila
Seattle
21
22
23
24
25
26
27
28
29
30
San Francisco
Shenzhen
Delhi
Raleigh-Durham
Mumbai
Hangzhou
Los Angeles
Dublin
Nanjing
Stockholm
Americas
EMEA
Population Connectivity Technology and R&D Education Environment
Economic Output Corporate Activity Construction Real Estate Investment Property Prices
Our model combines 42 socio-economic and real estate indicators
Asia Pacific
What is the City Momentum Index?
• This is the fourth edition of JLL’s City Momentum Index (CMI), rst published in 2014.
• The CMI tracks the speed of change of a city’s economy and commercial real estate market,
identifying those cities that have the most dynamic attributes over the short and long term.
• The Index covers 134 major established and emerging business hubs across the globe.
• 42 elements of a city’s dynamism are covered, which are grouped into three main sub-indices:
Socio-economic momentum relating to changes in city GDP, population, air passengers,
corporate headquarters and foreign direct investment (FDI).
Commercial real estate momentum relating to changes in absorption, construction, rents,
investment volumes and real estate transparency covering the oice, retail and hotel sectors.
High-value incubators relating to the ability of the underlying attributes of a city to maintain
momentum over the longer term (i.e. its future-proong capacity) in terms of education,
innovation and environment.
• This edition focuses primarily on the 30 cities that rank at the top of the CMI 2017.
JLL City Momentum Index 2017 Edition2
Source: JLL
JLL City Momentum Index 2017 Edition3
6. London
9. Boston
10. Nairobi
4. Shanghai
5. Hyderabad
7. Austin
3. Silicon Valley
2. Ho Chi Minh City
8. Hanoi
1. Bangalore
A world of heightened risk
The world has become a riskier place since JLL last published its City Momentum Index (CMI) in January 2016.
Various political upheavals are threatening the global status quo, creating economic uncertainty and testing
the resilience of the world’s major cities. These disruptions are happening just as our cities are undergoing
major structural change as the eects of globalisation, technological breakthroughs and rapid urbanisation
combine to challenge the very fabric of our urban spaces.
Cities taking the lead
Yet despite the multiplicity of challenges the 2017 edition of JLL’s City Momentum Index highlights
remarkable dynamism in our major cities, many of which are consistently outperforming their national
economies. As the risk of nation-states edging towards insularity and protectionism continues, so cities are
taking up the mantle of globalisation and reaching out internationally to create new networks of cities. The
world’s most robust, agile and open cities are generating considerable momentum and energy, and are
taking the lead in shaping our future landscape.
Mapping the City Momentum Index 2017: Global Top 30
Source: JLL
Top 10 11-20 21-30
1 Bangalore 11 Dubai 21 San Francisco
2 Ho Chi Minh City 12 Melbourne 22 Shenzhen
3 Silicon Valley 13 Pune 23 Delhi
4 Shanghai 14 New York 24 Raleigh-Durham
5 Hyderabad 15 Beijing 25 Mumbai
6 London 16 Sydney 26 Hangzhou
7 Austin 17 Paris 27 Los Angeles
8 Hanoi 18 Chennai 28 Dublin
9 Boston 19 Manila 29 Nanjing
10 Nairobi 20 Seattle 30 Stockholm
JLL City Momentum Index 2017 Edition4 JLL City Momentum Index 2017 Edition4
10 taaways
from the City Momentum Index 2017
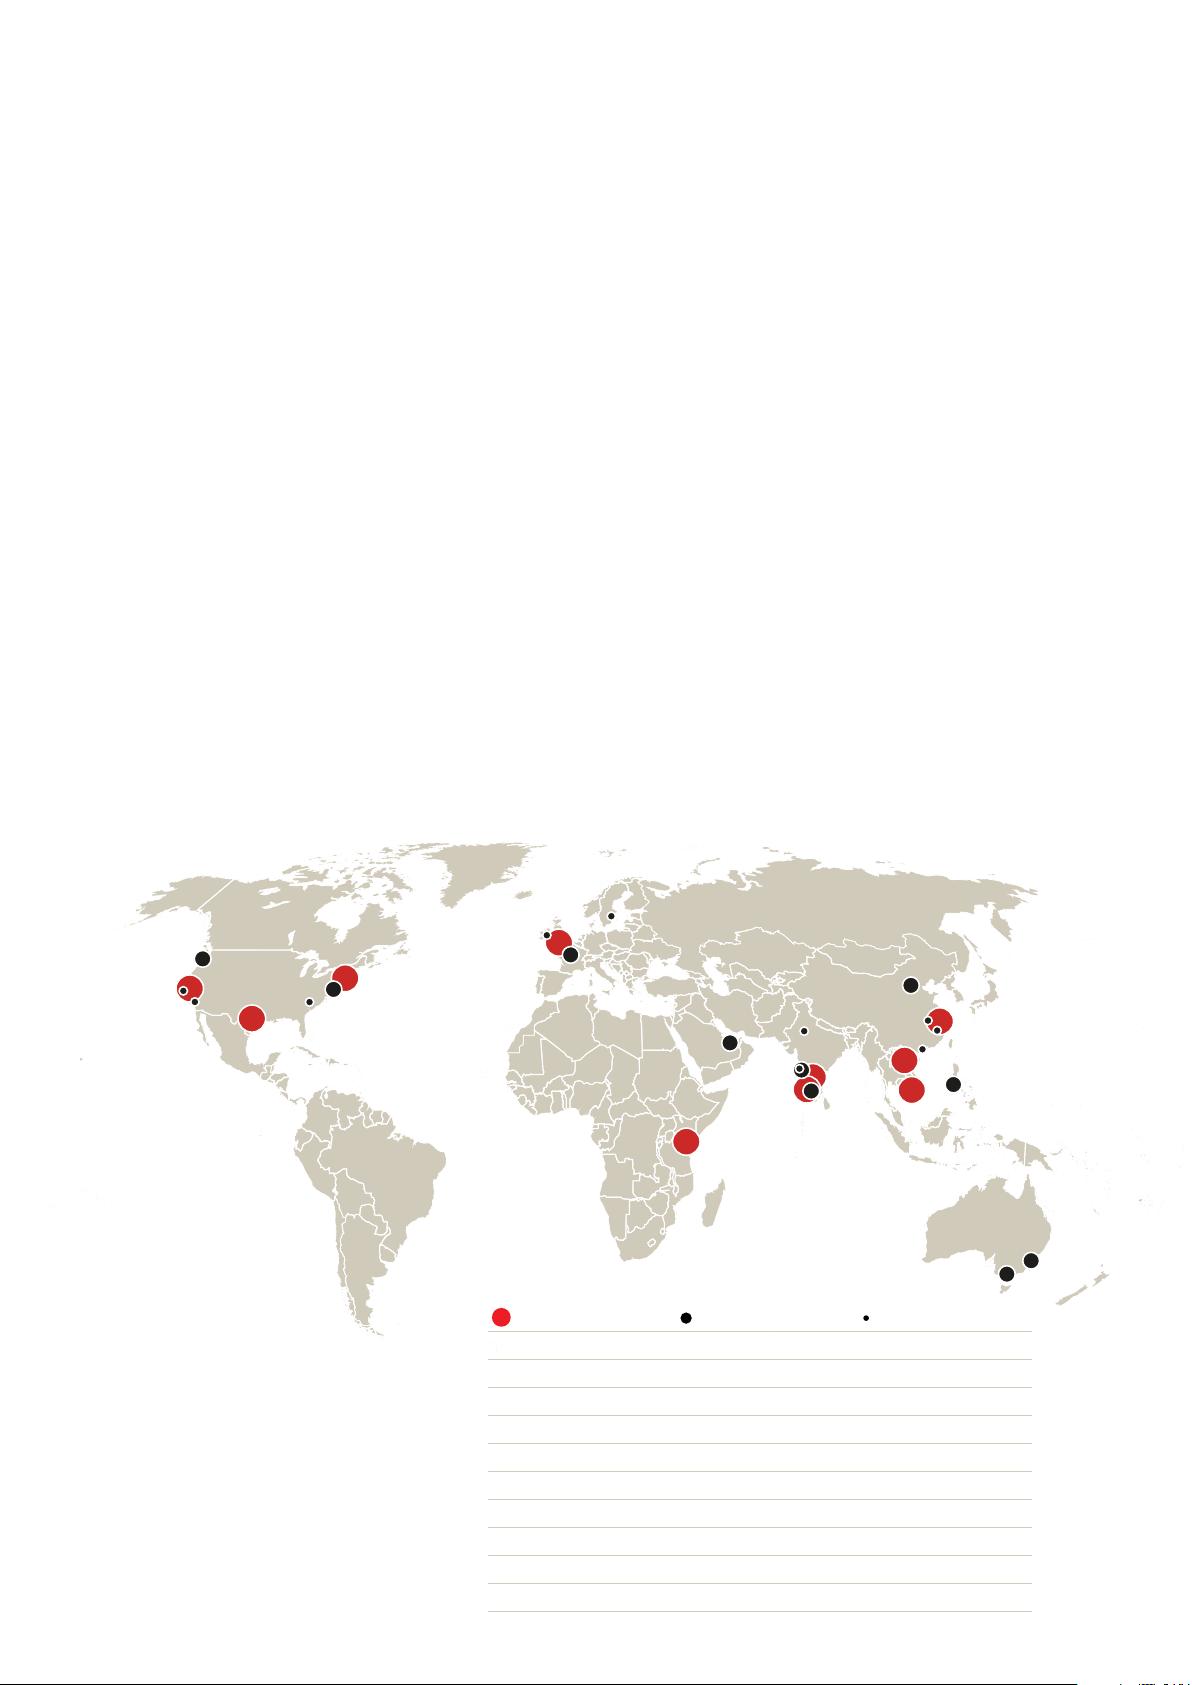
India’s Ascendancy: India has taken over from China as home to the world’s most dynamic cities.
Six Indian cities feature in the CMI Global Top 30, with the country’s primary technology hub,
Bangalore, moving into the top spot for the rst time.
The Ubiquity of Technology: Technology and innovation underpin the positions of many top
cities in the CMI, from Silicon Valley to Nairobi (Silicon Savannah). Strong technology credentials
support the presence in the Global Top 30 of several medium-sized U.S. cities such as Austin,
Boston, Seattle, San Francisco and Raleigh-Durham.
The Rise of Agile Emerging World Cities: The Global Top 30 now includes a number of the most
agile ‘Emerging World Cities’ that are successfully transitioning to higher-value activities. The best-
in-class examples are Shanghai, Shenzhen, Dubai, Bangalore and Hyderabad.
London’s Resilience: London has been knocked o the top position which it has held for the past
two years. Nonetheless, the city has shown impressive resilience following the EU referendum
and its inherent strengths in technology, innovation and education continue to support a Top 10
ranking.
Vietnamese Cities – the Hotspots for FDI: Vietnam has two representatives in the Top 10 – Ho Chi
Minh City and Hanoi. These cities have become a focus for foreign direct investment.
China’s Dynamic City Clusters: Clusters of dynamic cities are evolving in China as intra-regional
connectivity improves. This is evidenced by the appearance in the Global Top 30 of the Yangtze
River Delta cities of Shanghai, Hangzhou and Nanjing.
Australia’s Tier I Cities Outperform: Australia is represented by Melbourne and Sydney, whose
oice markets are expected to be among the top global performers in 2017.
Future-Proong of Northern European Cities: While European cities are largely absent from
the Global Top 30, several have the attributes to support longer-term momentum, combining
specialised knowledge industries, strong educational institutions and supportive living conditions.
Northern European cities dominate the top ranks for future-proong – including Stockholm,
Berlin, Munich and Amsterdam.
Environmental Constraints: Environmental issues are becoming more urgent. For example,
while Delhi and Beijing feature in the Global Top 30, their positions are compromised by poor
environmental scores.
Aordability Compromising Momentum: Aordability and space constraints are hindering
momentum in some cities. For example, San Francisco has fallen out of the Top 20 for the rst
time, while the absence of Hong Kong in the Global Top 30 can be partly ascribed to supply
constraints stiing momentum.
1
2
3
4
5
6
7
8
9
10
JLL City Momentum Index 2017 Edition5
Unpicking the City Momentum Index
The Asia Pacic Century
The Asia Pacic region is shown in the CMI 2017 to be home to more than half of the world’s 30 most
dynamic cities and real estate markets, testament to the rise of the region’s cities as major hubs of
commerce and innovation.
There has, however, been a realignment within Asia Pacic, with India supplanting China as home to the
region’s most dynamic cities:
• Bangalore tops the CMI 2017 for the rst time; its status as one of the world’s premier technology hubs
is supporting robust real estate demand. The Indian Tier II cities of Hyderabad and Pune are not so far
behind Bangalore in 5
th
and 13
th
positions respectively. India’s Tier I megacities of Chennai (18
th
), Delhi
(23
rd
) and Mumbai (25
th
) also feature in the Global Top 30, although their rankings are compromised by
poor scores on environmental sustainability.
• While China no longer dominates the top ranks, it is nonetheless still well represented in the Global Top
30 with three Tier I cities featuring – Shanghai (4
th
), Beijing (15
th
) and Shenzhen (23
rd
), as well as the
Yangtze River Delta cities of Hangzhou (26
th
) and Nanjing (29
th
). These ve cities have been among the
most successful in transitioning to higher-value activities. Shanghai is fast-tracking to maturity and is
set to join the top table of global gateway cities within the next few years. Shenzhen is cementing its
position as a global hub for hardware manufacturing as well as a regional nancial centre.
• Vietnam’s two major commercial hubs, Ho Chi Minh City (2
nd
) and Hanoi (8
th
), have made rapid progress
and now sit in the Global Top 10. Their success has been underpinned by favourable demographics and
signicant FDI as they take concrete steps to liberalise their business environments.
• Melbourne (12
th
) and Sydney (16
th
) represent Australia in the Global Top 30. Both cities are likely to be
among the leading global performers for oice rental growth in 2017, and longer-term momentum is
bolstered by their strengths in education, innovation and liveability.
• Manila (19
th
) appears in the Global Top 30 for the rst time, with a particularly dynamic oice market
supported by a growing and globally competitive BPO sector.
剩余20页未读,继续阅读
资源评论
chinadebug
- 粉丝: 0
- 资源: 1
上传资源 快速赚钱
- 我的内容管理 展开
- 我的资源 快来上传第一个资源
- 我的收益 登录查看自己的收益
- 我的积分 登录查看自己的积分
- 我的C币 登录后查看C币余额
- 我的收藏
- 我的下载
- 下载帮助
安全验证
文档复制为VIP权益,开通VIP直接复制
信息提交成功