没有合适的资源?快使用搜索试试~ 我知道了~
资源推荐
资源详情
资源评论
Debugging ASP.NET AJAX Applications
Dan Wahlin
The ability to debug code is a skill that every developer should have in their arsenal regardless of the
technology they’re using. It goes without saying that understanding the different debugging
options that are available can save a tremendous amount of time on a project and perhaps even
a few headaches. While many developers are accustomed to using Visual Studio .NET or Web
Developer Express to debug ASP.NET applications that use VB.NET or C# code, some aren’t
aware that it’s also extremely useful for debugging client-side code such as JavaScript. The
same type of techniques used to debug .NET applications can also be applied to AJAX-enabled
applications and more specifically ASP.NET AJAX applications.
In this article you’ll see how Visual Studio 2008 Beta 2 and several other tools can be used to debug
ASP.NET AJAX applications to quickly locate bugs and other issues. This discussion will include
information about enabling Internet Explorer 6 or higher for debugging, using Visual Studio 2008
and the Script Explorer to step through code as well as using other free tools such as Web
Development Helper. You’ll also learn how to debug ASP.NET AJAX applications in Firefox using
an extension named Firebug which lets you step through JavaScript code directly in the browser
without any other tools. Finally, you’ll be introduced to classes in the ASP.NET AJAX Library that
can help with various debugging tasks such as tracing and code assertion statements.
Before you try to debug pages viewed in Internet Explorer there are a few basic steps you’ll need to
perform to enable it for debugging. Let’s take a look at some basic setup requirements that
need to be performed to get started.
Configuring Internet Explorer for Debugging
Most people aren’t interested in seeing JavaScript issues encountered on a Website viewed with
Internet Explorer. In fact, the average user wouldn’t even know what to do if they saw an error
message. As a result, debugging options are turned off by default in the browser. However, it’s
very straightforward to turn debugging on and put it to use as you develop new AJAX
applications.
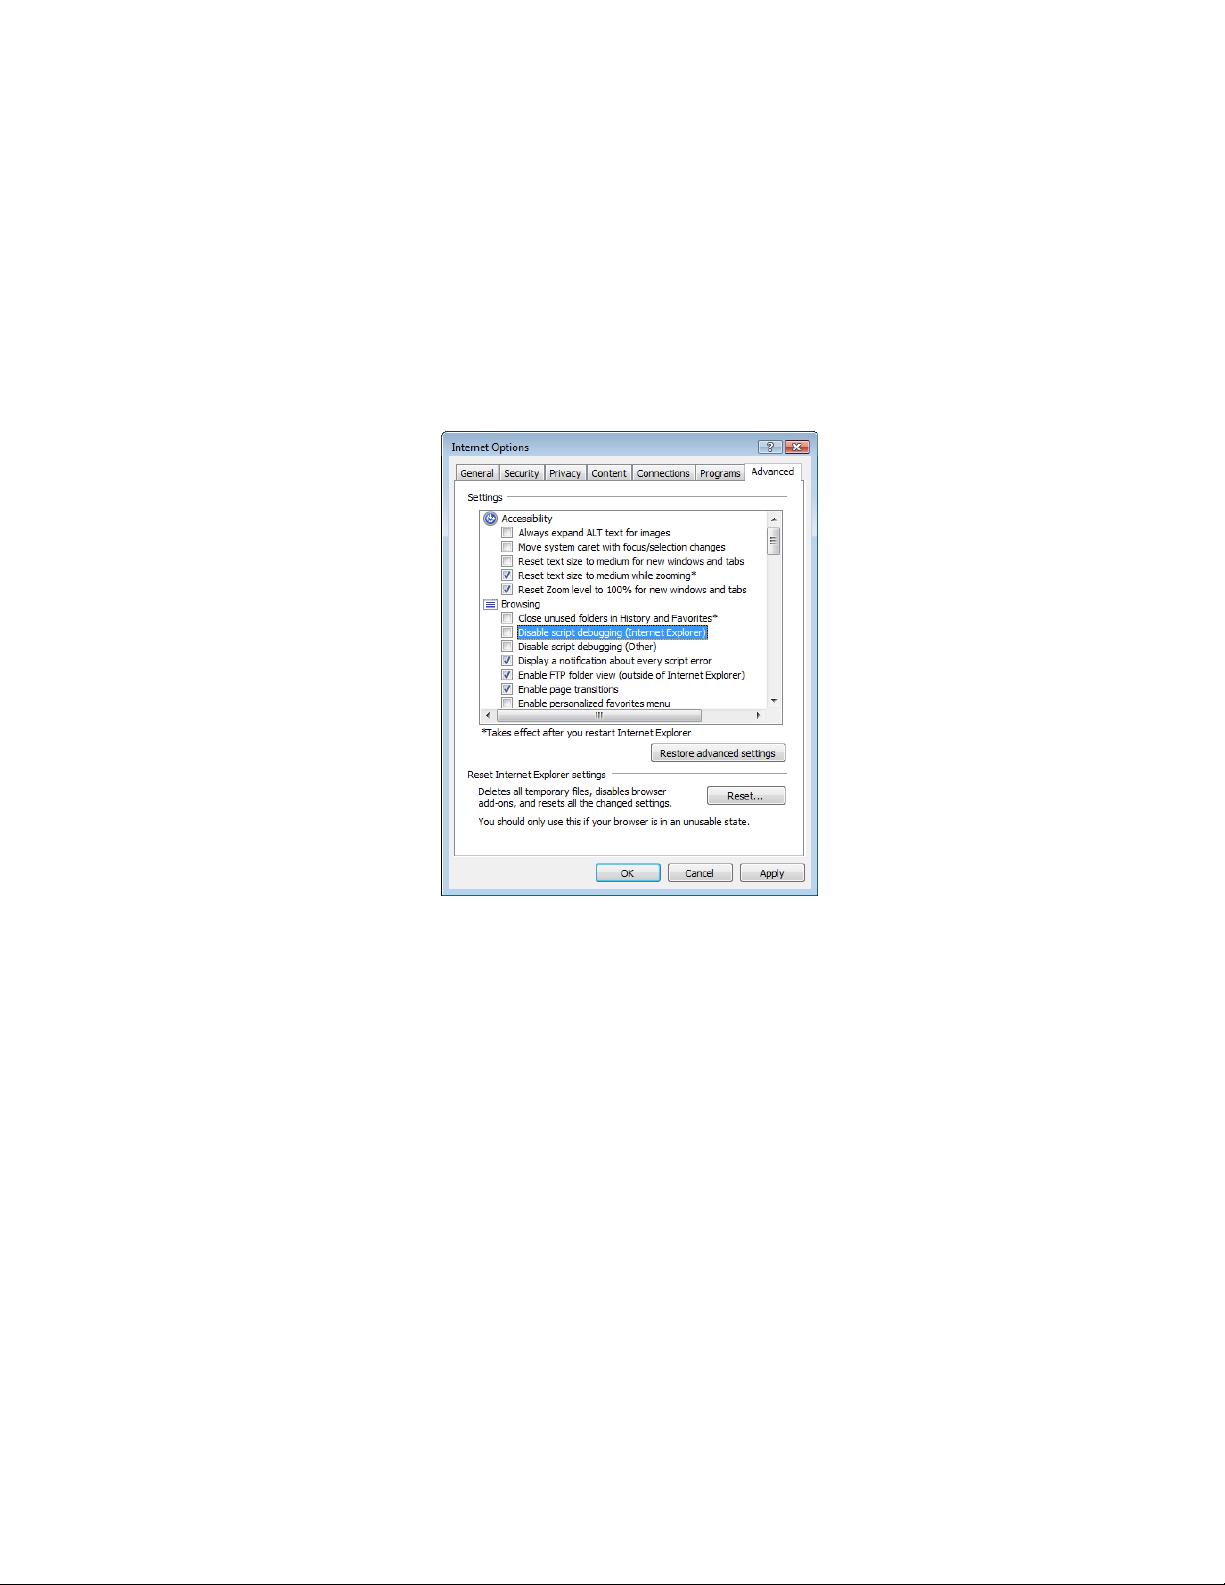
To enable debugging functionality, go to Tools Internet Options on the Internet Explorer menu
and select the Advanced tab. Within the Browsing section ensure that the following items are
unchecked:
Disable script debugging (Internet Explorer)
Disable script debugging (Other)
Although not required, if you’re trying to debug an application you’ll probably want any JavaScript
errors in the page to be immediately visible and obvious. You can force all errors to be shown
with a message box by checking the "Display a notification about every script error" checkbox.
While this is a great option to turn on while you’re developing an application, it can quickly
become annoying if you’re just perusing other Websites since your chances of encountering
JavaScript errors are pretty good.
Figure 1 shows what the Internet Explorer advanced dialog should look after it has been properly
configured for debugging.
Figure 1. Configuring Internet Explorer for debugging.
Once debugging has been turned on, you’ll see a new menu item appear in the View menu named
Script Debugger. It has two options available including Open and Break at Next Statement.
When Open is selected you’ll be prompted to debug the page in Visual Studio 2008 Beta 2 (note
that Visual Web Developer Express can also be used for debugging). If Visual Studio .NET is
currently running you can choose to use that instance or to create a new instance. When Break
at Next Statement is selected you’ll be prompted to debug the page when JavaScript code is
executed. If JavaScript code executes in the onLoad event of the page you can refresh the page
to trigger a debug session. If JavaScript code is run after a button is clicked then the debugger
will run immediately after the button is clicked.
Note: if you are running on Windows Vista with User Access Control (UAC) enabled, and you have
Visual Studio 2008 set to run as an administrator, Visual Studio will fail to attach to the process
when you are prompted to attach. To work around this issue, start Visual Studio first, and use
that instance to debug.
Although the next section will demonstrate how to debug an ASP.NET AJAX page directly from
within Visual Studio 2008, using the Internet Explorer Script Debugger option is useful when a
page is already open and you’d like to more fully inspect it.
Debugging with Visual Studio 2008 Beta 2
Visual Studio 2008 Beta 2 provides debugging functionality that developers around the world rely on
everyday to debug .NET applications. The built-in debugger allows you to step through code,
view object data, watch for specific variables, monitor the call stack plus much more. In
addition to debugging VB.NET or C# code, the debugger is also helpful for debugging ASP.NET
AJAX applications and will allow you to step through JavaScript code line by line. The details
that follow focus on techniques that can be used to debug client-side script files rather than
providing a discourse on the overall process of debugging applications using Visual Studio 2008.
The process of debugging a page in Visual Studio 2008 can be started in several different ways. First,
you can use the Internet Explorer Script Debugger option mentioned in the previous section.
This works well when a page is already loaded in the browser and you’d like to start debugging
it. Alternatively, you can right-click on an .aspx page in the Solution Explorer and select Set As
Start Page from the menu. If you’re accustomed to debugging ASP.NET pages then you’ve
probably done this before. Once F5 is pressed the page can be debugged. However, while you
can generally set a breakpoint anywhere you’d like in VB.NET or C# code, that’s not always the
case with JavaScript as you'll see next.
Embedded Versus External Scripts
The Visual Studio 2008 debugger treats JavaScript embedded in a page different than external
JavaScript files. With external script files, you can open the file and set a breakpoint on any line
you choose. Breakpoints can be set by clicking in the grey tray area to the left of the code editor
window. When JavaScript is embedded directly into a page using the <script> tag, setting a
breakpoint by clicking in the grey tray area isn’t an option. Attempts to set a breakpoint on a
line of embedded script will result in a warning that states "This is not a valid location for a
breakpoint".
You can get around this issue by moving the code into an external .js file and referencing it using the
src attribute of the <script> tag:
<script type="text/javascript" src="Scripts/YourScript.js"></script>
What if moving the code into an external file isn’t an option or requires more work than it's worth?
While you can’t set a breakpoint using the editor, you can add the debugger statement directly
into the code where you’d like to start debugging. You can also use the Sys.Debug class
available in the ASP.NET AJAX library to force debugging to start. You’ll learn more about the
Sys.Debug class later in this article.
An example of using the debugger keyword is shown in Listing 1. This example forces the debugger
to break right before a call to an update function is made.
Listing 1. Using the debugger keyword to force the Visual Studio .NET debugger to break.
function BuildPerson()
{
var person =
{
FirstName: $get("txtFirstName").value,
LastName: $get("txtLastName").value,
Address:
{
Street: $get("txtStreet").value,
City: $get("txtCity").value,
State: $get("txtState").value
}
};
debugger;
UpdatePerson(person);
}
Once the debugger statement is hit you will be prompted to debug the page using Visual Studio .NET
and can begin stepping through the code. While doing this you may encounter an issue with
accessing ASP.NET AJAX library script files used in the page so let's take a look at using Visual
Studio .NET's Script Explorer.
Using Visual Studio .NET Windows to Debug
Once a debug session is started and you begin walking through code using the default F11 key, you
may encounter the error dialog shown in see Figure 2 unless all script files used in the page are
open and available for debugging.
Figure 2. Error dialog shown when no source code is available for debugging.
This dialog is shown because Visual Studio .NET isn't sure how to get to the source code of some of
the scripts referenced by the page. While this can be quite frustrating at first, there's a simple
fix. Once you have started a debug session and hit a breakpoint, go to the Debug Windows
Script Explorer window on the Visual Studio 2008 menu or use the Ctrl+Alt+N hotkey.
剩余18页未读,继续阅读
资源评论
cheyong007
- 粉丝: 18
- 资源: 66
上传资源 快速赚钱
- 我的内容管理 展开
- 我的资源 快来上传第一个资源
- 我的收益 登录查看自己的收益
- 我的积分 登录查看自己的积分
- 我的C币 登录后查看C币余额
- 我的收藏
- 我的下载
- 下载帮助
安全验证
文档复制为VIP权益,开通VIP直接复制
信息提交成功