61
Bulletin of the American Meteorological Society
1. Introduction
Wavelet analysis is becoming a common tool for
analyzing localized variations of power within a time
series. By decomposing a time series into time–fre-
quency space, one is able to determine both the domi-
nant modes of variability and how those modes vary
in time. The wavelet transform has been used for nu-
merous studies in geophysics, including tropical con-
vection (Weng and Lau 1994), the El Niño–Southern
Oscillation (ENSO; Gu and Philander 1995; Wang and
Wang 1996), atmospheric cold fronts (Gamage and
Blumen 1993), central England temperature (Baliunas
et al. 1997), the dispersion of ocean waves (Meyers et
al. 1993), wave growth and breaking (Liu 1994), and
coherent structures in turbulent flows (Farge 1992). A
complete description of geophysical applications can
be found in Foufoula-Georgiou and Kumar (1995),
while a theoretical treatment of wavelet analysis is
given in Daubechies (1992).
Unfortunately, many studies using wavelet analy-
sis have suffered from an apparent lack of quantita-
tive results. The wavelet transform has been regarded
by many as an interesting diversion that produces col-
orful pictures, yet purely qualitative results. This mis-
conception is in some sense the fault of wavelet analy-
sis itself, as it involves a transform from a one-dimen-
sional time series (or frequency spectrum) to a diffuse
two-dimensional time–frequency image. This diffuse-
ness has been exacerbated by the use of arbitrary nor-
malizations and the lack of statistical significance tests.
In Lau and Weng (1995), an excellent introduction
to wavelet analysis is provided. Their paper, however,
did not provide all of the essential details necessary
for wavelet analysis and avoided the issue of statisti-
cal significance.
The purpose of this paper is to provide an easy-to-
use wavelet analysis toolkit, including statistical sig-
nificance testing. The consistent use of examples of
A Practical Guide to
Wavelet Analysis
Christopher Torrence and Gilbert P. Compo
Program in Atmospheric and Oceanic Sciences, University of Colorado, Boulder, Colorado
ABSTRACT
A practical step-by-step guide to wavelet analysis is given, with examples taken from time series of the El Niño–
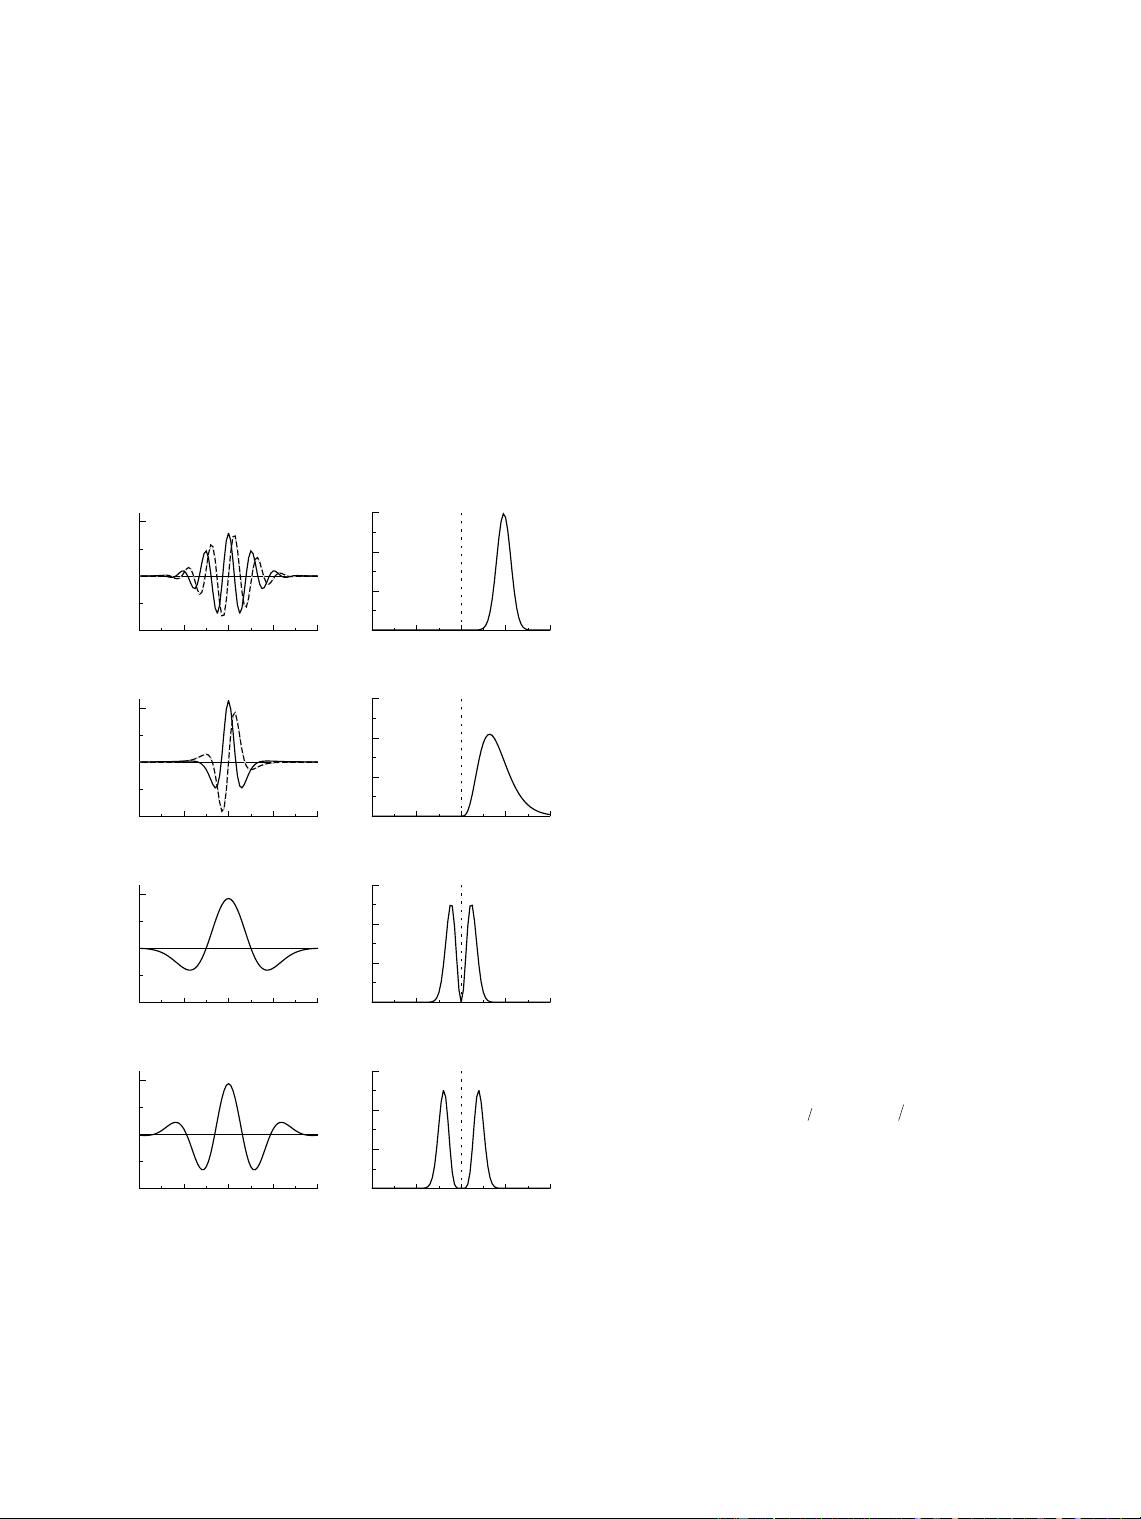
Southern Oscillation (ENSO). The guide includes a comparison to the windowed Fourier transform, the choice of an
appropriate wavelet basis function, edge effects due to finite-length time series, and the relationship between wavelet
scale and Fourier frequency. New statistical significance tests for wavelet power spectra are developed by deriving theo-
retical wavelet spectra for white and red noise processes and using these to establish significance levels and confidence
intervals. It is shown that smoothing in time or scale can be used to increase the confidence of the wavelet spectrum.
Empirical formulas are given for the effect of smoothing on significance levels and confidence intervals. Extensions to
wavelet analysis such as filtering, the power Hovmöller, cross-wavelet spectra, and coherence are described.
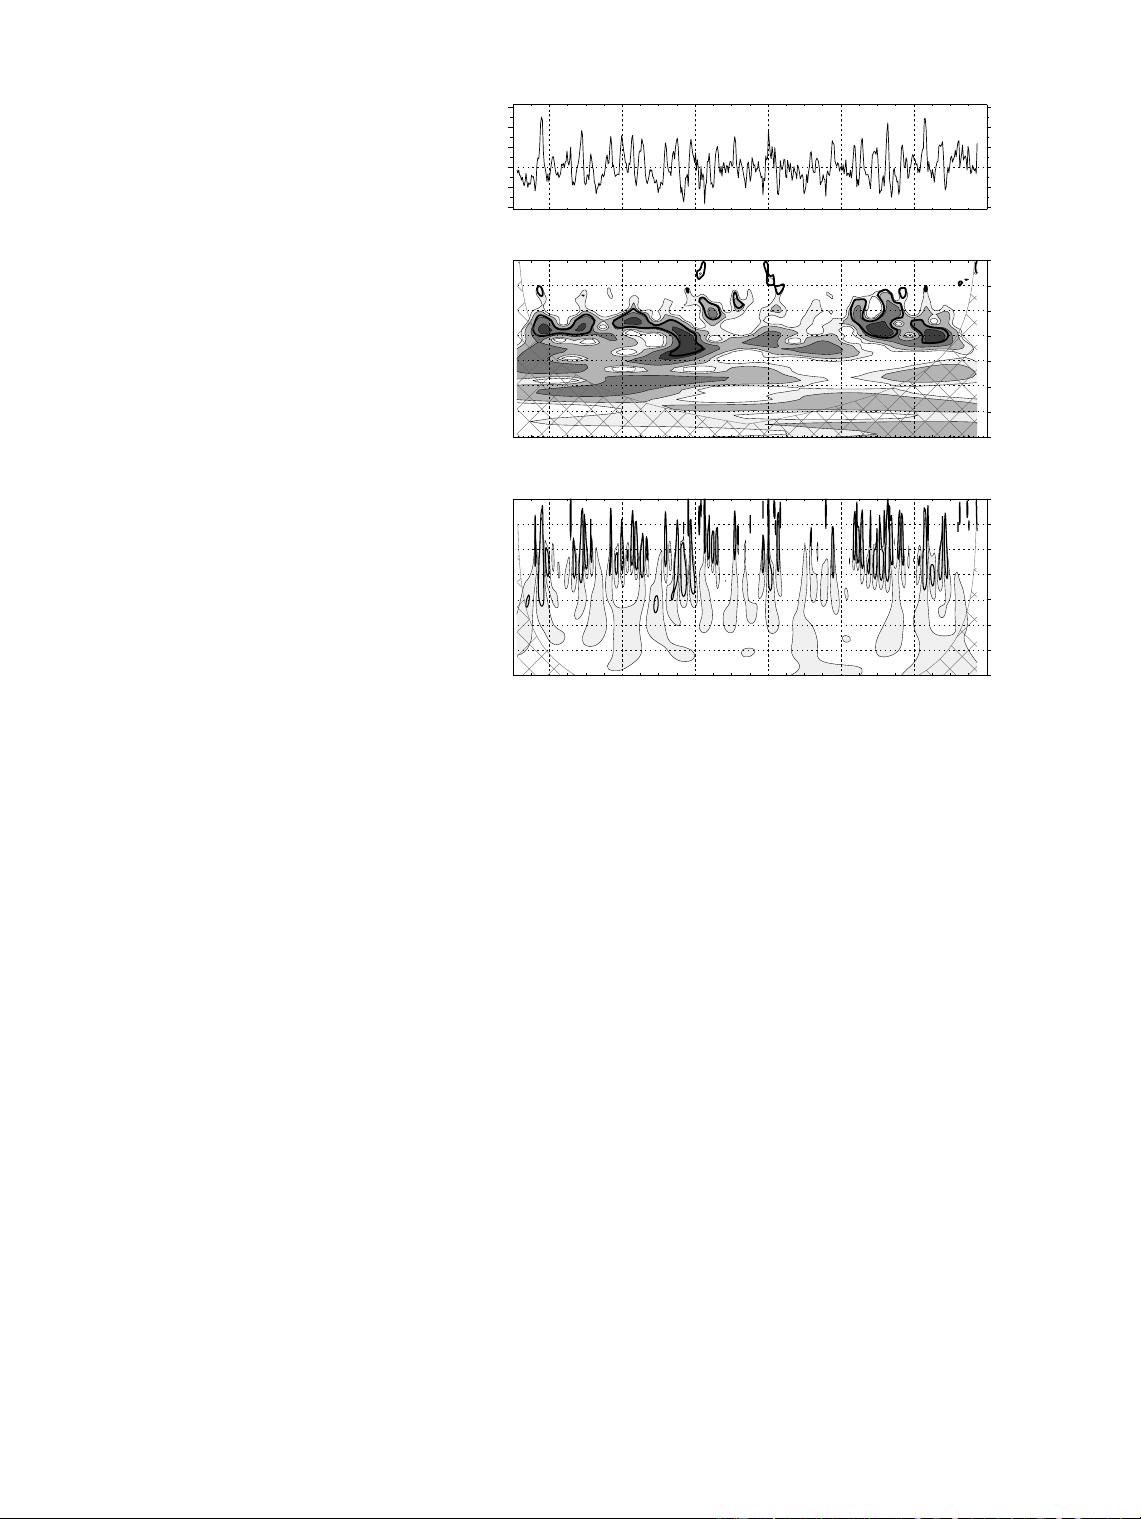
The statistical significance tests are used to give a quantitative measure of changes in ENSO variance on interdecadal
timescales. Using new datasets that extend back to 1871, the Niño3 sea surface temperature and the Southern Oscilla-
tion index show significantly higher power during 1880–1920 and 1960–90, and lower power during 1920–60, as well
as a possible 15-yr modulation of variance. The power Hovmöller of sea level pressure shows significant variations in
2–8-yr wavelet power in both longitude and time.
Corresponding author address: Dr. Christopher Torrence, Ad-
vanced Study Program, National Center for Atmospheric Re-
search, P.O. Box 3000, Boulder, CO 80307-3000.
E-mail: torrence@ucar.edu
In final form 20 October 1997.
©1998 American Meteorological Society