2016 Nature 新药上市销售放量曲线
需积分: 0 124 浏览量
2024-06-20
22:23:34
上传
评论
收藏 478KB PDF 举报

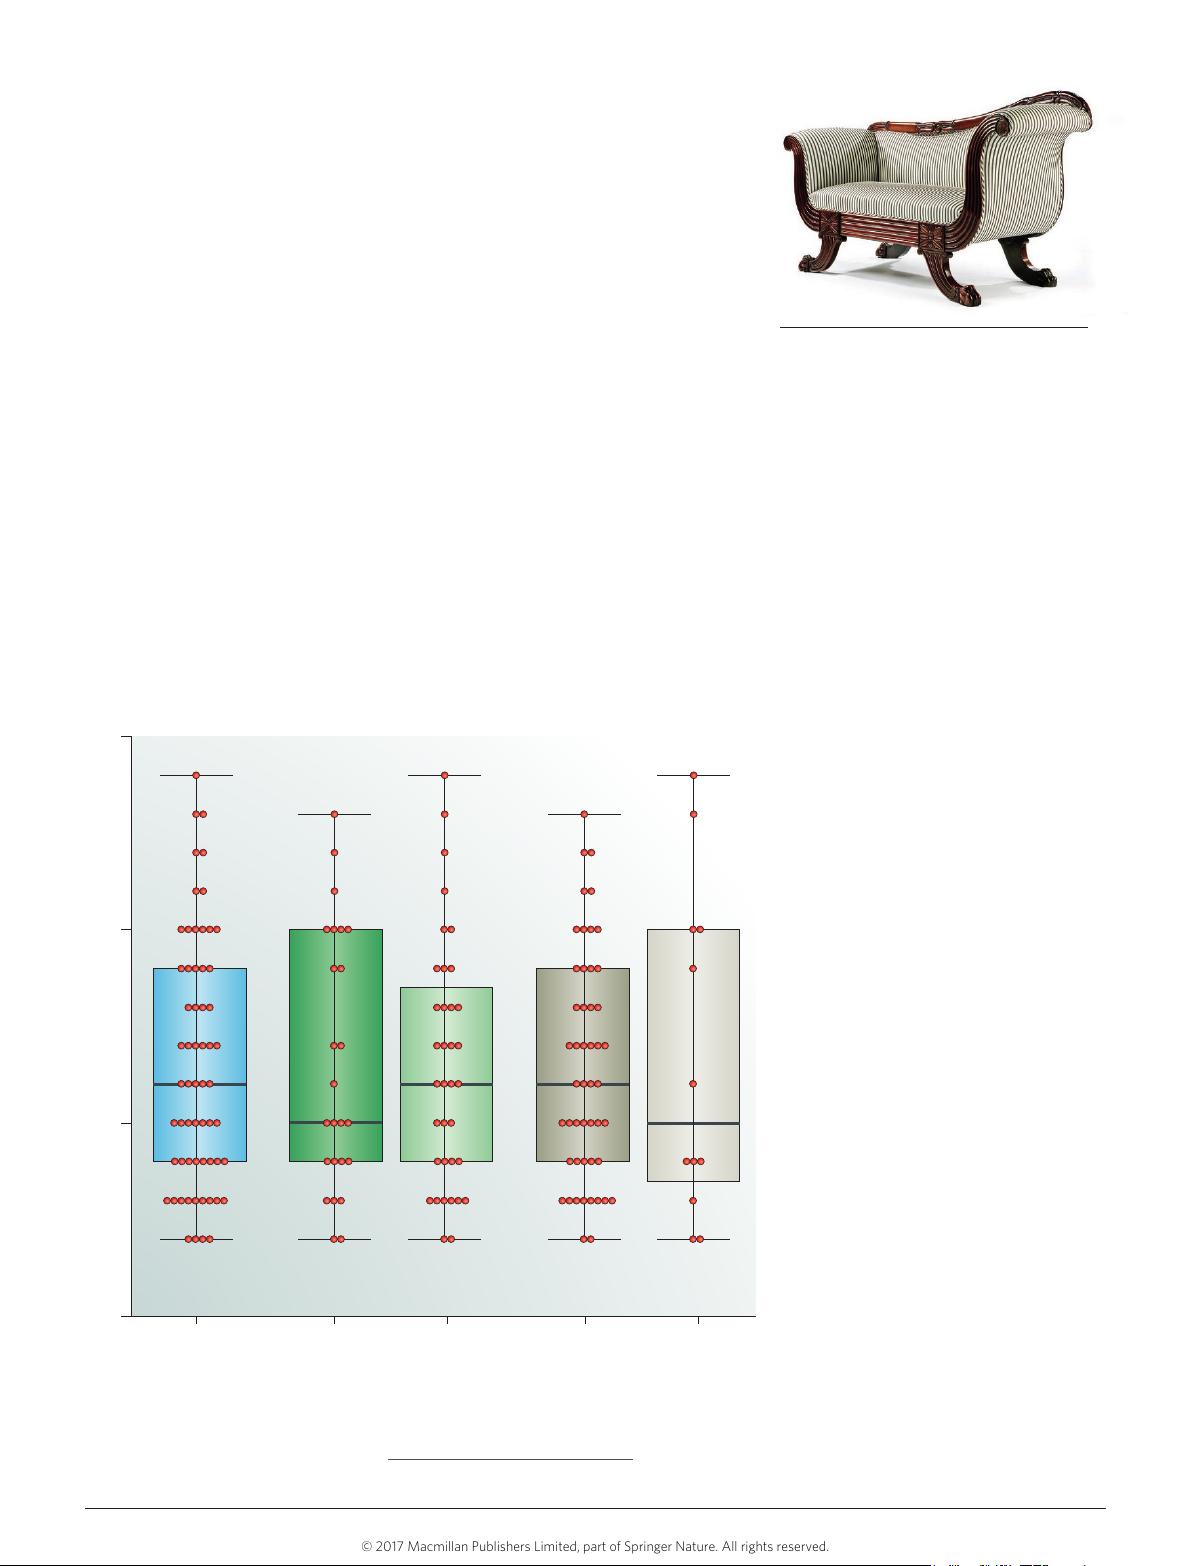
Nature Reviews | Drug Discovery
Time to peak sales (years)
All drugs
(n
=
61)
Pioneers
(n
=
25)
Followers
(n
=
36)
Non-biologics
(n
=
49)
Biologics
(n
=
12)
15
10
5
0
NEWS & ANALYSIS
FROM THE ANALYST’S COUCH
Drug launch curves
in the modern era
Seth Robey and Frank S.David
Image from Quinn/Alamy Stock Photo
How quickly will a drug in development
reach peak revenues after launch? Anyone
who builds financial models in the
pharmaceutical industry has wrestled
with this question — which is to say,
every investor, analyst, banker, dealmaker,
commercial team, franchise head and senior
executive in the sector, not to mention scores
of consultants and journalists focused on
drug development and commercialization.
The shape of the launch curve can
dramatically affect financial models of
pre-commercial drugs. Because revenues are
discounted to account for the ‘time value of
money’, a fast ramp has an outsized effect
on the projected net present value (NPV).
Shortening the projected time to peak sales
by even 20% — say, from 5 years to 4 — can
radically change the apparent attractiveness
of an asset to both financial and strategic
investors.
Particularly for assets in the early stages
of R&D that are many years away from the
market, it is often most practical to base
the launch trajectory on general heuristics,
rather than commercial analogues. The most
commonly used launch curve assumptions
are based on an econometric model
developed by Bauer and Fischer in 2000
(Int. Bus. Rev. 9, 703–725; 2000), which
showed that ‘pioneer’ drugs (first in a
therapeutic area or class) have a slower
uptake compared with ‘followers’ —
approximately 8 years for the former,
versus 3–4 years for thelatter.
Bauer and Fischer’s work (and a follow-up
analysis using similar methodology and data
(Quant. Mark. Econ. 8, 429–460; 2010)) was
pioneering and mathematically rigorous,
but it has several limitations that affect its
applicability to forecasting contemporary
drug launches. First, the narrow therapeutic
and pharmacological spectrum of agents
studied — 36 agents in just four classes of
cardiovascular drugs — is unrepresentative
of the diversity of the industry today. Second,
their model encompassed launches in
both the United States and five European
countries, which may mask underlying
geographical differences in the market
uptake of new agents. And finally, their
analysis of launches from 1982 to 1990 is
now several decades old, and may not reflect
the evolution of the broader pharmaceutical
market and companies’ approaches to drug
commercialization.
Developing an updated framework
To develop a set of assumptions more
applicable to contemporary pharmaceutical
commercial models, we examined US sales
trajectories (in extended units) of all
70 prescription drugs approved by the FDA
from 2000 to 2002, which we corrected
to account for population growth and
normalized to peak unit sales. After removing
aberrant curves (peaking in the first year after
launch or the last year of our data set), we
analysed 61 drug launches, encompassing a
broad range of pharmacological mechanisms
of action and therapeutic areas. We subdivided
the drugs into pioneers and followers, based
on the assignments of these drugs in a previous
study that defined a methodology to classify
drugs as ‘first in class’, ‘advance in class’ and
‘addition to class’ (Health Aff. 32, 1433–1439;
2013), considering ‘first in class’ and ‘advance
in class’ as ‘pioneers’ and ‘addition to class’
as ‘followers’. We also separately subdivided
the drugs into biologics and non-biologics,
with biologics defined as those drugs
produced by recombinant DNA technology
▶
Figure 1 | Distribution of times to peak sales for drugs launched in the United States,
2000–2002. The 61 drugs (data points shown as red circles) were also divided into subsets in
two ways for comparison: pioneers versus followers and non-biologics versus biologics. Boxes
encompass interquartile ranges; whiskers encompass full ranges of data. Differences between the
subsets were not statistically significant. See Supplementary information S1 (box) for details.
NATURE REVIEWS
|
DRUG DISCOVERY VOLUME 16
|
JANUARY 2017
|
13
©
2
0
1
7
M
a
c
m
i
l
l
a
n
P
u
b
l
i
s
h
e
r
s
L
i
m
i
t
e
d
,
p
a
r
t
o
f
S
p
r
i
n
g
e
r
N
a
t
u
r
e
.
A
l
l
r
i
g
h
t
s
r
e
s
e
r
v
e
d
.
资源评论


