没有合适的资源?快使用搜索试试~ 我知道了~
ANALYSIS GROUP:2022年全球App Store生态报告.pdf
需积分: 0 0 下载量 137 浏览量
2023-08-08
16:56:13
上传
评论
收藏 3.57MB PDF 举报
温馨提示
试读
32页
ANALYSIS GROUP:2022年全球App Store生态报告
资源推荐
资源详情
资源评论
Support for this study was provided by Apple.
The conclusions and opinions expressed are exclusively those of the authors.
The Continued Growth and Resilience
of Apple’s App Store Ecosystem
Juliee Caminade, Ph.D.
Jonathan Borck, Ph.D.
May 2023
The Continued Growth and Resilience of Apple’s App Store Ecosystem
1
The App Store ecosystem: 2022 at a glance
The App Store ecosystem facilitated a groundbreaking $1.1 trillion in billings and sales worldwide in 2022. More than 90%
of this figure originated from transactions that did not happen through the App Store, meaning that these amounts
accrued solely to developers and other third parties, and that Apple collected no commission on them.
Over the past few years, through the ebbs and flows of the COVID-19 pandemic, the App Store ecosystem grew at a
substantial and remarkably steady rate (between 27% and 29% annually), consistent with a flourishing marketplace.
This steady overall growth hides important variations within app categories that reflect consumers’ changing habits as
the pandemic evolved. For example, some categories grew substantially in 2022 as many people returned to in-person
activities, with travel (up 84%) and ride hailing services (up 45%) leading the way. Other categories, such as grocery sales,
food delivery, and digital goods and services consumed on iOS apps, grew more modestly in 2022 aer booming at the
height of the pandemic. In-app advertising on iOS apps grew at a faster pace in 2022 than 2021, driven by the strong
performance of social media, podcasts, and general retail apps.
Variations across regions were also notable, with a number of factors at play in certain regions in a challenging global
economic environment: Inflation, a stronger US dollar, and regulatory headwinds in the video game industry in China.
These factors should be considered when interpreting our global results and regional variations.
Fieen years of the App Store
The App Store has been a safe and secure home to a large and varied array of apps for 15 years. Users today have
access to over 123 times more apps than they did at the end of 2008, and annual downloads on the App Store
increased 15-fold between 2009 and 2022. Users have downloaded apps more than 370 billion times and developers
have earned more than $320 billion in earnings directly on the App Store since its launch. Over the past 15 years, the
App Store has supported new and growing sectors of the economy and has provided businesses with new ways to
engage with customers and lower costs.
Apple has implemented rules and policies, such as the strict App Review process, to foster user trust. These
policies have prevented billions of dollars in fraudulent transactions. Apple has also supported developers over
the past 15 years through a variety of technical tools, analytics, and education initiatives, all of which have helped
developers add new functionality to their apps, track their performance on the App Store, and receive support from
Apple experts.
$1.1
trillion
ecosystem in 2022
+29%
growth in the
ecosystem in 2022
+84%
in iOS-app-based
travel sales in 2022
+45%
in iOS-app-based
ride hailing sales in
2022
The Continued Growth and Resilience of Apple’s App Store Ecosystem
2
The App Store ecosystem
The App Store ecosystem globally in 2022
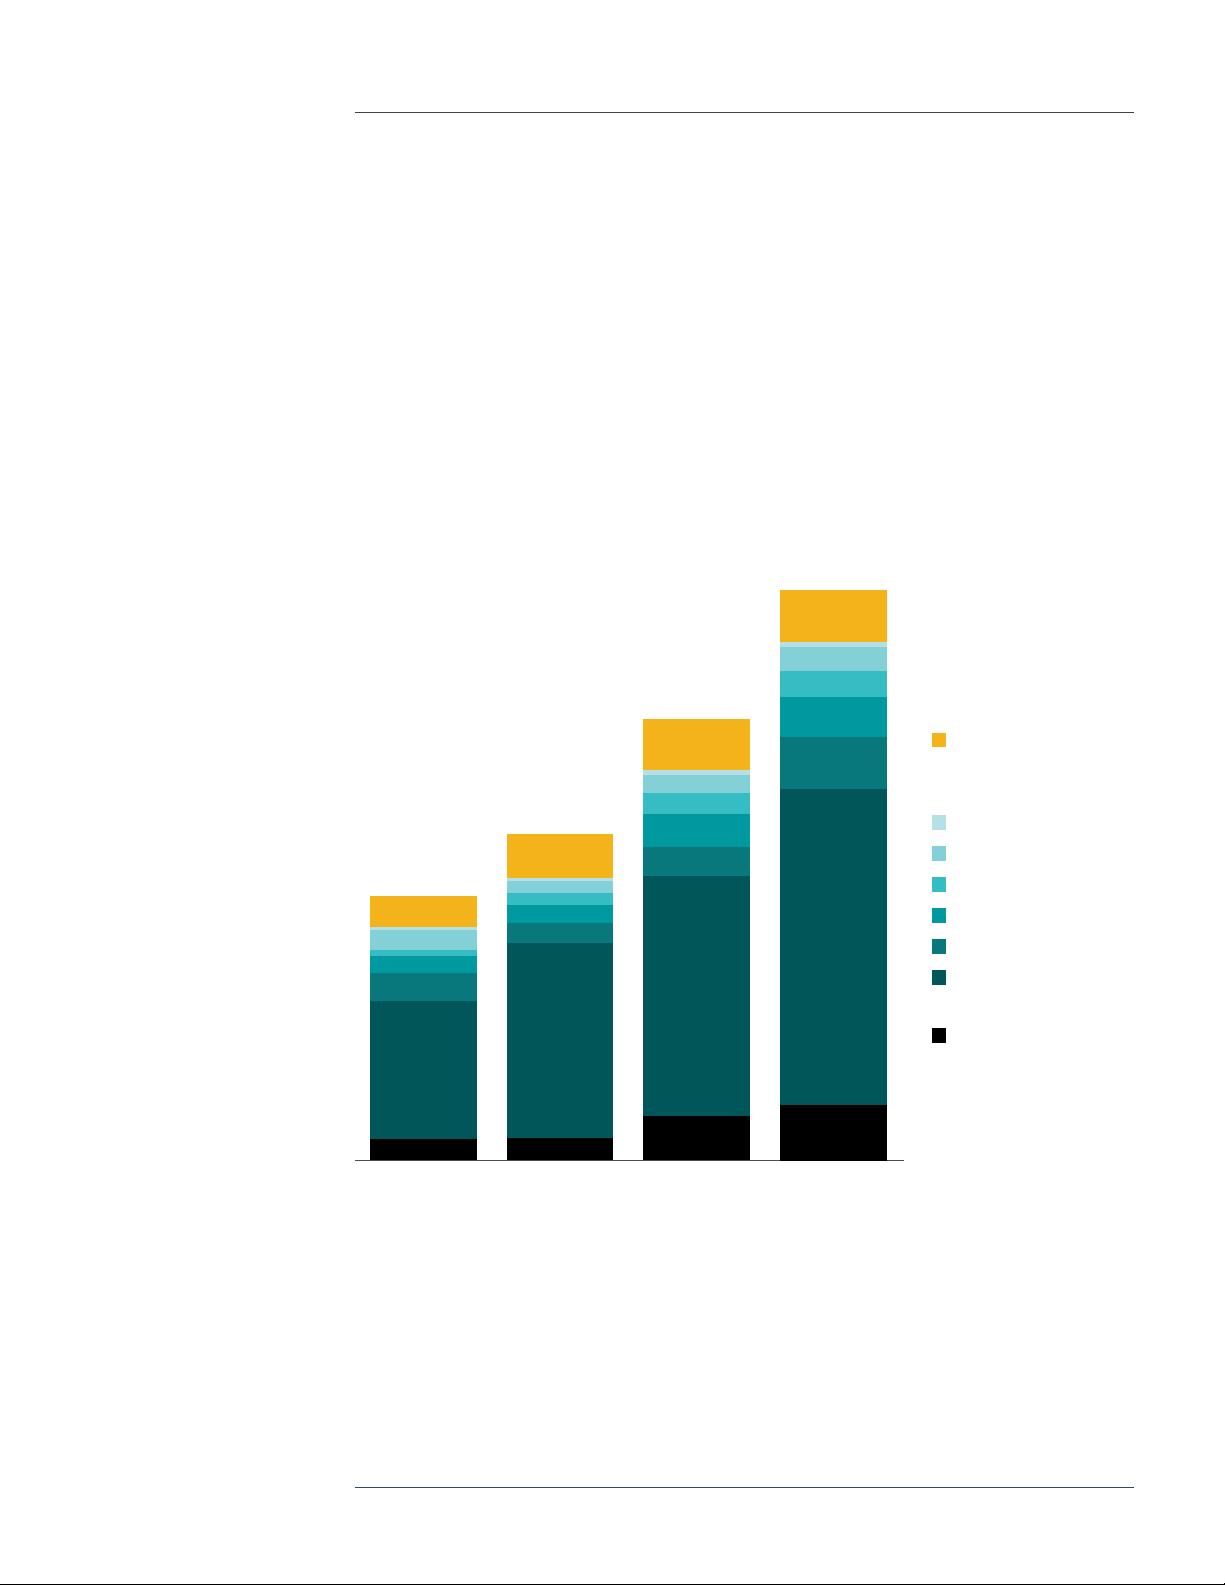
We estimate that the App Store ecosystem facilitated more than $1.1 trillion in billings
and sales worldwide in 2022, up from $868 billion in 2021, $643 billion in 2020, and $519
billion in 2019. Of that total, $104 billion, or 9%, originated from billings and sales of digital
goods and services consumed on iOS apps; $910 billion, or 81%, from sales of physical
goods and services made on iOS apps; and $109 billion, or 10%, from in-app advertising on
iOS devices. (See Table 1.)
Apple only collects a commission on app purchases, in-app purchases, and in-app
subscriptions that go through the App Store. No commission is collected on purchases
of digital goods and services that happen outside of apps (e.g., purchasing a subscription
to a newspaper through a web browser), on purchases of physical goods and services
through apps (e.g., when a user pays for a ride on a ride hailing app or buys groceries
online), or on in-app ad revenue. More than 90% of the $1.1 trillion in billings and sales
facilitated by the ecosystem occurred outside the App Store, meaning that these
amounts accrued solely to developers and other third parties and that Apple collected
no commission on them. The share of billings and sales that accrue solely to developers
has continued to increase year-to-year. (See Appendix Table 1 for further methodological
details.)
Table 1: Estimated Billings and Sales Facilitated by the App Store Ecosystem, Worldwide,
2019-2022 ($ Billion)*
2019 2020 2021 2022
Digital Goods and Services** $61 $86 $102 $104
Physical Goods and Services $413 $511 $678 $910
M-Commerce
General Retail $268 $383 $471 $621
Travel $57 $38 $56 $102
Food Delivery and Pickup $31 $36 $66 $77
Grocery $14 $22 $43 $52
Ride Hailing $40 $26 $33 $48
Digital Payment $4 $5 $9 $10
In-App Advertising*** $45 $46 $88 $109
Total $519 $643 $868 $1,123
* Totals may not sum due to rounding.
** Billings and sales from digital goods and services are not the same as App Store billings. We include sales from digital goods and services purchased elsewhere
but used on apps on Apple devices, and we subtract billings from in-app purchases made via the App Store but used elsewhere. The estimate relies on third-
party sources and Apple data. See Appendix for details.
*** iOS in-app ad revenue; does not include mobile web, search ads, and Apple Search ads.
In 2022, over
90%
of billings and
sales facilitated
by the ecosystem
occurred outside
the App Store.
Billings and Sales
“Billings” refers to app
purchases and in-app
purchases, including
subscriptions, which use
Apple's in-app payment.
“Sales” refers to money
spent by customers
purchasing goods and
services in general. We use
the term “facilitated” to
include the various ways
in which apps contribute
to generating billings and
sales.
The Continued Growth and Resilience of Apple’s App Store Ecosystem
3
As in previous years, most of the billings and sales facilitated by the App Store ecosystem
came from the sales of physical goods and services through iOS apps. Of those, general
retail remained the largest category by far. Two other categories jockeyed for the next
two spots: In 2021, food delivery and pickup temporarily surpassed travel as the second-
largest category, while in 2022, travel once again was number two, with $102 billion in sales
through the App Store. (See Figure 1.) The consistently high amount of sales of physical
goods and services demonstrates that the App Store ecosystem continues to provide
a trusted platform for developers to sell such products. For example, Apple Pay is an
important tool that supports developers in this segment: Apple Pay offers a standardized,
secure, and seamless way for customers to pay for physical goods and services in-app.
Figure 1: Estimated Billings and Sales Facilitated by the App Store Ecosystem by App
Category, 2019-2022 ($ Billion)*
Digital Goods and Services**
Physical Goods and Services
Digital Payment
Ride Hailing
Grocery
Food Delivery and Pickup
Travel
General Retail
In-App Advertising***
* Totals may not sum due to rounding.
** Billings and sales from digital goods and services are not the same as App Store billings.
*** iOS in-app ad revenue; does not include mobile web, search ads, and Apple Search ads.
$519
2019
$45
$57
$31
$40
$61
$14
$4
$268
$36
$86
$22
$5
$643
2020
$46
$38
$26
$383
$868
2021
$88
$38
$56
$66
$102
$43
$33
$9
$471
$1,123
2022
$109
$38
$102
$77
$104
$52
$48
$621
$10
Methodology
“iOS apps” include apps on
iPhone and iPad devices.
Apps developed by Apple,
such as Apple Music, as
well as mobile browser
apps, such as Google
Chrome, are excluded from
this analysis. Third-party
apps featured within Apple
TV are included in our
analysis of video streaming.
Categories as presented in
this report do not reflect
App Store categories.
In-App Ad Sales
Estimates of in-app ad
sales for iOS apps include
revenue generated
from the publishing of
advertisements within
apps only. Estimates do
not include advertising on
mobile web (such as on
mobile browser apps) or
search advertising, such as
Apple Search Ads.
The Continued Growth and Resilience of Apple’s App Store Ecosystem
4
Estimating the size of the App Store ecosystem
The direct monetization of apps represents a small fraction of the overall commerce
the App Store facilitates, because developers can monetize their apps in several
ways that do not involve payments through the App Store, such as:
1. Selling digital goods and services outside of the App Store for use within apps
on Apple devices (e.g., news and magazine subscriptions, music and video
streaming)
2. Selling physical goods and services through apps on Apple devices (e.g., food
and grocery delivery or ride hailing)
3. Offering ad-supported content within apps (e.g., ad-supported games)
While our analysis captures the major app monetization strategies, we do not capture
all of the ways in which the App Store ecosystem facilitates sales or all of the benefits
created by apps. For example, we do not include benefits that companies derive from
“companion apps” that raise the value of their goods and services, including smart
home apps (e.g., Nest, Ring) and health apps, among many others.
A complete description of our methodology is included in the Appendix.
To read about our estimates of billings and sales facilitated by the App Store in
2019 and 2020, please see our previous reports: How Large Is the Apple App Store
Ecosystem? and A Global Perspective on the Apple App Store Ecosystem.
剩余31页未读,继续阅读
资源评论
科研萌新
- 粉丝: 3
- 资源: 305
上传资源 快速赚钱
- 我的内容管理 展开
- 我的资源 快来上传第一个资源
- 我的收益 登录查看自己的收益
- 我的积分 登录查看自己的积分
- 我的C币 登录后查看C币余额
- 我的收藏
- 我的下载
- 下载帮助
安全验证
文档复制为VIP权益,开通VIP直接复制
信息提交成功