没有合适的资源?快使用搜索试试~ 我知道了~
麦格理-中国-乳制品行业-中国乳业:上游板块上升-117-50页.pdf
需积分: 0 0 下载量 71 浏览量
2023-07-27
15:04:03
上传
评论
收藏 2.48MB PDF 举报
温馨提示
试读
50页
麦格理-中国-乳制品行业-中国乳业:上游板块上升-117-50页.pdf
资源推荐
资源详情
资源评论
Please refer to page 48 for important disclosures and analyst certification, or on our website
www.macquarie.com/research/disclosures.
17 January 2019 Greater China
EQUITIES
Inside
Global dairy valuation table 2
Upstream: demand to ougrow supply; raw milk
price up 5% YoY 3
Downstream: prisoner’s dilemma, so easing
competition will be mild 8
IMF: Turning cautious as one child
policy relaxation benefit is winding down 16
China Modern Dairy (1117 HK) 22
Want Want China (151 HK) 28
Yili (A-Share) (600887 CH) 32
China Mengniu Dairy Company (2319 HK) 37
Bright Dairy (A-Share) (600597 CH) 42
Health & Happiness (H&H) (1112 HK) 45
Yashili International (1230 HK) 49
Analysts
Macquarie Capital Limited
Linda Huang, CFA +852 3922 4068
Sunny Chow +852 3922 3768
Cici Yu +86 21 2412 9078
China Dairy Industry
Upstream sector on the ascendant
Key points
5% raw milk price rise expected as demand outgrows supply in upstream.
Prisoner’s dilemma in downstream, so competition is unlikely to ease much.
Cautious on IMF as bonus from One-child Policy relaxation winding down.
China’s dairy industry faces significant changes in upstream demand and supply
in 2019. We expect upstream raw milk price to rise 5% in the year, the biggest
rise since 2013. Downstream dairy companies’ GPMs will inevitably come under
pressure, causing price competition to ease. We prefer upstream dairy
companies and are selective on downstream names. Our top picks are CMD,
Want Want and Yili. We reiterate Underperform on Mengniu and Neutral on H&H
and Yashili.
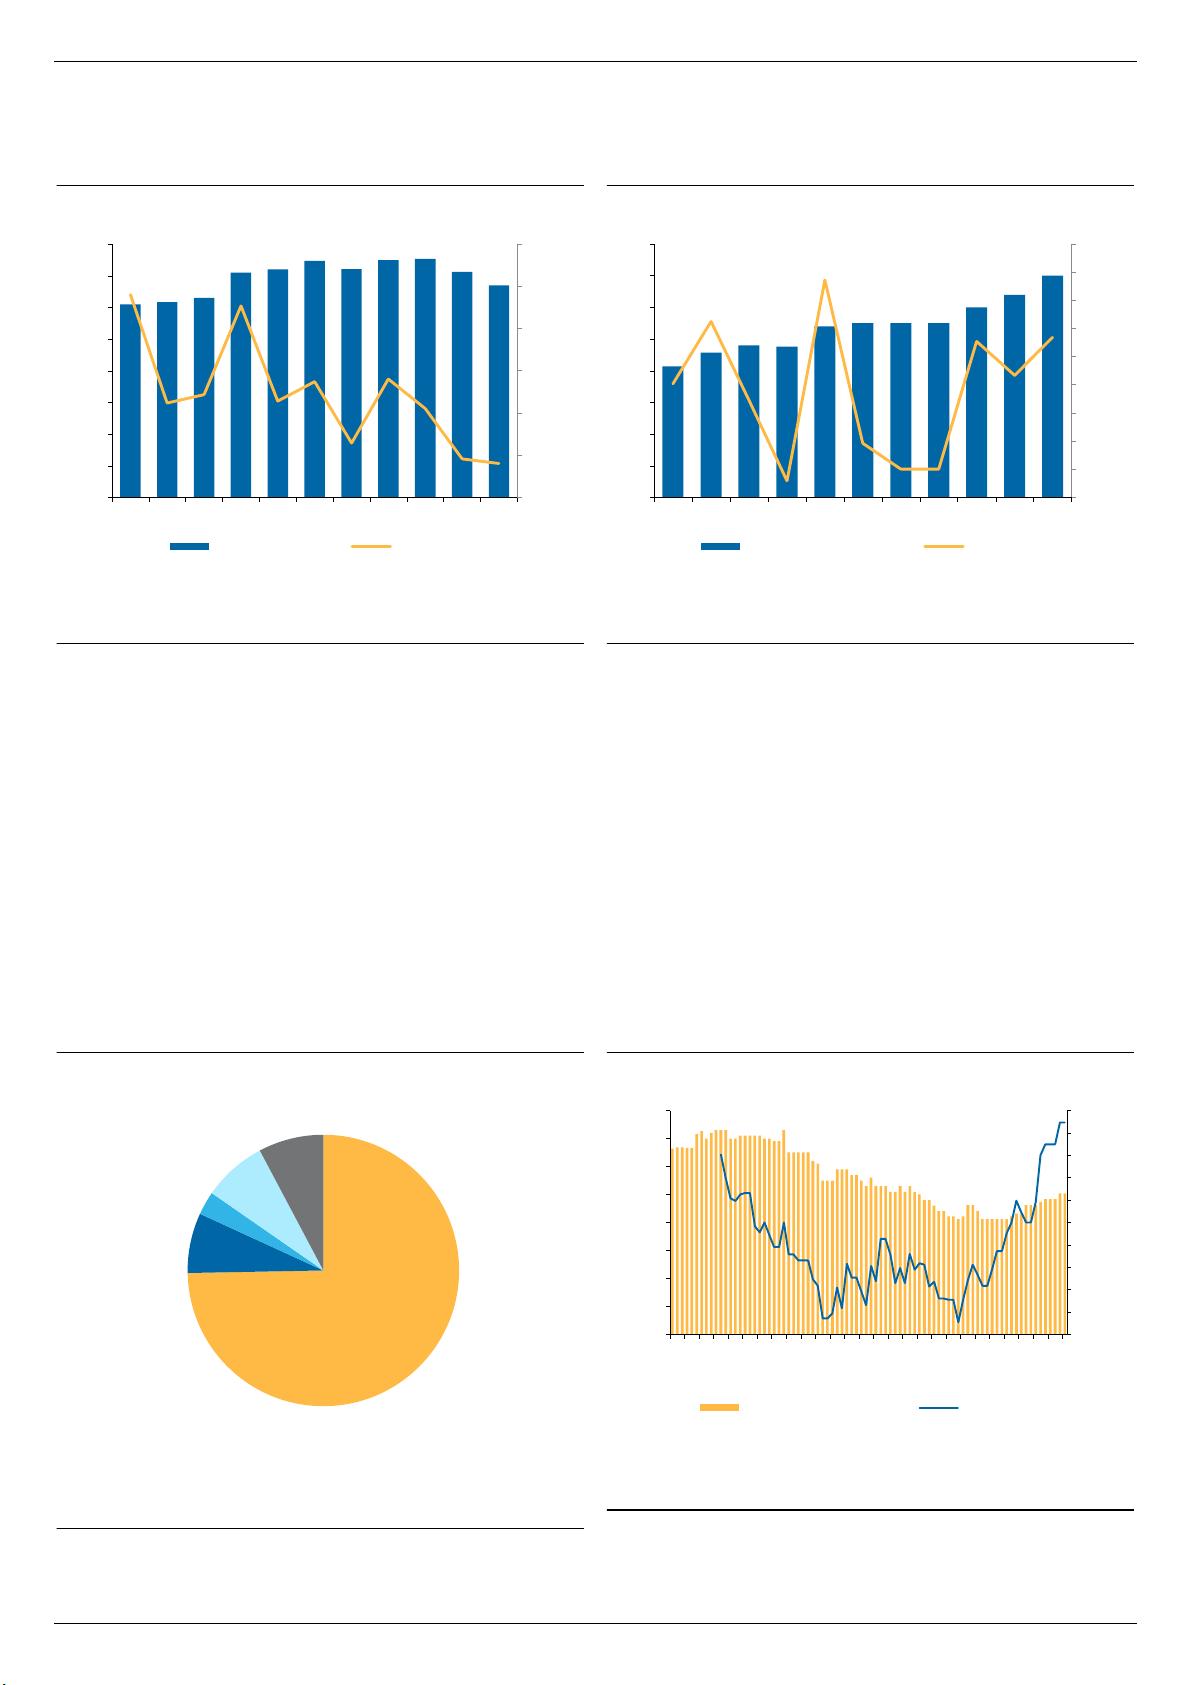
Upstream: demand to outgrow supply; raw milk price to rise 5%
Raw milk prices in China have long remained soft, but we expect the dynamics to
shift in favour of upstream dairies this year. We estimate China’s raw milk price
will rise 5% as milk supply tightens due to a lower milkable cow count and rising
feed cost. Overall, we expect to see a slight shortage in milk supply in 2019.
Downstream: prisoner’s dilemma, rivalry will ease but not much
Higher raw-milk prices will directly translate to gross margin pressure for
downstream companies in 2019. Our sensitivity analysis shows that every 1%
increase in raw milk prices will take 30bps each off Yili’s and Mengniu’s GPM,
and 20bps off Bright Dairy’s. This means operating profit downside of 3.8%, 6.2%
and 4.6%, respectively. This should ease price competition, but not by much, as
both Yili and Mengniu are in a prisoner’s dilemma—the market share gap is only
mid-single-digit, not wide enough for both to make much difference.
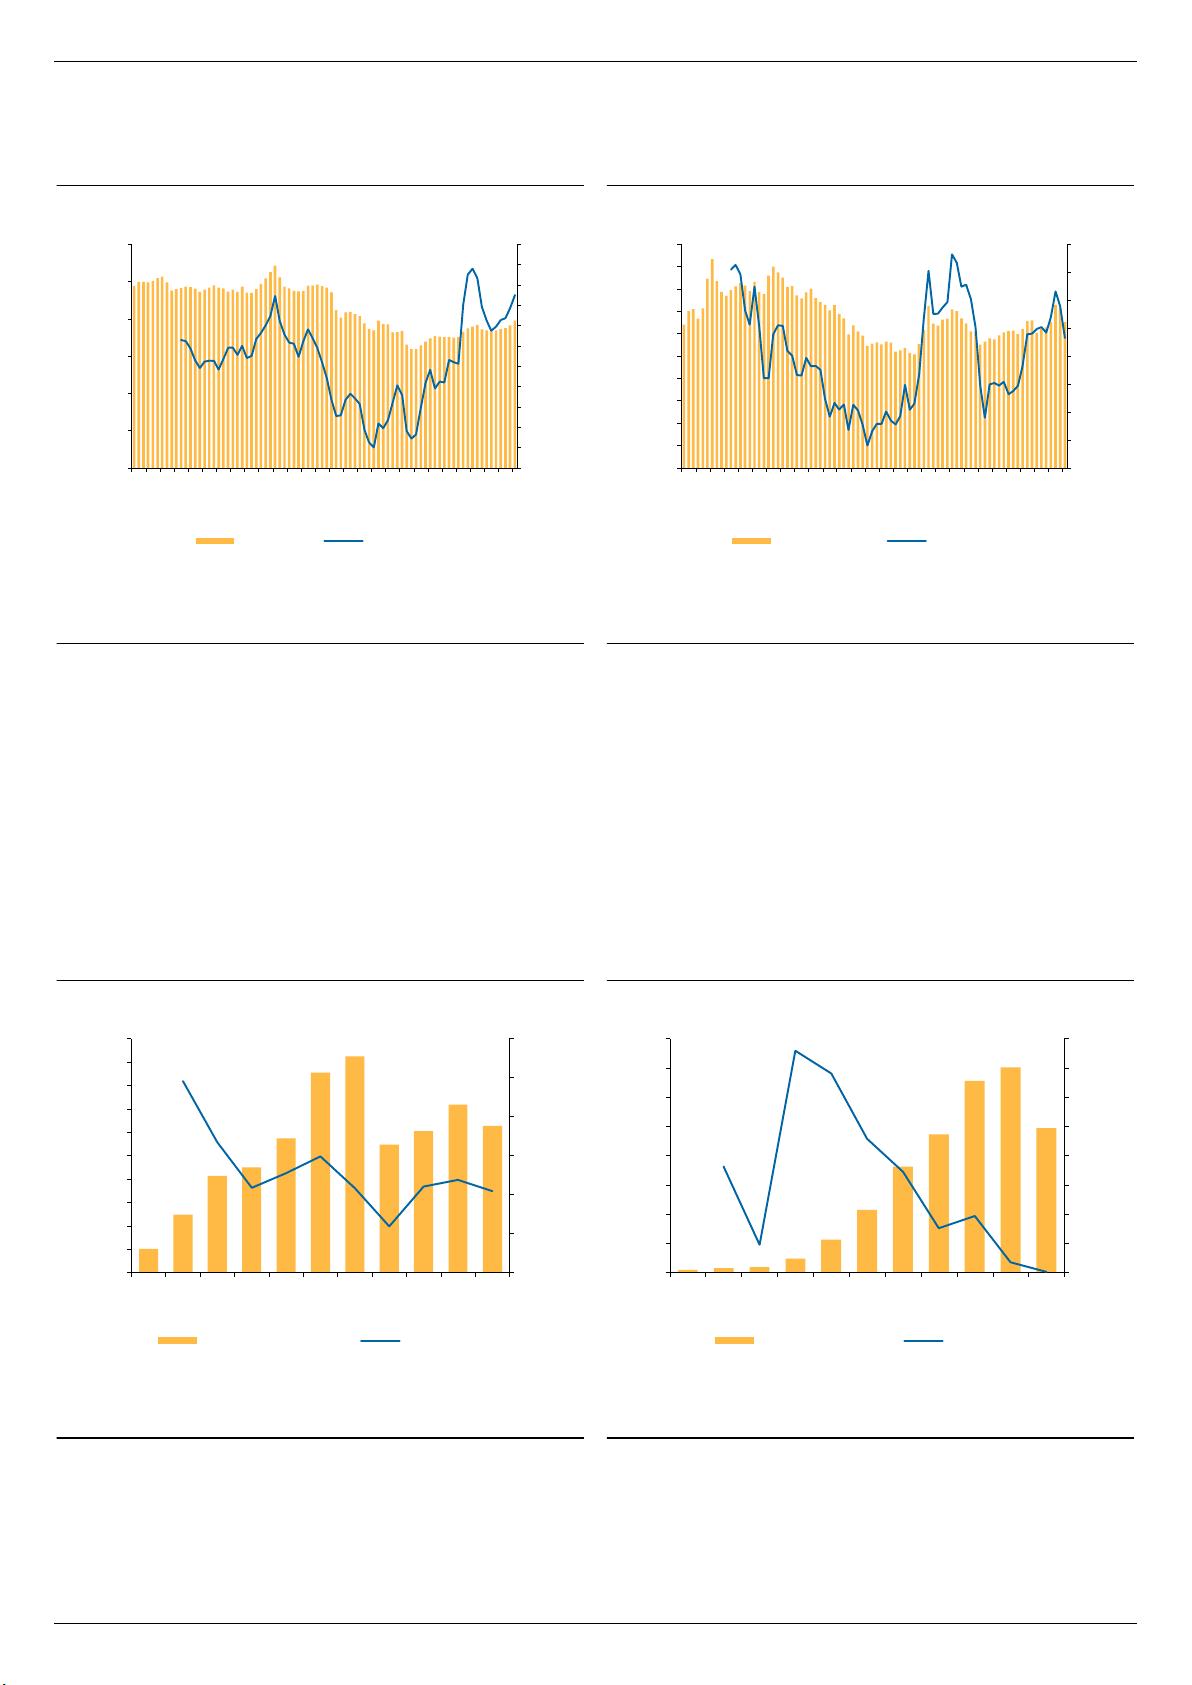
IMF: growth rate to moderate from 14% in 2018 to 6% in 2019
Growth in sales of infant milk formula (IMF) will be modest, we believe, as the
effect of the lifting of the one-child policy has faded, and the number of births is
likely to fall with the decline in the number of women of childbearing age and low
fertility desire. Meanwhile, we believe international brands will continue to
outperform, as customers are increasingly demanding high standards of food
safety and quality, regardless of income. We project industry growth will
moderate from 14% in 2018 to 6% in 2019.
Recommendations
China Modern Dairy (OP, TP HK$1.34): Direct beneficiary of milk price rise.
Want Want (OP, TP HK$7.70): Key beneficiary of competition easing. We
estimate net profit growth acceleration to 19.4% in FY20E with 16x PER.
Yili (OP, TP Rmb27.10): Better capacity to control A&P with cheap valuation of
22x 2019E PER.
Mengniu (UP, TP HK$16): GPM is likely to fall from the historical high in 1H18.
Valuation expensive at 32x 2019E PER.
H&H (N, TP HK$44.30): ANC to continue to outperform BNC as BNC faces
industry moderation.
Bright Dairy (N, TP Rmb8): Regional play that still lags behind Yili and Mengniu.
Yashili (OP, TP HK$1.97): Earnings turnaround boosted by factory disposal.
Macquarie Research China Dairy Industry
17 January 2019 2
Global dairy valuation table
Fig 1 Global dairy valuation table
Company
Code
Price
Rating
TP
TSR
Mkt Cap
P/E(X)
P/B(X)
ROE (%)
EPS Growth (%)
PEG
Div yield (%)
EV/EBITDA
(lcy/sh)
(lcy/sh)
(%)
US$m
2018E
2019E
2018E
2019E
2018E
2019E
2018E
2019E
2019E
2018E
2019E
2018E
2019E
Global dairy product producers
Nestle
NESN SW
83.62
NR
NR
NR
259,291
21.6
19.9
4.2
4.1
20.7
21.4
8.9
8.5
2.4
3.0
3.2
15.2
14.2
Danone
BN FP
62.26
NR
NR
NR
48,678
17.5
16.2
2.5
2.3
14.4
15.1
3.8
8.1
2.0
3.1
3.4
12.3
11.6
Kraft Foods
KHC US
46.91
NR
NR
NR
52,230
13.0
12.6
0.9
0.8
6.3
6.4
1.0
2.9
4.4
5.4
5.5
12.1
11.8
Fonterra
FSF NZ
4.71
UP
5.00
9%
5,186
19.9
15.1
1.2
1.2
5.7
7.9
-48.2
31.3
0.5
2.1
3.1
9.8
8.6
Yakult
2267 JP
7280.00
NR
NR
NR
11,631
35.3
30.4
3.4
3.1
9.8
10.6
25.0
16.1
nm
0.5
0.6
18.8
17.8
Parmalat
PLT IM
2.85
NR
NR
NR
6,024
39.0
29.6
1.6
1.4
NA
NA
0.0
31.5
0.9
0.6
0.8
NA
NA
Vina Milk
VNM VN
134900.00
NR
NR
NR
10,130
25.7
24.1
9.0
8.3
39.1
38.7
-8.5
6.6
3.7
3.2
3.4
18.4
16.9
Meiji Foods
2269 JP
8810.00
NR
NR
NR
11,717
20.9
18.5
2.6
2.4
13.7
13.5
0.0
12.9
1.4
1.3
1.5
10.1
9.9
Dean Foods
DF US
4.65
NR
NR
NR
425
NA
54.7
0.7
0.7
-3.7
1.8
nm
nm
nm
7.4
5.6
7.0
5.7
Dairy Crest
DCG LN
446.20
NR
NR
NR
540
12.3
12.6
3.0
2.5
38.4
18.5
2.8
-2.2
-5.7
0.1
0.1
10.2
9.9
Morinaga Milk
2264 JP
3195.00
NR
NR
NR
1,435
10.5
159.0
1.0
0.9
10.2
7.5
20.3
-93.4
-1.7
1.9
1.6
6.0
6.2
A2 Milk Company
A2M AU
11.21
NR
NR
NR
6,001
43.4
30.9
18.1
10.5
54.8
38.0
nm
40.7
0.8
0.0
0.3
30.5
22.1
Global dairy product producers average
23.6
35.3
4.0
3.2
19.0
16.3
0.5
5.7
0.9
2.4
2.4
13.7
12.2
Chinese dairy processors
Yili
600887 CH
24.10
OP
27.10
15%
21,936
25.3
22.9
5.4
5.0
22.2
22.6
-2.7
10.3
2.2
2.1
2.3
14.8
13.7
Mengniu
2319 HK
25.40
UP
16.00
-36%
12,770
33.2
32.3
3.5
3.2
10.9
10.3
25.3
3.0
10.9
0.7
0.7
23.0
21.6
Bright Dairy
600597 CH
8.51
Neutral
8.00
-5%
1,534
19.9
18.0
1.8
1.7
9.5
10.0
-22.4
10.8
1.7
1.4
1.6
6.1
5.7
Want Want
151 HK
6.27
OP
7.70
25%
9,936
19.5
16.3
4.4
3.8
23.1
24.9
7.7
18.2
0.9
2.5
3.1
11.3
9.8
Guangxi Royal
002329 CH
3.54
NR
NR
NR
442
NA
NA
NA
NA
NA
NA
NA
NA
NA
NA
1.1
NA
NA
Yantang
002732 CH
16.75
NR
NR
NR
390
17.8
14.4
NA
NA
NA
NA
NA
NA
NA
NA
0.7
NA
NA
Chinese dairy processors average
19.9
18.1
2.8
2.6
16.5
16.5
-1.3
8.8
3.8
1.6
1.5
13.8
13.1
Chinese dairy farmers
CMD
1117 HK
0.73
OP
1.34
84%
578
4.9
4.3
0.6
0.6
11.4
13.3
80.4
15.4
0.3
0.0
0.0
5.8
5.6
YuanShengTai
1431 HK
0.17
NR
NR
NR
99
NA
NA
NA
NA
NA
NA
NA
NA
NA
NA
NA
NA
NA
Huishan
6863 HK
0.42
NR
NR
NR
722
NA
NA
NA
NA
NA
NA
NA
NA
NA
NA
NA
NA
NA
Xinjiang Western
300106 CH
5.72
NR
NR
NR
178
NA
NA
NA
NA
NA
NA
NA
NA
NA
NA
NA
NA
NA
Shengmu
1432 HK
0.34
NR
NR
NR
280
NA
5.7
0.5
0.5
nm
8.8
NA
NA
NA
NA
NA
NA
5.7
Chinese dairy farmers average
4.9
5.0
0.5
0.5
11.4
11.0
80.4
15.4
0.3
0.0
0.0
5.8
5.6
Infant milk formula (IMF)
H&H
1112 HK
43.35
Neutral
44.30
2%
3,547
22.2
17.7
4.5
3.6
22.6
22.6
15.2
25.1
0.7
0.0
0.0
10.3
8.5
Yashili
1230 HK
1.32
OP
1.97
49%
799
111.8
38.8
1.0
1.0
0.9
2.5
nm
nm
nm
0.0
0.0
61.0
19.8
Beingmate
002570 CH
5.21
NR
NR
NR
796
NA
NA
NA
NA
NA
NA
NA
NA
NA
NA
NA
NA
NA
Chinese IMF average
67.0
28.3
2.7
2.3
11.8
12.5
15.2
25.1
0.7
0.0
0.0
35.7
14.2
Note: For Want Want, 2018E is FY19E (Mar, 2018-Mar, 2019) and 2019E is FY20E (Mar, 2019-Mar, 2020).
Source: Company data, Bloomberg, Macquarie Research, January 2019; prices as of 15 January 2019
Macquarie Research China Dairy Industry
17 January 2019 3
Upstream: demand to outgrow supply; raw milk price
up 5% YoY
China’s raw milk price on the mend
China’s raw milk price remained soft in 1H18 with price down 4% HoH but the trend began to
reverse starting in August with latest price (as of 2
nd
January 2019) rising 7% HoH and 2% YoY to
Rmb3.60/kg. Meanwhile, overall milk production growth has peaked in April 2018 and even dipped
into negative territory in September and October 2018. That being said, we expect China’s overall
raw milk supply to maintain positive growth albeit at a slower rate in 2019 as improving milk yield
and imported milk powder will somewhat alleviate the supply challenge. Looking ahead, we expect
to see a moderate raw milk price recovery driven by tighter milk supply on the back of lower
milkable cow herd size and rising feed cost. Our proprietary China upstream supply and demand
model projects a 1% YoY supply growth with slight shortage in 2019.
Fig 2 China raw milk price began to rise since Aug 2018
Fig 3 China’s overall milk production has been slowing
down
Source: Ministry of Agriculture, Macquarie Research, January 2019
Source: NBS, Macquarie Research, January 2019
Driver #1: Lower milkable cow herd size
After China’s raw milk price peaked out in 2014 in the last cycle, China’s upstream dairy industry
went through a period of high culling rates and smaller farmers exiting the industry amid sluggish
milk prices. Given that it takes three years before a milkable cow can begin to produce milk, there’s
usually a lagging effect on milk production after high culling rates. Evidently, China’s total milkable
cow count began to decline in 2016 and decline slightly widened to -6.0% YoY in 2017. Meanwhile,
China’s average milk yield continue to improve as it is below other developed countries that have
>10 tons/ cow/ year. Net-net, we expect to see tighter raw milk supply driven by lower milkable
cows but partially offset by the average milk yield improvement.
2.0
2.2
2.4
2.6
2.8
3.0
3.2
3.4
3.6
3.8
4.0
4.2
4.4
4.6
Jan-12
Jul-12
Jan-13
Jul-13
Jan-14
Jul-14
Jan-15
Jul-15
Jan-16
Jul-16
Jan-17
Jul-17
Jan-18
Jul-18
Jan-19
(Rmb/kg)
Macquarie Research China Dairy Industry
17 January 2019 4
Fig 4 China’s milkable cow count began to contract in 2016
Fig 5 China’s average milk yield still far below global
average despite continuous improvement
Source: China Dairy Yearbook, Macquarie Research, January 2019
Driver #2: rising feed cost
Feed cost is the predominant expense item for raw milk production cost and the ideal mix between
forage and coarse fodder is roughly 50/50 but the exact mix differs for each dairy farm. All three
key types of feed prices, i.e. alfalfa, corn and soybean, have trended upwards in 2018. Based on
the Dec 2018 prices, there is no sign of prices moderating for both alfalfa and corn. Meanwhile,
soybean prices have showed growth moderation from Nov 2018 onwards.
Overall, we expect feed cost will continue to rise for the following reasons:
U.S- China trade war. This has led to a 25% tariff on U.S imported alfalfa and soybeans.
Potential upside could be improved U.S-China relations.
China corn supply side reform. This has resulted in lower supply and subsequently
higher corn prices.
Fig 6 Feed cost accounts for over 70% of raw milk
production cost
Fig 7 Alfalfa prices continue to trend up
Source: Company data, Macquarie Research, January 2019. Note: based
on CMD’s 1H18 FS
Source: Ministry of Agriculture, Macquarie Research, January 2019
-10%
-5%
0%
5%
10%
15%
20%
0
2
4
6
8
10
12
14
16
2007 2008 2009 2010 2011 2012 2013 2014 2015 2016 2017
(m herds)
Milkable cow YoY % (RHS)
-2%
0%
2%
4%
6%
8%
10%
12%
14%
16%
0
1
2
3
4
5
6
7
8
2007 2008 2009 2010 2011 2012 2013 2014 2015 2016 2017
(ton/head/yr)
Average milk yield YoY % (RHS)
Feed
75%
Labor
7%
Utilities
3%
Depreciation
7%
Others
8%
-25%
-20%
-15%
-10%
-5%
0%
5%
10%
15%
20%
25%
0
50
100
150
200
250
300
350
400
Mar-12
Jun-12
Sep-12
Dec-12
Mar-13
Jun-13
Sep-13
Dec-13
Mar-14
Jun-14
Sep-14
Dec-14
Mar-15
Jun-15
Sep-15
Dec-15
Mar-16
Jun-16
Sep-16
Dec-16
Mar-17
Jun-17
Sep-17
Dec-17
Mar-18
Jun-18
Sep-18
Dec-18
(US$/ton)
International alfafa price YoY % (RHS)
Macquarie Research China Dairy Industry
17 January 2019 5
Fig 8 Similarly, corn prices are also on an upward trend
Fig 9 Meanwhile, soybean price growth has begun to
moderate since Nov 2018
Source: Ministry of Agriculture, Macquarie Research, January 2019
Imported milk powder to see moderate growth in the near term
China’s imported milk powder volume has not returned to its 2014 peak despite two years of
double-digit YoY growth in 2016-17. Moreover, 9M18 has seen further slowdown to only 4% YoY.
On the other hand, imported liquid milk recorded even softer growth with 9M18 volume only flattish
YoY, down from +7% in 2017.
Imported milk powder has proven to be a popular alternative for downstream dairy companies
whenever the price gap widens between domestic and overseas prices. That being said, we
expect the price gap to slightly narrow in 2019 with the anticipation of a moderate domestic raw
milk price increase and mid-single-digit to low-double-digit growth for WMP price in 2019.
Fig 10 Imported milk powder volume grew 4% YoY in 9M18
Fig 11 Meanwhile, imported liquid milk volume only stayed
flattish in 9M18
Source: Dairy Association of China, Macquarie Research, January 2019
China raw milk price still trades at a premium over Fonterra
Based on the most recent auction held by GDT on 15 January 2019, WMP price edged up 2.7%
WoW but declined 7.7% YoY to US$2,777/MT. Meanwhile, China’s raw milk price edged up 2.0%
YoY to Rmb3.60/kg per most recent data on 26 December 2018. This implies that the China raw
milk price is currently trading at 17% premium to Fonterra’s WMP price.
-30%
-25%
-20%
-15%
-10%
-5%
0%
5%
10%
15%
20%
25%
0
500
1,000
1,500
2,000
2,500
3,000
Mar-12
Jun-12
Sep-12
Dec-12
Mar-13
Jun-13
Sep-13
Dec-13
Mar-14
Jun-14
Sep-14
Dec-14
Mar-15
Jun-15
Sep-15
Dec-15
Mar-16
Jun-16
Sep-16
Dec-16
Mar-17
Jun-17
Sep-17
Dec-17
Mar-18
Jun-18
Sep-18
Dec-18
(Rmb/ton)
Corn price YoY % (RHS)
-40%
-30%
-20%
-10%
0%
10%
20%
30%
40%
0
500
1,000
1,500
2,000
2,500
3,000
3,500
4,000
4,500
5,000
Mar-12
Jun-12
Sep-12
Dec-12
Mar-13
Jun-13
Sep-13
Dec-13
Mar-14
Jun-14
Sep-14
Dec-14
Mar-15
Jun-15
Sep-15
Dec-15
Mar-16
Jun-16
Sep-16
Dec-16
Mar-17
Jun-17
Sep-17
Dec-17
Mar-18
Jun-18
Sep-18
Dec-18
(Rmb/ton)
Soybean price YoY % (RHS)
-100%
-50%
0%
50%
100%
150%
200%
0
100
200
300
400
500
600
700
800
900
1,000
2008
2009
2010
2011
2012
2013
2014
2015
2016
2017
9M18
(k ton)
Imported milk powder YoY % (RHS)
0%
20%
40%
60%
80%
100%
120%
140%
160%
0
100
200
300
400
500
600
700
800
2008
2009
2010
2011
2012
2013
2014
2015
2016
2017
9M18
(k ton)
Imported liquid milk YoY % (RHS)
剩余49页未读,继续阅读
资源评论
2301_77550592
- 粉丝: 17
- 资源: 7164
上传资源 快速赚钱
- 我的内容管理 展开
- 我的资源 快来上传第一个资源
- 我的收益 登录查看自己的收益
- 我的积分 登录查看自己的积分
- 我的C币 登录后查看C币余额
- 我的收藏
- 我的下载
- 下载帮助
最新资源
- vscode-1.64.1.tar源码文件
- vscode-1.64.0.tar源码文件
- vscode-1.52.0.tar源码文件
- Music-Player +PlayerActivity+ rockplayer+ SeeJoPlayer 播放器JAVA源码
- vscode-1.46.0.tar源码文件
- 最近很火植物大战僵尸杂交版2.08苹果+安卓+PC+防闪退工具V2+修改工具+高清工具+通关存档整合包更新
- 超级好用的截图工具PixPin,可录制Gif图
- Screenshot_2024-05-21-17-06-42-64_2332cb9b27b851b548ba47a91682926c.jpg
- 毕业设计参考 - 基于树莓派、OpenCV及Python的人脸识别
- node-v18.20.2-linux-arm64
资源上传下载、课程学习等过程中有任何疑问或建议,欢迎提出宝贵意见哦~我们会及时处理!
点击此处反馈
安全验证
文档复制为VIP权益,开通VIP直接复制
信息提交成功