没有合适的资源?快使用搜索试试~ 我知道了~
瑞信-亚太地区-银行业-新加坡银行业:运行安全-530-39页.pdf
需积分: 0 0 下载量 200 浏览量
2023-07-26
12:04:33
上传
评论
收藏 1.2MB PDF 举报
温馨提示
试读
39页
瑞信-亚太地区-银行业-新加坡银行业:运行安全-530-39页.pdf
资源推荐
资源详情
资源评论
DISCLOSURE APPENDIX AT THE BACK OF THIS REPORT CONTAINS IMPORTANT DISCLOSURES, ANALYST
CERTIFICATIONS, LEGAL ENTITY DISCLOSURE AND THE STATUS OF NON-US ANALYSTS. US Disclosure: Credit
Suisse does and seeks to do business with companies covered in its research reports. As a result, investors should be aware
that the Firm may have a conflict of interest that could affect the objectivity of this report. Investors should consider this report
as only a single factor in making their investment decision.
30 May 2019
Asia Pacific/Singapore
Equity Research
Banks
Singapore Banks Sector
ASSUMING COVERAGE
Research Analysts
Nicholas Teh
65 6212 3026
nicholas.teh@credit-suisse.com
Kylie Wan
65 6212 3004
kylie.wan@credit-suisse.com
Flight to safety
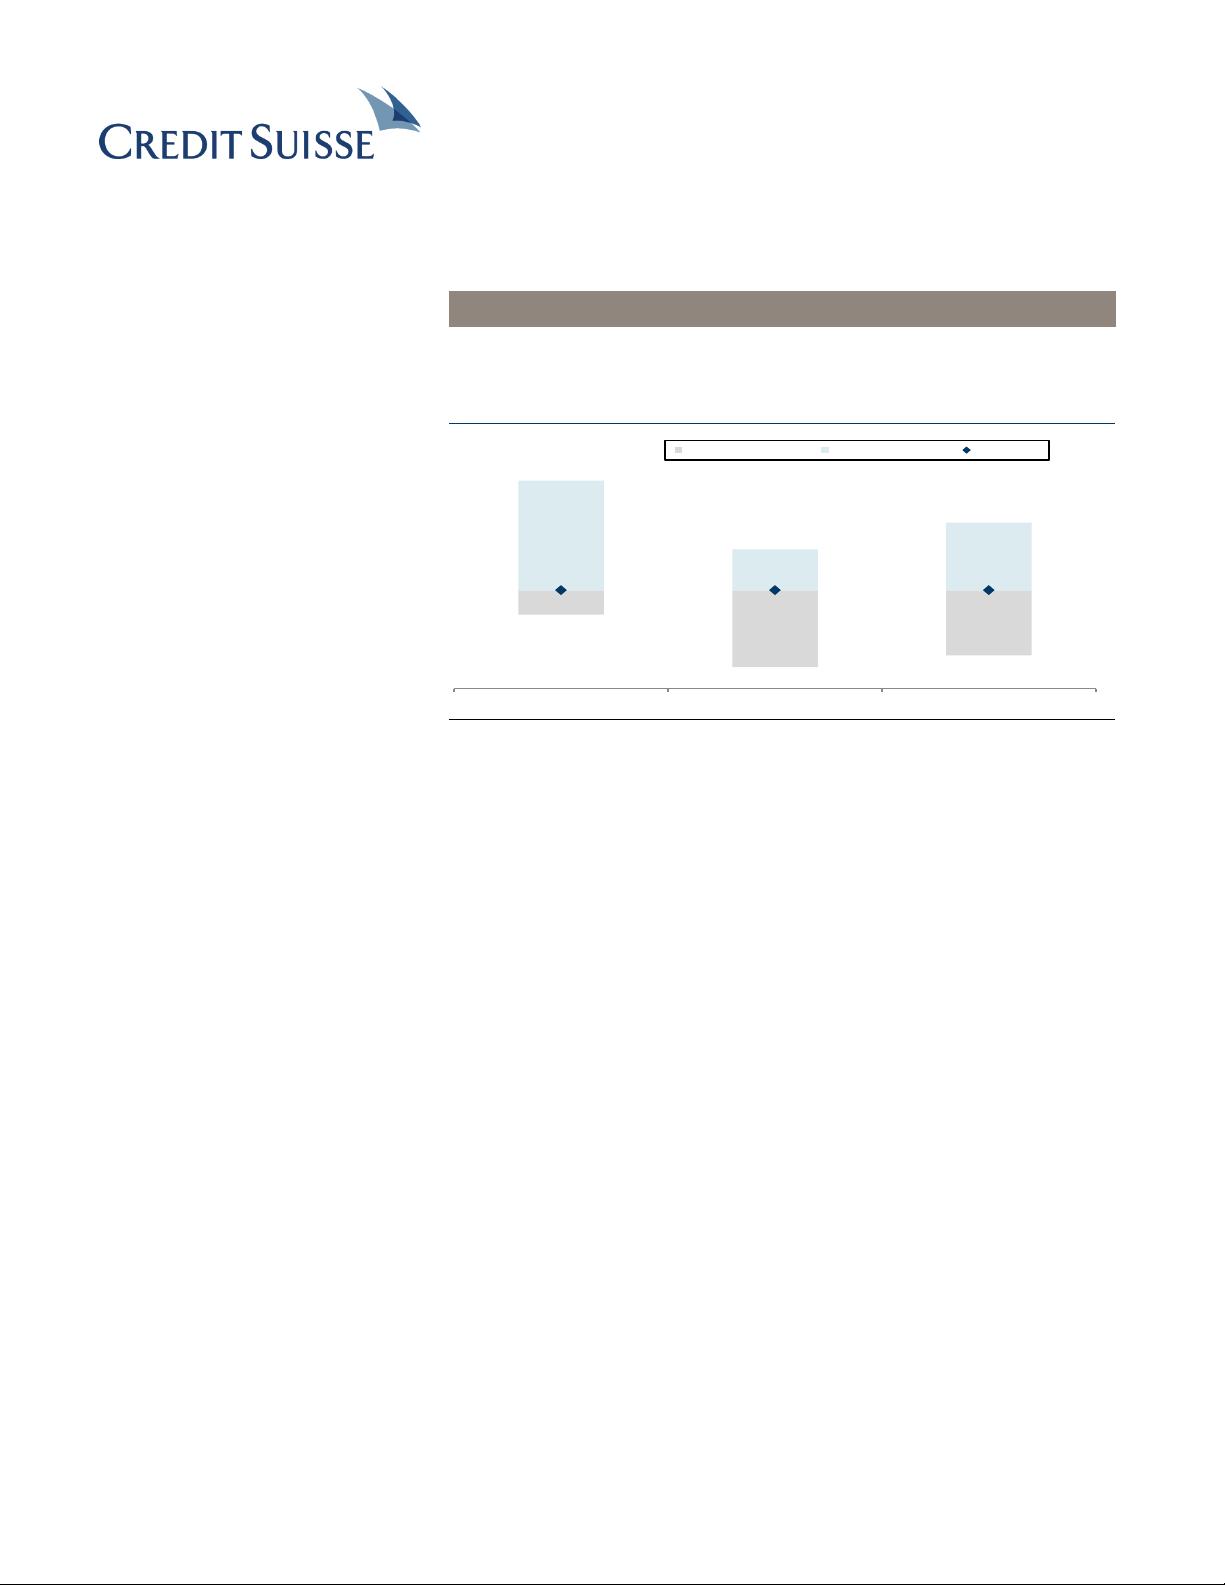
Figure 1: Risk-reward most favourable for UOB
S$24.49
S$11.37
S$23.52
UOB OCBC DBS
Downside to "grey sky" Upside to "base case" Current price
Base case = S$29.7
(+22% upside)
Base case = S$11.9
(+9% upside)
Base case = S$28.4
(+14% upside)
Grey sky = S$23.1
(5% downside)
Grey sky = S$9.2
(16% downside)
Grey sky = S$21.7
(13% downside)
Source: Company data, Credit Suisse estimates
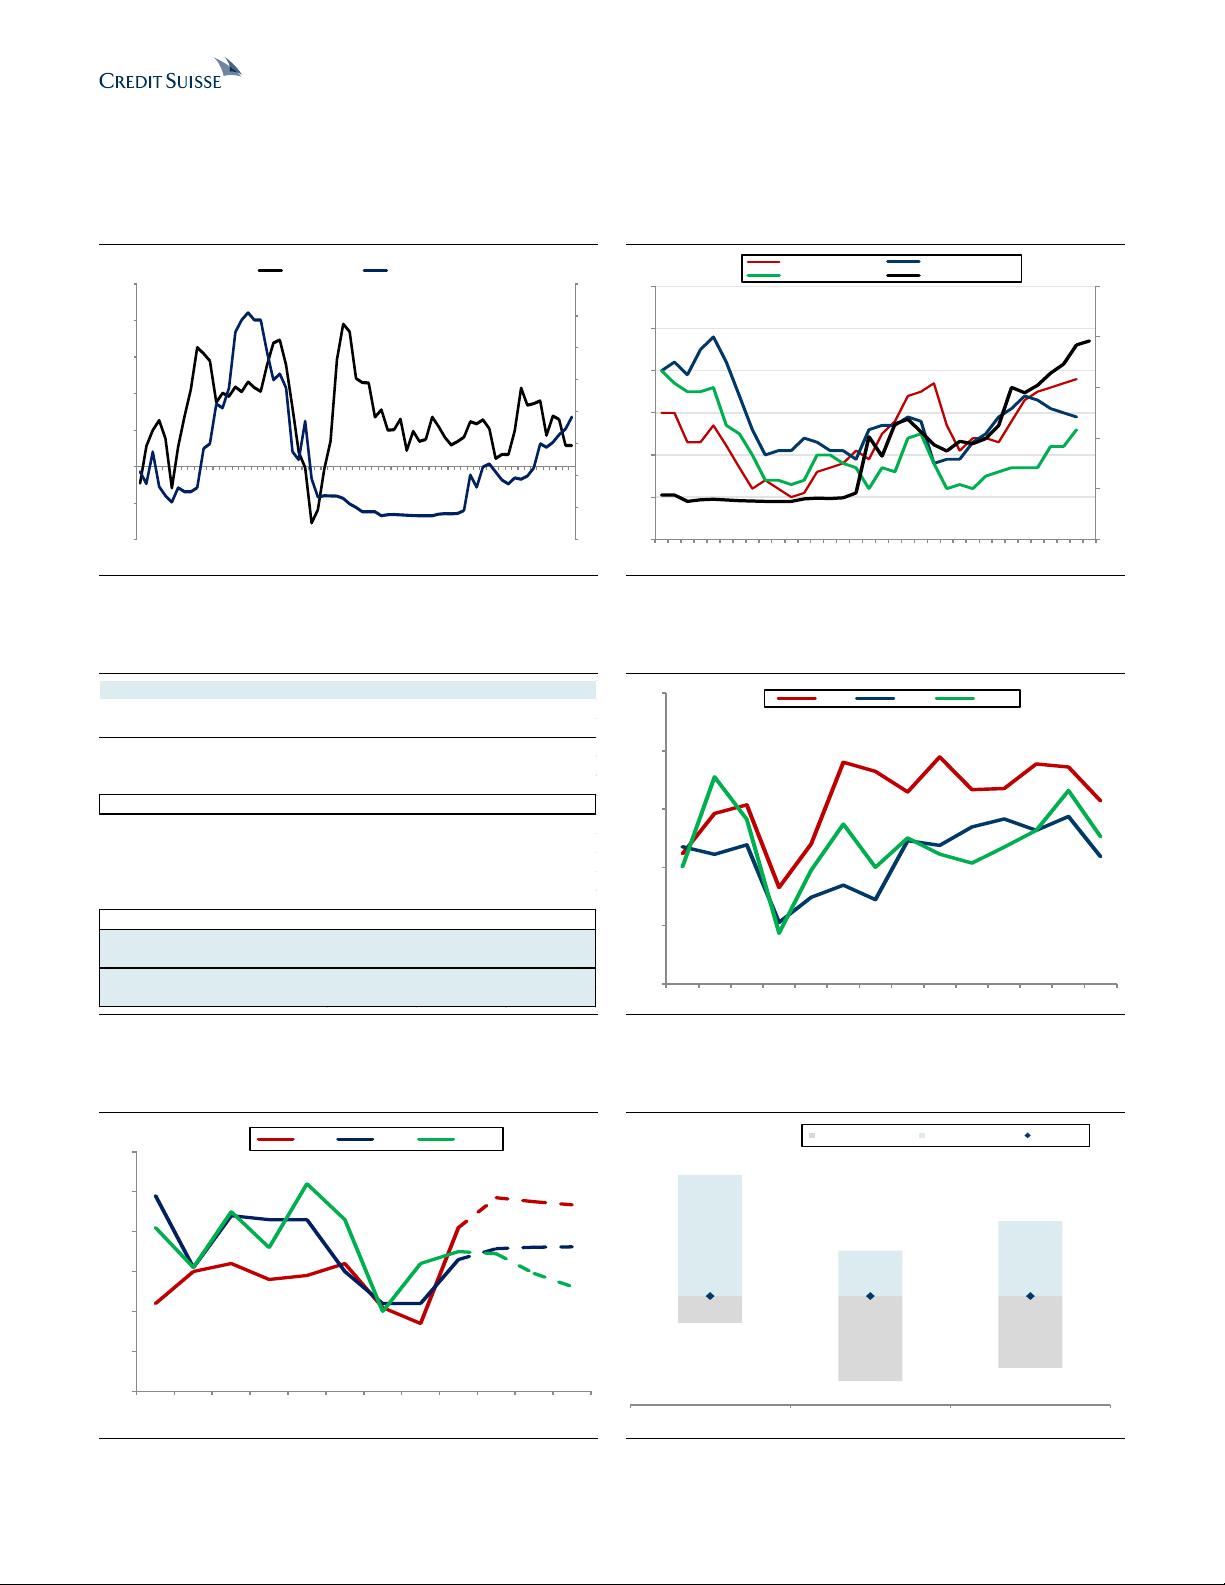
■ Decent risk-reward. With slowing economic growth and uncertainty over
interest rate direction, our base case assumes flat-to-declining ROEs for
Singapore banks in 2019-21E. In our view, DBS and UOB have the most
levers to drive higher NIM from 1Q19 levels, with key risks being higher
loan competition mitigating pass-through of higher rates and potential US
rate cuts. By our estimates, a 50 bp reduction in the US rate would affect
DBS the most (-7.5% to net profit), then OCBC (-5.7%), and UOB (-4.7%).
Our grey-sky analysis suggests that potential earnings cuts are partially
priced in, particularly for UOB, where there might be just 5% further
downside should there be no loan growth, flat NIM, and higher credit cost.
■ UOB should have the least volatile NOII. Capital-market-related non-
interest income (NOII) is the lowest for UOB (16% vs 18-21% for
DBS/OCBC in 2018)—hence UOB should be less susceptible to swings in
market sentiment. Trading income is the most volatile component of NOII.
While trading income is the largest contributor to DBS' earnings, it exhibits
most volatility for OCBC.
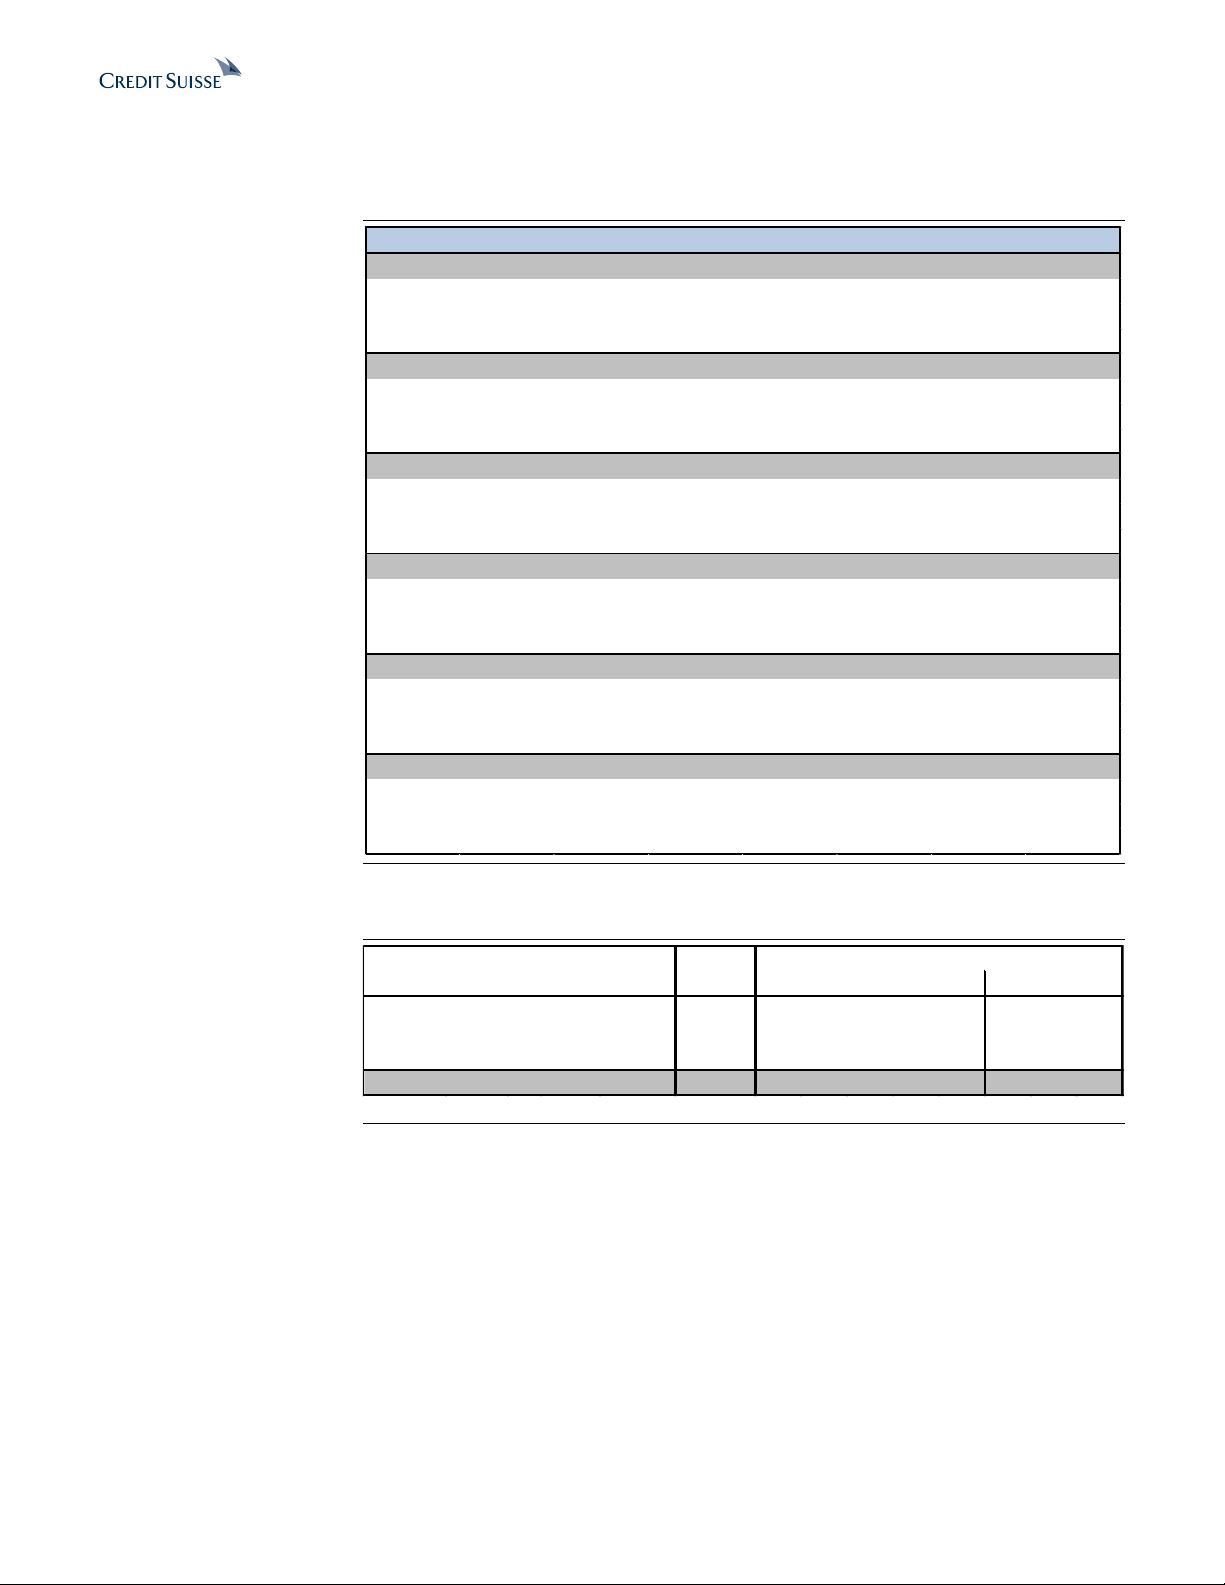
■ Switch to UOB. We assume coverage of Singapore banks. UOB
(OUTPERFORM, TP S$29.70) is our top pick, as it has the most stable
earnings base and least volatile NOII, and offers the best risk-reward in
different scenarios. We see DBS (OUTPERFORM, TP S$28.40) providing
the most certainty on dividends (4.8% yield), with its long-term digital
strategy intact. We expect OCBC's (NEUTRAL, TP S$11.85) ROE to see a
declining trend moving forward on its build-up of excess capital to address
volatility in the macro environment and potential acquisition opportunities.
30 May 2019
Singapore Banks Sector 2
Focus charts and table
Figure 2: Slowing GDP growth and peaking interest
rates a concern for returns
Figure 3: Interest rate movements have remained
favourable so far
0.00
0.50
1.00
1.50
2.00
2.50
3.00
3.50
4.00
-10.00
-5.00
0.00
5.00
10.00
15.00
20.00
25.00
1Q02 1Q03 1Q04 1Q05 1Q06 1Q07 1Q08 1Q09 1Q10 1Q11 1Q12 1Q13 1Q14 1Q15 1Q16 1Q17 1Q18 1Q19
Nominal GDP YoY 3M SIBOR (RHS)
(%)
(%)
0.0
0.5
1.0
1.5
2.0
2.5
1.5
1.6
1.7
1.8
1.9
2.0
2.1
1Q11 4Q11 3Q12 2Q13 1Q14 4Q14 3Q15 2Q16 1Q17 4Q17 3Q18 2Q19
DBS NIM UOB NIM
OCBC NIM 3M SIBOR (RHS)
(%) (%)
Source: Company data, Credit Suisse estimates
Figure 4: UOB least sensitive to risk from US rate
cuts
Figure 5: UOB has the lowest proportion of capital-
market-related NOII
DBS UOB OCBC
Interbank assets & liabilities -52 -90 -86
Customer loans & deposits -433 -124 -203
Interest rate impact (485) (214) (288)
FY20 net profit 6,497 4,518 5,103
% impact for -50bp hike (7.5) (4.7) (5.7)
FY20 Net interest income 10,202 7,066 6,721
FY20 NIM (%) 1.91 1.84 1.79
Net interest income - post 50bp decrease
9,717 6,852 6,433
NIM - post 50bp decrease 1.81 1.78 1.71
NIM Ch (%) -0.091 -0.056 -0.077
Base case ROA (%) 1.12 1.09 1.04
Implied ROA on 50 bps cut (%) 1.03 1.03 0.98
Base case ROE (%) 12.7 11.6 10.9
Implied ROE on 50 bps cut (%) 11.8 11.1 10.3
21%
16%
18%
5%
10%
15%
20%
25%
30%
2005 2006 2007 2008 2009 2010 2011 2012 2013 2014 2015 2016 2017 2018
DBS UOB OCBC
Source: Company data, Credit Suisse estimates
Figure 6: Peaking ROEs for the Singapore banks
Figure 7: Risk-reward looks most favourable for
UOB
8.0
9.0
10.0
11.0
12.0
13.0
14.0
2010 2011 2012 2013 2014 2015 2016 2017 2018 2019E 2020E 2021E
DBS UOB OCBC
(%)
S$24.49
S$11.37
S$23.52
UOB OCBC DBS
Downside to "grey sky" Upside to "base case" Current price
Base case = S$29.7
(+22% upside)
Base case = S$11.9
(+9% upside)
Base case = S$28.4
(+14% upside)
Grey sky = S$23.1
(5% downside)
Grey sky = S$9.2
(16% downside)
Grey sky = S$21.7
(13% downside)
Source: Company data, Credit Suisse estimates
30 May 2019
Singapore Banks Sector 3
Flight to safety
Decent risk-reward
In the current macro environment, Singapore’s GDP growth is expected to slow below
2.5%, while the interest rate environment looks to be peaking. The banks have achieved
ROEs of 11.3-12.1% in 2018, driven by NIM expansion and lower credit cost, while NOII
was weak. We believe NIM will continue to expand in 2019, driven by (1) already higher
SOR/SIBOR staying stable and (2) delayed repricing of loans on the back of the four rate
hikes in 2018. UOB and DBS look to have more drivers for NIM expansion in the near
term. Meanwhile, the key risk to NIM would be (1) rising loan competition mitigating further
pass-through of higher rates and (2) US rate cuts.
Our house view is for no change in US rates in 2019 and one hike in 1H20; however, the
risk of insurance cuts would become increasingly likely if the trade conflict does not de-
escalate in the next few months. We estimate that in a scenario of 50 bp US rate cut, DBS
would be the most exposed and see a 7.5% impact to its 2020 net profit, OCBC would see
a 5.7% impact, and UOB would see a 4.7% impact.
With slowing GDP growth, loan growth is expected to slow in tandem; and after a strong
start to the year, UOB looks most likely to meet its full-year guidance of mid-single-digits.
Leverage is unlikely to be driven by asset growth, and we expect UOB’s and DBS’s
leverages to decline at a stable pace and OCBC's to decline more sharply. This leads to
an outlook of peaking ROE for DBS and UOB, and declining ROE for OCBC.
UOB should have the least volatile NOII
NOII makes up 32-39% of Singapore banks’ total income, and capital-market-related NOII
(trading income, wealth management fees, IB fees, etc.) contributes a larger portion of
DBS’ and OCBC's total income (18-21% in 2018) than UOB’s (16%). We also find that
trading income, which is the most volatile component, accounts for the highest proportion
of DBS's income (9-15% over the last five years), while OCBC's trading income seems to
be most volatile.
Wealth management fees account for 9% of DBS’ and OCBC’s total income (only 6% for
UOB); it is also a source of volatility, with DBS’ wealth management fee yields showing a
variance of 0.4-0.6%, but structural growth in AUM should provide some stability. While
credit cost can be a key source of volatility, we expect it to remain benign for now. CET 1
ratios are all also at very healthy levels of 13.9-14.2%, and near-term RWA (risk-weighted
assets) efficiency gains seem to have been fully implemented. In the longer term, OCBC
could see further RWA efficiency from Wing Hang moving to (internal-ratings-based
approach) IRB (possibly in end-2020), while UOB could see further improvement to capital
from disposing non-core assets (Evergrowing Bank).
Switch to UOB
We assume coverage on Singapore banks, with UOB as our top pick in the sector. We
believe UOB offers the best risk-reward trade-off, has the most stability in earnings given
its lower volatility in NOII, lowest exposure to potential rate cuts, with several levers to
drive NIM expansion in the near term, and is the most under-owned by institutions. We
have retained our OUTPERFORM rating on DBS and believe it provides the most certainty
on dividends. We expect OCBC's ROE to show the sharpest decline moving forward
mainly due to a more rapid build-up of capital from its conservative dividend policy (scrip
dividend and lower payout). While the higher excess capital provides a bigger defensive
buffer, there is also M&A risk as management has expressed the possibility of using the
capital for acquisition opportunities that could arise from the volatile markets.
Room for NIM
expansion in 2019
DBS most exposed to
rising risk of US rate
cuts
UOB has lowest
proportion of capital
markets related NOII
Credit cost
environment to remain
benign
Switch to UOB, most
stable earnings profile
and under-owned
30 May 2019
Singapore Banks Sector 4
Valuation comparison
Figure 8: Singapore banks valuations comparison
2015 2016 2017 2018 2019E 2020E 2021E
P/B (x)
DBS 1.6 1.5 1.4 1.3 1.3 1.2 1.1
UOB 1.4 1.3 1.2 1.1 1.1 1.0 0.9
OCBC 1.4 1.3 1.2 1.1 1.1 1.0 1.0
Cash core ROE (%)
DBS 11.3 10.3 9.9 12.1 12.8 12.7 12.7
UOB 11.1 10.4 10.3 11.4 11.6 11.6 11.6
OCBC 12.6 10.4 11.6 11.8 11.4 10.9 10.7
P/E on reported EPS(x)
DBS 14.0 14.8 14.5 11.4 10.3 9.8 9.2
UOB 12.5 12.7 11.8 10.1 9.6 9.0 8.4
OCBC 11.5 13.1 11.1 10.3 9.9 9.8 9.6
Dividend yield (%)
DBS 2.4 2.4 5.7 4.8 4.8 5.2 5.2
UOB 3.7 2.9 4.1 4.9 4.9 5.3 5.3
OCBC 3.3 3.3 3.4 3.9 4.1 4.3 4.5
Cash core ROA (%)
DBS 0.96 0.90 0.88 1.05 1.11 1.12 1.14
UOB 1.00 0.94 0.97 1.07 1.06 1.09 1.12
OCBC 1.00 0.89 0.98 1.00 1.03 1.04 1.05
Cash core profit growth (%)
DBS 12.4 -1.9 3.6 28.1 10.3 4.7 6.0
UOB -1.4 -0.2 9.4 18.3 5.6 6.7 6.5
OCBC 13.7 -9.5 19.1 8.1 6.6 4.2 4.3
Source: Company data, Credit Suisse estimates
Figure 9: Singapore banks’ price performance
Price Target Mkt cap
Rating S$ S$ S$ bn 1M 3M 6M 12M YTD 2018 2017 2016
DBSM.SI DBS OP 24.85 28.40 63.7 -12.5 0.0 2.8 -14.8 4.9 -3.1 43.3 3.9
UOBH.SI UOB OP 24.11 29.70 40.5 -13.2 -2.9 -3.3 -17.1 -1.2 -7.1 29.7 4.0
OCBC.SI OCBC N 10.89 11.85 46.4 -10.1 -1.5 -3.1 -16.2 -3.3 -9.1 38.9 1.4
.FTSTI STI 3,163 -7.2 -1.5 1.7 -10.1 3.1 -9.8 18.1 -0.1
Price performance (% )
Source: The BLOOMBERG PROFESSIONAL
TM
service, Credit Suisse estimates
30 May 2019
Singapore Banks Sector 5
Table of contents
Focus charts and table 2
Flight to safety 3
Decent risk-reward ...................................................................................................3
UOB should have the least volatile NOII..................................................................3
Switch to UOB..........................................................................................................3
Valuation comparison 4
Decent risk-reward 6
Still room for expansion in 2019...............................................................................7
What if we see US rate cuts?...................................................................................9
Loan growth slowing as expected ..........................................................................10
Digital initiatives provide a case for better returns in the long run..........................12
UOB should have the least volatile NOII 15
OCBC’s trading income seems most volatile .........................................................16
No signs of spiking credit cost................................................................................18
Switch to UOB 21
ROE trajectory is stable for UOB and DBS, declining for OCBC ...........................21
DBS has the safest dividend yield..........................................................................23
UOB most under-owned.........................................................................................24
Share price volatility from the trade war.................................................................25
Comparison with previous cycles...........................................................................26
How much downside in a grey sky scenario? ........................................................27
United Overseas Bank Ltd (UOBH.SI / UOB SP) 29
DBS Group Holdings Ltd (DBSM.SI / DBS SP) 31
Oversea-Chinese Banking Corp Ltd (OCBC.SI / OCBC SP) 33
剩余38页未读,继续阅读
资源评论
2301_76429513
- 粉丝: 8
- 资源: 6731
上传资源 快速赚钱
- 我的内容管理 展开
- 我的资源 快来上传第一个资源
- 我的收益 登录查看自己的收益
- 我的积分 登录查看自己的积分
- 我的C币 登录后查看C币余额
- 我的收藏
- 我的下载
- 下载帮助
安全验证
文档复制为VIP权益,开通VIP直接复制
信息提交成功