没有合适的资源?快使用搜索试试~ 我知道了~
巴黎银行-全球-宏观策略-从资产价格推断经济周期(更新)-0705-25页.pdf
需积分: 0 0 下载量 82 浏览量
2023-07-26
11:48:48
上传
评论
收藏 1.36MB PDF 举报
温馨提示
试读
25页
巴黎银行-全球-宏观策略-从资产价格推断经济周期(更新)-0705-25页.pdf
资源推荐
资源详情
资源评论
P
oland
Turkey
South Korea
Indonesia
South Africa
Mexico
Brazil
Japan
China
Eurozone
US
Market prices based index
Economic data based index
B- E
arly stage
C- Mid stage
D- Late stage
A- Grow th
< potential
Sources: Bloomberg LLP, BNP Paribas
|
DEEP DIVE 05/07/2019 1
L
uca
M
aia
,
EM/FX&IR Latin America Strategy |
G
abriel
Ge
rsztein
, G
lobal Head of EM Strategy | Banco BNP Paribas Brasil |
Michael
S
neyd, Head of Macro Quantitative and Derivatives Strategy | Stefan
Ub
ovic, Senior Macro Quantitative Strategist |
B
NP Paribas London Branch
D
EEP DIVE | GLOBAL
5 J
uly 2019
I
nferring economic cycles from asset prices; Update
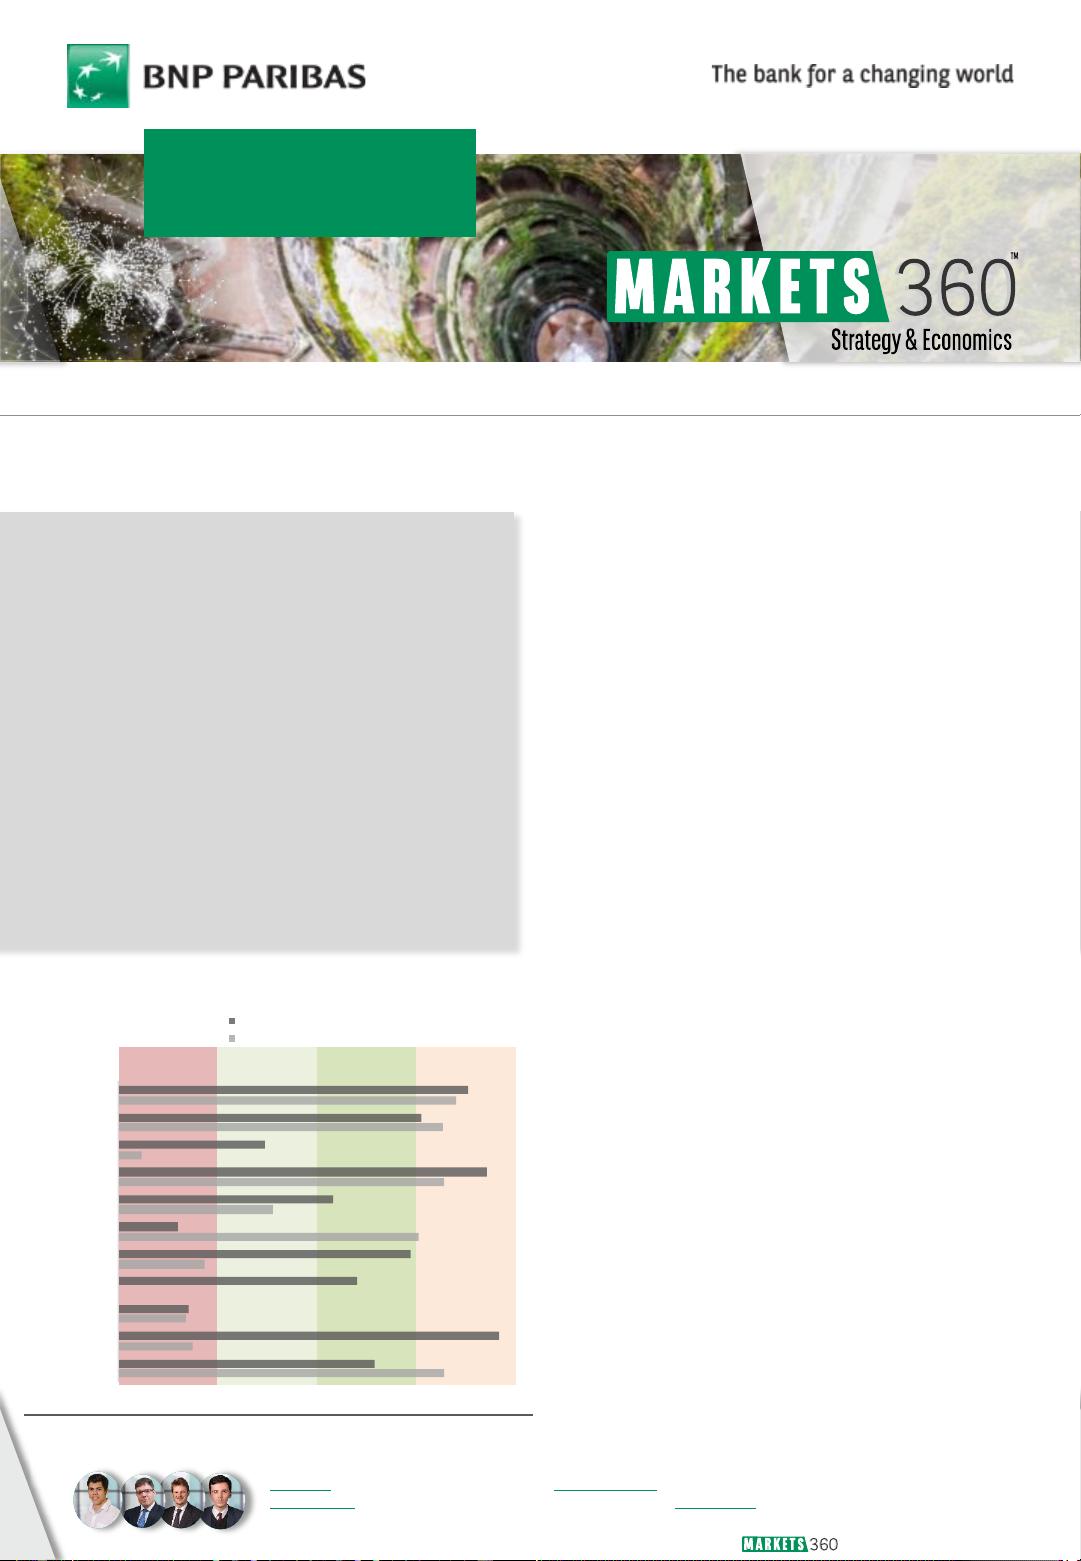
KEY MESSAGES
Bo
th our market-based indicator and an equivalent index
based on published macroeconomic data point to the US,
Eurozone and Japan having entered the late stage of the
economic cycle.
China already seems to have undergone a deceleration and is
in the early stage of a cycle. Markets are ahead of data for
China, suggesting that investors see recent stabilization
as a turning point.
In EMs, Brazil, South Africa and Indonesia are in the
middle stage of the cycle, with prices indicating expansion
in those countries.
Markets look to be ahead of the data in Brazil and Mexico,
but behind the data in South Africa, Turkey and Poland.
See appendix for a technical description of the approach.
P
lease refer to important information at
the end of this report
EM
STRATEGY | MACRO QUANT & DERIVATIVES
Our approach: Economic cycles – also known as
business or trade cycles – refer to the economy-wide
fluctuations in production, trade and general activity.
From a conceptual point of view, a cycle is often
defined by the upward or downward long-term trend
of real GDP and other macro indicators, such as
industrial production, income, employment or sales.
The conventional approach is to gather and sort out
economic variables to determine the phase of the
cycle. But what if data could be modelled to infer the
phase of the cycles from market prices?
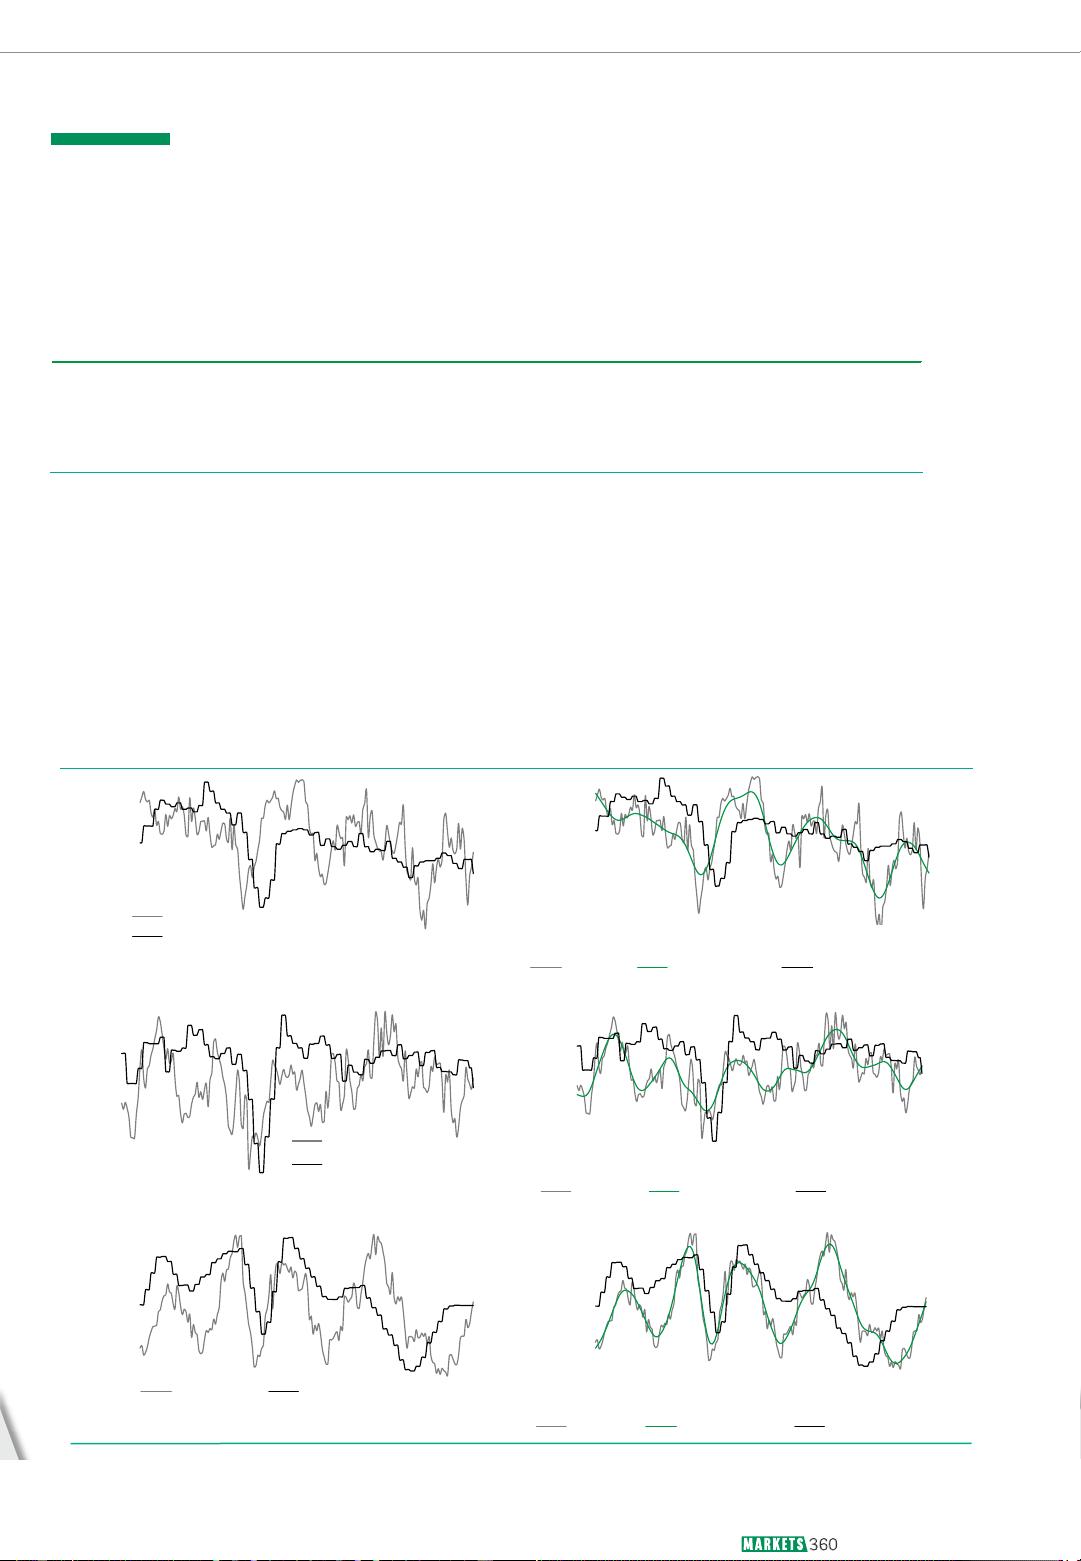
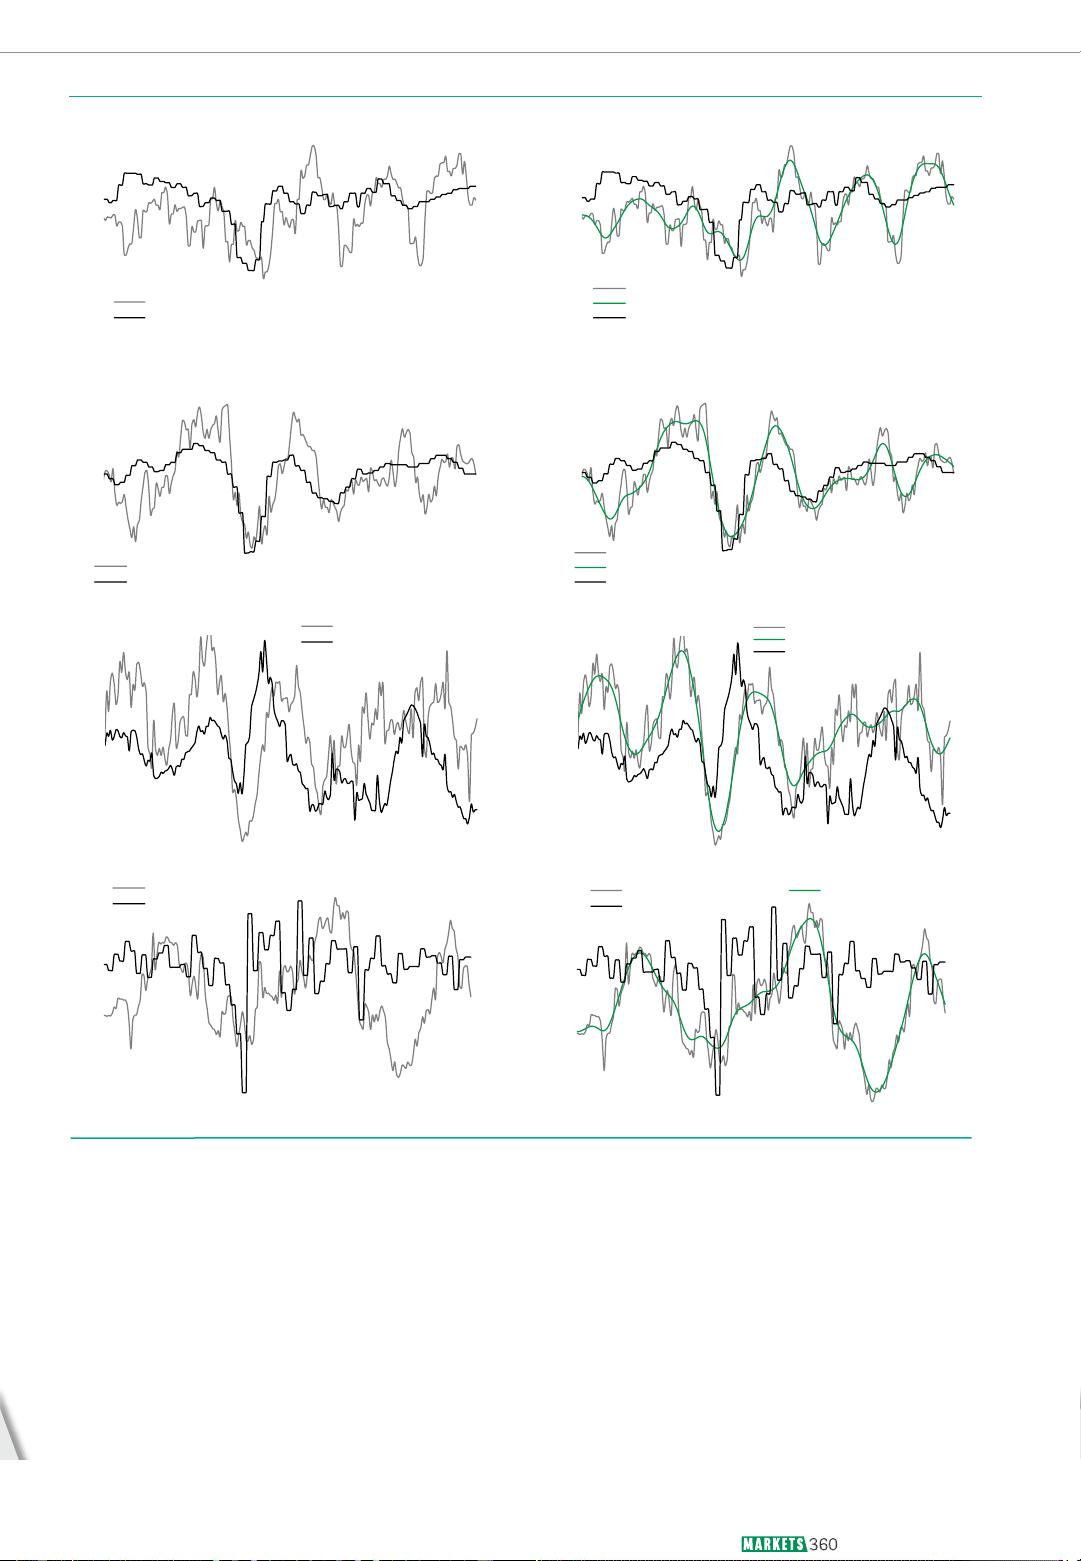
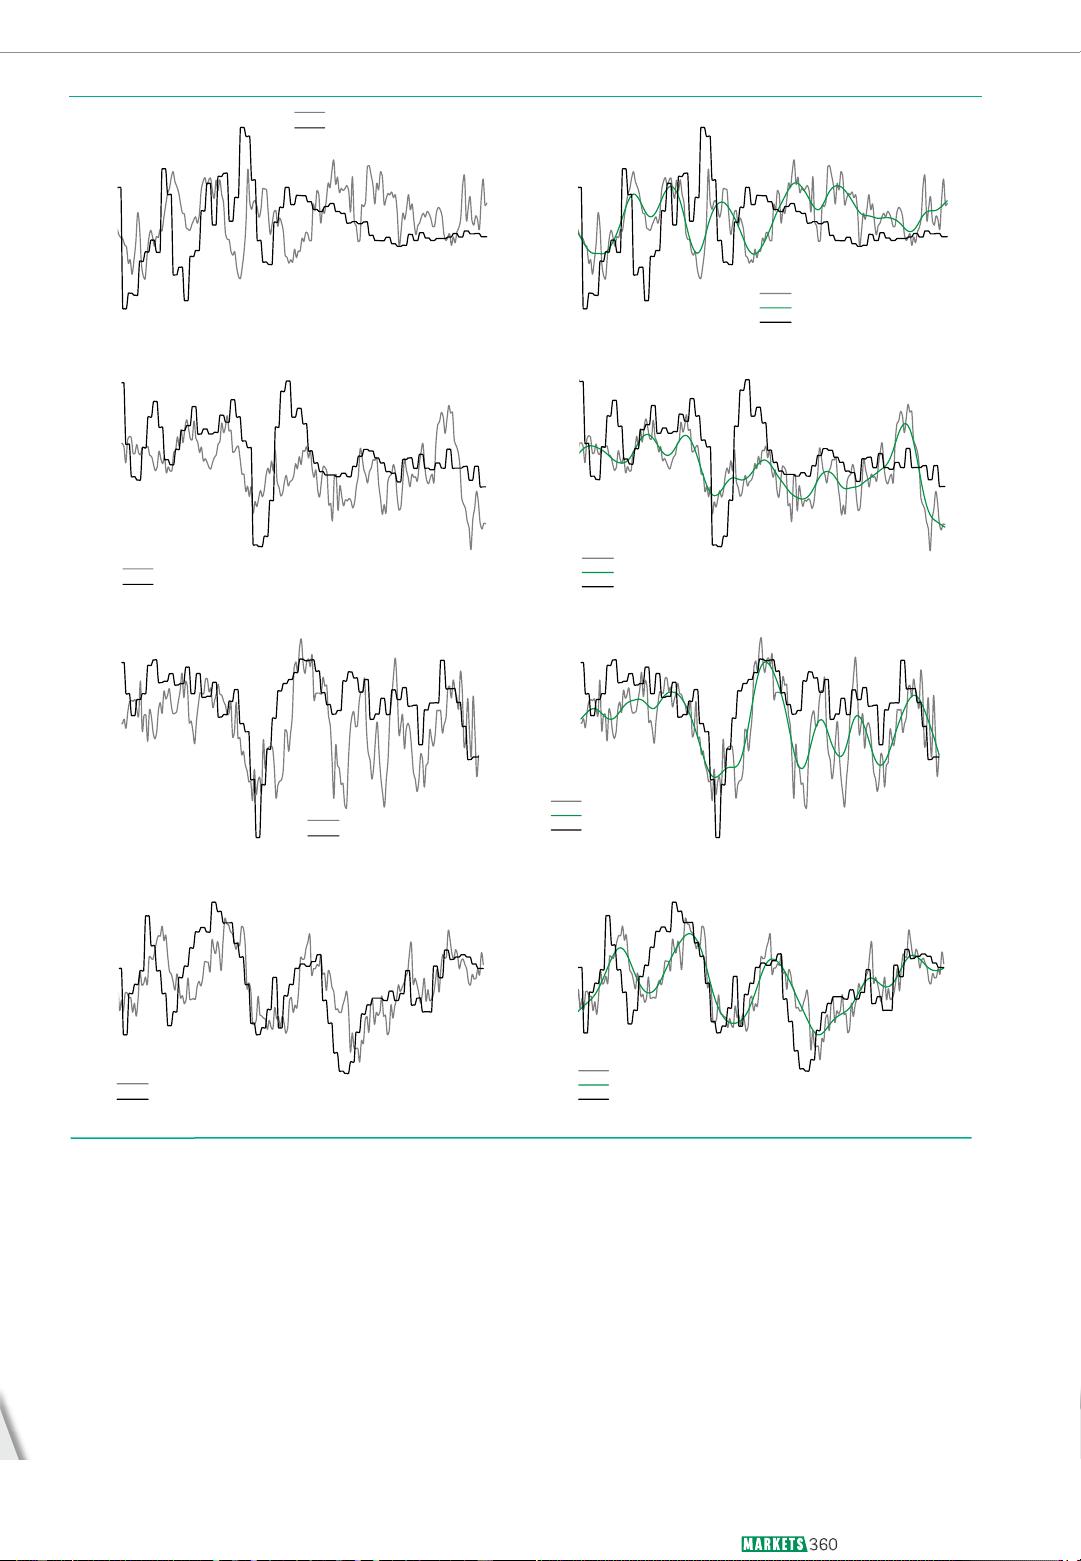
We have designed a quantitative tool that uses the
performance of selected financial assets to extract
the implied stage of the economic cycle.
Unlike the standard approach to economic cycles, we
have used only asset prices to measure the stage,
pace and duration (actual and projected) of the
current cycle for each country.
Since our goal was to extract market perception on
where selected markets are in terms of economic
cycles, we used only mathematical methods to define
the current cycle instead of using regressing
variables or making assumptions.
We also compared our market-based index with an
index we built using a similar method based on
published macroeconomic data.
Our results: The results of our analysis are
illustrated in Figure 1. A full review of the results is
set out by country on pages 6–16 below.
Fig. 1:
Market and economic-based current stage of the cycle
| DEEP DIVE 05/07/2019 2
Luca Maia, EM/FX&IR Latin America Strategy
Gabriel Gersztein, Global Head of Emerging Markets Strategy
Banco BNP Paribas Brasil
We started with three countries – Brazil, Mexico and
South Africa, and have now expanded our framework
to include the US, Eurozone, China, Japan,
Indonesia, South Korea, Turkey and Poland. In order
to determine the part of the economic cycle each
country is in, we developed a unique framework that
uses only market variables related to interest rates,
equities, bonds, break-evens and FX performance
(Table 1).
We already use most of the selected variables in the
models we have in place – such as BEER, interest
rates factor model and debt dynamics for CDS.
Extracting the information
EM STRATEGY | CROSS-ASSET
Table 1: Variables used to extract the implied cycle
Local MSCI financials
Local currency - EM currency return Local MSCI (grow th-value)
MSCI local - MSCI global 1y ex-ante real rate 2y ex-ante real rate
IR Slope 5x1 1y breakeven inflation Equity - Fixed income returns
Local MSCI (Small Caps-Large Caps)
Sources: BNP Paribas
We applied a normalization process to make all our
series comparable, varying inside the interval [-1, +1].
All sub-indices were individually adjusted in a way that
positive numbers indicate a higher perceived economic
growth and negative values – a failing perceived
economic activity (see Technical Appendix for details)
Our index took the average of all normalized sub-
indices using the same positive and negative numbers
criteria on a monthly frequency. The first column of the
figures below shows our proposed index.
Considering that GDP data releases usually lag by a
quarter, in most cases our indicator appeared to
work as a leading indicator for economic activity.
China was the only exception, as we used the first
monetary aggregate change y/y with our index
instead of GDP (Fig. 9) although the calculations were
the same. We applied a Hodrick-Prescott filter (HP
filter), to isolate the trend component from noise and
cyclical factors (second column of the figures).
-6%
-2%
2%
6%
-0.70
-0.40
-0.10
0.20
Jan-03 Jan-06 Jan-09 Jan-12 Jan-15 Jan-18
Cycle Index
South Africal GDP YoY (rhs)
-6%
-2%
2%
6%
-0.50
-0.25
0.00
0.25
Jan-03
Jan-06 Jan-09 Jan-12 Jan-15
Jan-18
Cycle Index Index with HP filter South Africa GDP YoY (rhs)
-9%
-4%
2%
7%
-0.60
-0.30
0.00
0.30
0.60
Jan-03 Jan-06 Jan-09 Jan-12 Jan-15 Jan-18
Cycle Index
Mexico GDP YoY (rhs)
-9%
-4%
2%
7%
-0.60
-0.30
0.00
0.30
0.60
Jan-03
Jan-06 Jan-09
Jan-12
Jan-15 Jan-18
Cycle Index Index with HP filter Mexico GDP YoY (rhs)
-8%
-4%
0%
4%
8%
-0.75
-0.45
-0.15
0.15
0.45
Jan-03 Jan-06 Jan-09 Jan-12 Jan-15 Jan-18
Cyclel Index Brazil GDP YoY (rhs)
-6%
-2%
2%
6%
10%
-0.60
-0.30
0.00
0.30
0.60
Jan-03 Jan-06 Jan-09 Jan-12 Jan-15 Jan-18
Cycle Index Index with HP filter Brazil GDP YoY (rhs)
Fig. 2-7: Brazil, Mexico and South Africa economic cycle index before and after HP filter
Sources: Bloomberg LLP, BNP Paribas
| DEEP DIVE 05/07/2019 3
Luca Maia, EM/FX&IR Latin America Strategy
Gabriel Gersztein, Global Head of Emerging Markets Strategy
Banco BNP Paribas Brasil
EM STRATEGY | CROSS-ASSET
-8%
-4%
0%
4%
8%
-0.75
-0.35
0.05
0.45
Jan-03 Jan-06
Jan-09 Jan-12
Jan-15 Jan-18
Original Index
US GDP YoY (rhs)
-8%
-4%
0%
4%
8%
-0.75
-0.35
0.05
0.45
Jan-03 Jan-06
Jan-09 Jan-12 Jan-15 Jan-18
Original Index
Index with HP filter
US GDP YoY (rhs)
-4%
6%
16%
26%
36%
-0.75
-0.35
0.05
0.45
Jan-03 Jan-06 Jan-09 Jan-12 Jan-15 Jan-18
Original Index
China M1 YoY (rhs)
-4%
6%
16%
26%
36%
-0.75
-0.35
0.05
0.45
Jan-03 Jan-06 Jan-09 Jan-12 Jan-15 Jan-18
Original Index
Index with HP filter
Chinal M1 YoY (rhs)
-8%
-4%
0%
4%
8%
-0.75
-0.35
0.05
0.45
Jan-03 Jan-06 Jan-09 Jan-12 Jan-15 Jan-18
Original Index
Eurozone GDP YoY (rhs)
-8%
-4%
0%
4%
8%
-0.75
-0.35
0.05
0.45
Jan-03 Jan-06 Jan-09 Jan-12 Jan-15 Jan-18
Original Index
Index with HP filter
Eurozone GDP YoY (rhs)
-20%
-12%
-4%
4%
-0.75
-0.35
0.05
0.45
Jan-03 Jan-06 Jan-09 Jan-12 Jan-15 Jan-18
Original Index
Japan GDP YoY (rhs)
-20%
-12%
-4%
4%
-0.60
-0.20
0.20
0.60
Jan-03 Jan-06 Jan-09 Jan-12 Jan-15 Jan-18
Original Index
Index with HP filter
Japan GDP YoY (rhs)
Sources: Bloomberg LLP, BNP Paribas
Fig. 8-15: US, Eurozone, China and Japan economic cycle index before and after HP filter
| DEEP DIVE 05/07/2019 4
Luca Maia, EM/FX&IR Latin America Strategy
Gabriel Gersztein, Global Head of Emerging Markets Strategy
Banco BNP Paribas Brasil
EM STRATEGY | CROSS-ASSET
Sources: Bloomberg LLP, BNP Paribas
Fig. 16-23: Indonesia, Korea, Turkey and Poland economic cycle index before and after HP filter
2%
4%
6%
8%
-0.75
-0.35
0.05
0.45
Jan-03 Jan-06
Jan-09 Jan-12
Jan-15 Jan-18
Original Index
Indonesia GDP YoY (rhs)
2%
4%
6%
8%
-0.75
-0.35
0.05
0.45
Jan-03 Jan-06 Jan-09 Jan-12 Jan-15 Jan-18
Original Index
Index with HP filter
Indonesia GDP YoY (rhs)
-4%
0%
4%
8%
-0.75
-0.35
0.05
0.45
Jan-03 Jan-06 Jan-09 Jan-12 Jan-15 Jan-18
Original Index
Korea GDP YoY (rhs)
-4%
0%
4%
8%
-0.75
-0.35
0.05
0.45
Jan-03
Jan-06 Jan-09 Jan-12 Jan-15 Jan-18
Original Index
Index with HP filter
Korea GDP YoY (rhs)
-15%
-8%
-1%
6%
13%
-0.75
-0.35
0.05
0.45
Jan-03 Jan-06 Jan-09 Jan-12 Jan-15 Jan-18
Original Index
Turkey GDP YoY (rhs)
-15%
-8%
-1%
6%
13%
-0.75
-0.35
0.05
0.45
Jan-03 Jan-06 Jan-09 Jan-12 Jan-15 Jan-18
Original Index
Index with HP filter
Turkey GDP YoY (rhs)
-1%
1%
3%
5%
7%
-0.75
-0.35
0.05
0.45
Jan-03 Jan-06 Jan-09 Jan-12 Jan-15 Jan-18
Original Index
Poland GDP YoY (rhs)
-1%
1%
3%
5%
7%
-0.75
-0.35
0.05
0.45
Jan-03
Jan-06 Jan-09
Jan-12 Jan-15 Jan-18
Original Index
Index with HP filter
Poland GDP YoY (rhs)
剩余24页未读,继续阅读
资源评论
2201_75761617
- 粉丝: 22
- 资源: 7339
上传资源 快速赚钱
- 我的内容管理 展开
- 我的资源 快来上传第一个资源
- 我的收益 登录查看自己的收益
- 我的积分 登录查看自己的积分
- 我的C币 登录后查看C币余额
- 我的收藏
- 我的下载
- 下载帮助
安全验证
文档复制为VIP权益,开通VIP直接复制
信息提交成功