没有合适的资源?快使用搜索试试~ 我知道了~
JP 摩根-亚太地区-金融行业-泰国金融业:经典的“以合理价格增长”投资-313-170页.pdf
需积分: 0 0 下载量 59 浏览量
2023-07-26
11:47:02
上传
评论
收藏 4.09MB PDF 举报
温馨提示
试读
170页
JP 摩根-亚太地区-金融行业-泰国金融业:经典的“以合理价格增长”投资-313-170页.pdf
资源推荐
资源详情
资源评论
Asia Pacific Equity Research
13 March 2019
Thailand Financials
A classic "growth at a reasonable price" investment
Thailand Banks
Harsh Wardhan Modi
AC
(65) 6882-2450
Bloomberg JPMA MODI <GO>
J.P. Morgan Securities Singapore Private
Limited/ J.P. Morgan Securities (Asia Pacific)
Limited
Jidapa Chirawattanakarn
(66-2) 684-2326
JPMorgan Securities (Thailand) Limited
Gaurav Khandelwal
(91-22) 6157 5092
J.P. Morgan India Private Limited
Anurag Rajat, CFA
(65) 6882 2407
anurag.rajat@jpmorgan.com
J.P. Morgan Securities Singapore Private
Limited/ J.P. Morgan Securities (Asia Pacific)
Limited
See page 168 for analyst certification and important disclosures, including non
-
US analyst disclosures.
J.P. Morgan does and seeks to do
business with companies covered in its research reports. As a result, investors should be aware that the
firm may have a conflict of interest that could affect the objectivity of this report. Investors should consider this report as only a single factor in
making their investment decision.
www.jpmorganmarkets.com
We assume coverage of Thailand financials with a positive view despite many
challenges. The key reason to own the sector is a marked step up in EPSg (10% in
2019-20), while multiples are reasonable at 10.4/1.11x P/E/P/B in our view.
Credit costs are coming off from cyclical peaks, further aided by FRS9. NIM
appears to have bottomed, with an underappreciated CASA strength. These
provide earnings visibility. The wait for capex revival has been torturous, but it
stays a potential catalyst. Fee, regulation and digital risks are known, and will
likely intensify we believe. We reflect these in our stock picks. We initiate on
SAWAD with OW, upgrade Tisco to OW, maintain OW on KTB and BBL, while
downgrading KBank to N and SCB to UW.
Earnings are scarce across Asia banks, with nine out of 10 banking sectors
delivering sub-10% EPSg. Thailand financials offer 10% EPSg this and next
year while trading at 10.4x P/E, offering growth and relative value. Credit cost
driven earnings is, by definition, cyclical. Hence, technically, these earnings do
not deserve high multiples. Yet, 2019/20 provisions of 116/101bps are coming
off highs and will likely undershoot through-the-cycle averages. Thus, the
inflection in EPS revisions for the sector is here to stay. Further, Thai banks
offer 4.9% dividend yield and a hedge against risk of a sharp dollar rally.
Re-rating depends on PPoP growth. Our investment case is based on EPSg,
rather than on re-rating. PPoP gr is muted at 3% for 2019-20. Challenges to
operating profit gr include low credit demand (limited capex progress), NIM
stagnation (limited policy rate transmission), fee income decline (migration to
PromptPay continues), and cost pressures (digital investments). Out of these, a
pick-up in infrastructure investments and loan yield hike post elections are more
likely than the rest. Further, higher trade (50% exports/GDP) can lead to
cyclical revival in corporate capex. These pose upside risks to our forecasts.
M&A is likely and a risk to large banks. Equity and liquidity are ample in this
banking system (13% E/A and 1.4% BoP surplus), while credit gr is limited.
This, along with payout reluctance at large banks has likely lowered RoI hurdle
rate for a deal. This is positive for smaller banks as possible targets but
increases the risk of value eroding deal from large banks. On the flip side, an
increase in payout will partly address the risk, reflecting in higher multiples.
What could go wrong? Inventory build-up was high in last 6M. This could
derail AQ recovery, if it continues. Even after coming off 20bps in last 3Y, non-
interest income as a percentage of assets for Thai banks is higher than Asian
average. This suggests risk of further correction. The large banks have high
CASA ratio. This is a cyclical positive, if rates move up. But structurally,
CASA advantage is at risk of being undermined by digital advances, especially
PromptPay and E-KYC. Moreover, search for yield has led to a shift toward
higher-risk loans. Banks contend that use of digital channels will reduce costs,
as well as control credit risk, especially in ‘high-touch’ segments like retail and
SME. This is yet to be tested.
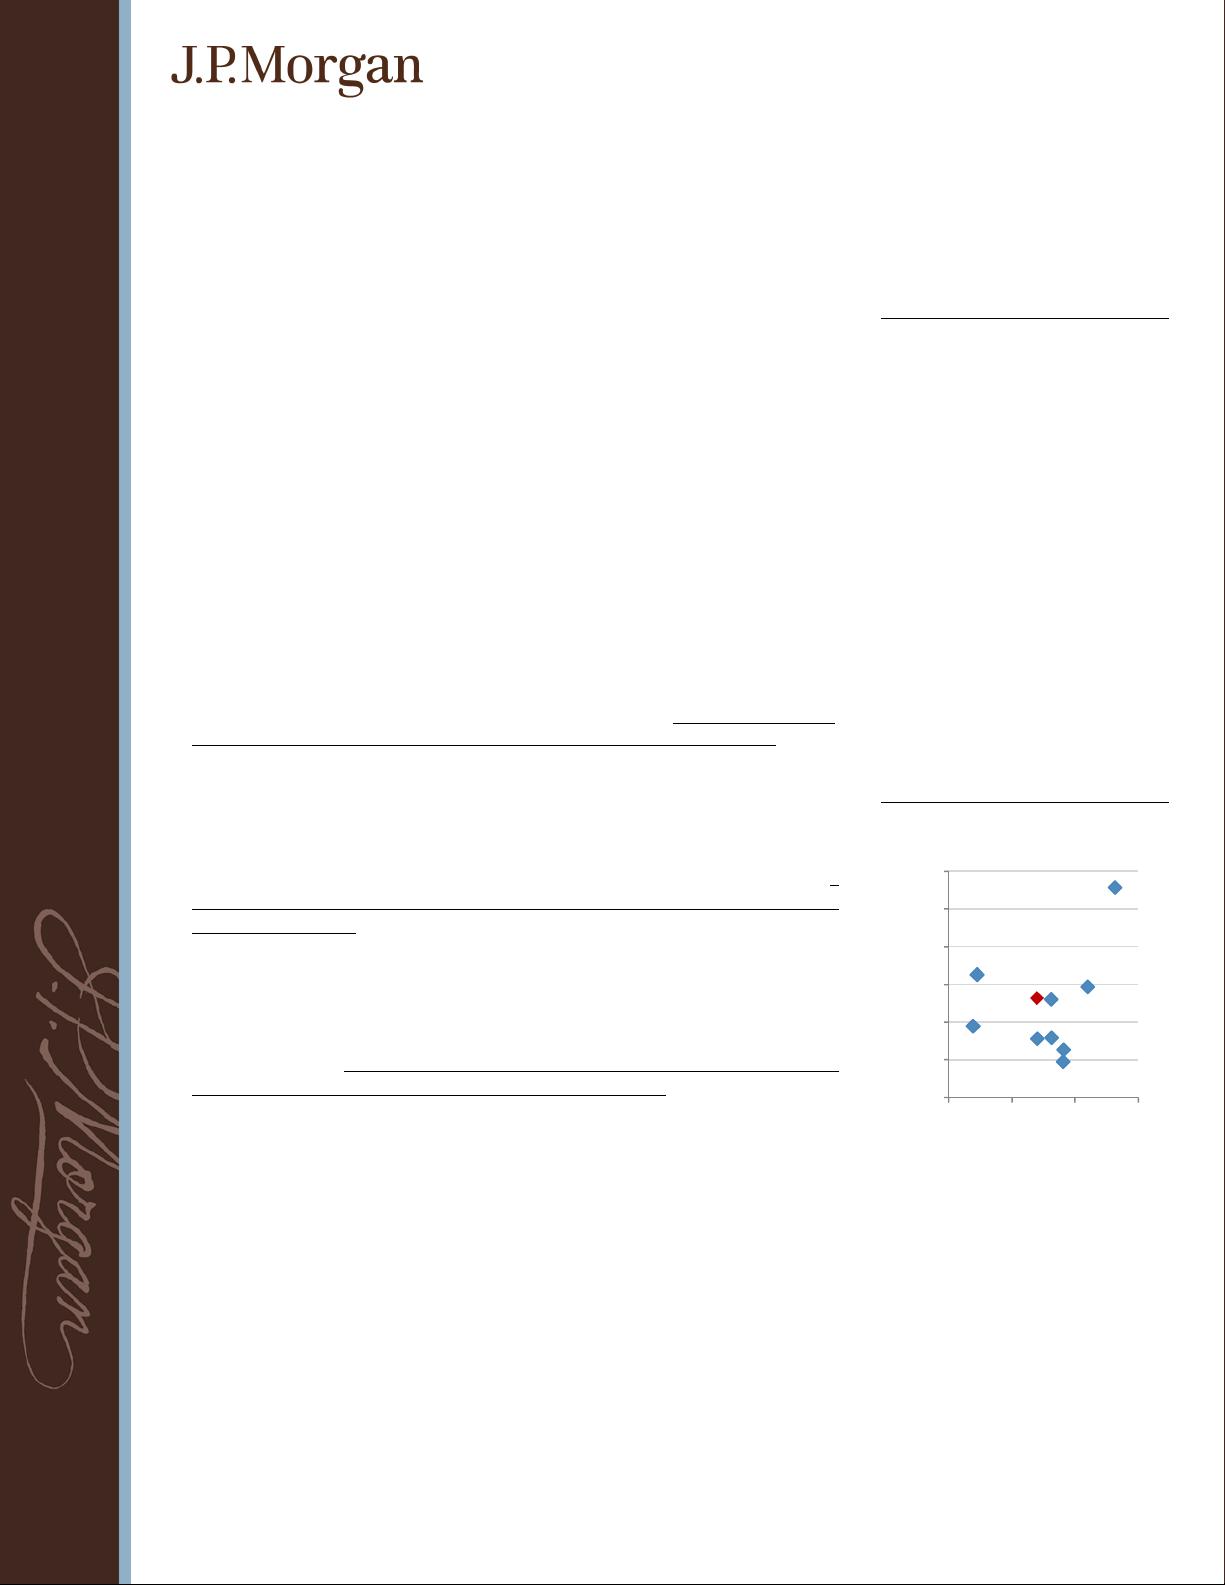
AxJ Banks: P/E vs. EPS CAGR
Source: Bloomberg, J.P. Morgan. Note: Based on 12M
fwd PE and 2018-20E EPS CAGR. Note: Thailand
excludes Sawad.
SG
ID
PH
MY
TH
IN
KR
CH
TW
HK
3%
5%
7%
9%
11%
13%
15%
3.0 8.0 13.0 18.0
EPS CAGR (18-20E)
2019E PE (x)
2
Asia Pacific
Equity Research
13 March 2019
Harsh Wardhan Modi
(65) 6882-2450
Table of Contents
Valuation and DuPont ..............................................................3
Growth at Reasonable Price....................................................4
Thailand Banks compare well on EPSg..................................7
PPoP growth is tough; so is re-rating ..................................12
PromptPay ............................................................................................................13
M&A - good for some, not for all ...........................................14
Drivers for M&A ..................................................................................................14
What can go right?.................................................................19
Fiscal room creates upside risk ..............................................................................19
External demand and private capex........................................................................23
FRS9 led clean-up could support higher payout .....................................................26
Policy rate transmission.........................................................................................28
Domestic portfolio rotation....................................................................................29
What could go wrong?...........................................................30
Slowing external demand partly offset by fiscal space............................................30
Fee income pressure..............................................................................................32
Potential threat to deposit franchise .......................................................................33
Foreign holding limits ............................................................35
Industry & Macro details........................................................37
Banking system.....................................................................................................37
National Credit Bureau..........................................................................................43
Macro Outlook......................................................................................................45
Liquidity & Growth...............................................................................................46
Credit/GDP...........................................................................................................49
Companies ..............................................................................51
Kasikornbank PCL................................................................................................52
Siam Commercial Bank.........................................................................................71
Bangkok Bank ......................................................................................................91
Krung Thai Bank.................................................................................................113
Tisco Financial Group PCL .................................................................................134
Srisawad Corporation PCL..................................................................................151
3
Asia Pacific
Equity Research
13 March 2019
Harsh Wardhan Modi
(65) 6882-2450
Valuation and DuPont
Table 1: Thailand Banks & Financial Companies: Valuation
Ticker PT Rating Price MCap
12M
ADT PE (x) PB (x) Div Yields (%) ROE (%) ROA (%)
(Bt) (Bt) US$ mn US$ mn 2019E 2020E 2019E 2020E 2019E 2020E 2019E 2020E 2019E 2020E
BBL TB 225.00 OW 207.00 12,473 27.06 9.9 9.0 0.90 0.85 3.9 4.3 9.3 9.7 1.25 1.32
KBANK TB 215.00 N 192.50 14,543 45.88 11.1 9.9 1.15 1.07 2.9 3.1 10.7 11.2 1.29 1.38
SCB TB 120.00 UW 130.50 13,988 31.72 10.9 9.5 1.11 1.04 4.6 5.0 10.4 11.3 1.24 1.35
KTB TB 22.00 OW 18.90 8,339 18.79 8.7 8.0 0.82 0.77 4.8 5.3 9.7 10.0 1.09 1.13
TISCO TB 100.00 OW 88.50 2,237 10.65 9.3 9.3 1.80 1.75 8.5 9.0 19.8 19.1 2.52 2.49
SAWAD TB 60.00 OW 49.00 1,864 13.13 15.1 12.6 3.24 2.58 0.0 0.0 25.4 22.8 8.37 7.99
TMB TB NA NR 2.24 3,101 14.11 10.9 9.6 0.94 0.88 3.1 3.3 9.1 9.6 1.01 1.07
TCAP TB NA NR 54.75 1,980 5.05 8.6 7.9 0.90 0.84 4.4 4.7 11.1 11.0 0.95 0.95
BAY TB NA NC 38.25 8,882 0.41 10.4 9.5 1.08 1.00 2.9 3.1 10.7 10.8 1.26 1.29
THANI TB NA NC 6.00 715 2.09 12.1 11.0 2.71 2.36 3.7 4.0 24.2 22.6 3.77 3.67
MTC TB NA NC 43.50 2,911 14.35 18.9 15.0 5.64 4.29 0.9 1.2 34.7 32.4 8.82 8.42
KTC TB NA NC 31.25 2,543 20.90 13.4 12.2 4.06 3.33 2.9 3.2 31.8 28.9 7.10 7.26
AEONTS TB NA NC 181.50 1,432 2.94 12.4 10.9 2.48 2.15 2.7 3.1 21.1 21.1 4.26 4.40
Big 4 10.2 9.1 0.99 0.94 4.0 4.4 10.0 10.5 1.22 1.29
JPM Coverage 10.8 9.7 1.50 1.34 4.1 4.5 14.2 14.0 2.63 2.61
Sector 11.5 10.3 2.06 1.76 3.5 3.8 17.4 17.0 3.30 3.29
Source: Bloomberg, J.P. Morgan. Note: Priced as of 11 March, 2019. Note: Not covered/rated company estimates based on Bloomberg consensus.
Table 2: Thailand Banks: Industry DuPont
Thailand 2014 2015 2016 2017 2018 2019E 2020E 2021E
NIM 3.01 3.09 3.29 3.30 3.26 3.34 3.32 3.31
IEA/Assets 95.1 95.8 95.8 95.3 96.7 98.0 97.9 98.4
NII/Assets 2.86 2.96 3.15 3.14 3.16 3.29 3.26 3.27
Non-II/Assets 1.69 1.91 1.80 1.77 1.70 1.57 1.56 1.58
Rev/Assets 4.55 4.87 4.95 4.91 4.86 4.86 4.82 4.84
Costs/Assets 1.89 1.98 2.05 2.07 2.16 2.19 2.21 2.21
Costs/Income 41.8 40.8 41.8 42.1 44.6 45.2 45.9 45.6
Opt Profits/Assets 2.66 2.89 2.90 2.85 2.70 2.67 2.61 2.63
Credit Costs 0.91 1.55 1.49 1.68 1.28 1.09 0.91 0.84
Loans/Assets 69.5 70.5 69.3 69.2 69.7 71.1 70.7 70.8
RoA 1.58 1.40 1.45 1.33 1.41 1.48 1.53 1.58
Assets/Equity 10.8 9.9 9.1 8.7 8.4 8.2 8.1 8.0
RoE 16.8 13.6 13.2 11.5 11.8 12.0 12.3 12.5
Source: Company data, J.P. Morgan. Note: Data based on banks under JPMe coverage ex Sawad.
4
Asia Pacific
Equity Research
13 March 2019
Harsh Wardhan Modi
(65) 6882-2450
Growth at a Reasonable Price
We assume coverage of Thailand financials with a positive view despite many
challenges. The key reason to own the sector is a marked step up in EPSg (10% in
2019-20), while multiples are reasonable at 10.4/1.11x P/E/P/B we think. Credit
costs are coming off from cyclical peaks, further aided by FRS9. NIM appears to
have bottomed, with an underappreciated CASA strength. These provide earnings
visibility. The wait for capex revival has been torturous, but it stays a potential
catalyst. Fee, regulation and digital risks are known, and will intensify we believe.
We reflect these in our stock picks. We initiate on Sawad with OW, upgrade Tisco
to OW, maintain OW on KTB and BBL, while downgrading KBank to N and SCB to
UW.
Figure 1: Thailand Banks: EPS growth (%, y/y)
Source: Company reports, J.P. Morgan. Note: Data includes JPM coverage universe (ex-SAWAD).
Table 3: Thailand Banks & FIs: EPS growth (last 5Y vs next 3Y)
Last 5Y CAGR (13-18) Next 3Y CAGR (18-21E)
BBL 0% 11%
KBANK -1% 10%
SCB -4% 10%
KTB -3% 6%
TISCO 10% 4%
SAWAD 25% 24%
JPM Coverage 4% 11%
Large Banks (Big 4) -2% 9%
Source: Company data, J.P. Morgan.
Table 4: EPS: JPM vs Street
Bank PT Rating Price JPMe Street JPMe vs Street
(Bt) (Bt) 2019E 2020E 2021E 2019E 2020E 2021E 2019E 2020E 2021E
BBL 225.00 OW 207.00 20.8 23.0 25.3 20.3 22.6 25.13 2% 2% 1%
KBANK 215.00 N 192.50 17.4 19.4 21.6 17.2 19.4 22.04 1% 0% -2%
SCB 120.00 UW 130.50 12.0 13.7 15.6 12.4 13.7 15.10 -3% 0% 3%
KTB 22.00 OW 18.90 2.2 2.4 2.4 2.1 2.3 2.60 3% 2% -7%
TISCO 100.00 OW 88.50 9.5 9.5 9.9 9.0 9.7 10.34 6% -2% -4%
SAWAD 60.00 OW 49.00 3.3 3.9 4.6 2.9 3.5 4.23 11% 10% 9%
Sector 3% 2% 0%
Source: Bloomberg, J.P. Morgan. Note: Priced as of 11
th
March, 2019.
-20%
-10%
0%
10%
20%
30%
2011 2012 2013 2014 2015 2016 2017 2018 2019E 2020E 2021E
10% EPS CAGR at TH banks
5
Asia Pacific
Equity Research
13 March 2019
Harsh Wardhan Modi
(65) 6882-2450
The valuation ranges for Thailand banks suggest meaningful margin for safety. The
stocks are broadly at the lower end of P/B ranges and at the mid of P/E ranges. In
this context, we are calling more for EPS growth driven stock price momentum;
rather than re-rating. Value is available across Asean, but EPSg is not as clear as in
TH in our view
Figure
2
:
Thailand: 10Y PB range charts
–
Normalized
Source: Bloomberg, J.P. Morgan.
Figure
3
: Thailand: 10Y PE range charts
-
Normalized
Source: Bloomberg, J.P. Morgan.
Figure
4
: Thailand: 10Y P
/
B range charts
–
Absolute
Source: Bloomberg, J.P. Morgan.
Figure
5
: Thailand: 10Y P
/
E range charts
–
Absolute
Source: Bloomberg, J.P. Morgan.
Figure
6
: ASEAN: 10Y P
/
B range charts
Source: Bloomberg, J.P. Morgan. Note: TH is ex-SAWAD
Figure
7
: ASEAN: 10Y P
/
E range charts
Source: Bloomberg, J.P. Morgan. Note: TH is ex-SAWAD.
23%
21%
6%
27%
74%
12%
0%
25%
50%
75%
100%
BBL
KBANK
SCB
KTB
TISCO
SAWAD
61%
61%
40%
56%
83%
21%
0%
25%
50%
75%
100%
BBL
KBANK
SCB
KTB
TISCO
SAWAD
0.5
0.7
0.9
1.1
1.3
1.5
1.7
1.9
2.1
2.3
2.5
BBL KBANK SCB KTB TISCO
Current
4.0
6.0
8.0
10.0
12.0
14.0
16.0
BBL KBANK SCB KTB TISCO
Current
18%
22%
41%
35%
31%
0%
25%
50%
75%
100%
MY
PH
SG
ID
TH
48%
30%
27%
60%
60%
0%
25%
50%
75%
100%
MY
PH
SG
ID
TH
剩余169页未读,继续阅读
资源评论
2201_75761617
- 粉丝: 19
- 资源: 7339
上传资源 快速赚钱
- 我的内容管理 展开
- 我的资源 快来上传第一个资源
- 我的收益 登录查看自己的收益
- 我的积分 登录查看自己的积分
- 我的C币 登录后查看C币余额
- 我的收藏
- 我的下载
- 下载帮助
安全验证
文档复制为VIP权益,开通VIP直接复制
信息提交成功