没有合适的资源?快使用搜索试试~ 我知道了~
资源推荐
资源详情
资源评论
WELCOME
Welcome to The Wavelet Tutorial !
It was end of October 1994. I had recently studied fundamentals of wavelet
transform as my graduation project at my undergraduate institution, and I was
planning to use this technique in analyzing signals of biological origin for my
Master's degree thesis. My major professor suggested that I should work on EEG
signals, since they are less studied compared to many
other biological signals.
This, of course, would require a databa
other biological signals.
This, of course, would require a database of EEG signals.
I was in desperate need of finding a database of EEG signals when I decided to
use this project for my Master's degree thesis, Multiresolution Wavelet Analysis
of Event Related Potentials for the Detection of Alzheimer's Disease .
The hospitals were refusing to cooperate in sharing their files, stating that all
patient files were confidential. I have then decided to search the Internet
hoping to find people who may have a database that might be of any use to me. I
told them that I would use the wavelet transform to analyze EEG signals, and
asked them if they had such data to share with me. The majority of the mails I
have received from them were of the type:
Sorry! We do not have any EEG data , but what is this
wavelet
business anyway? If
you can provide some information, we may be able to direct you ...
So I replied and tried to explain what I was after. It didn't take me too long to
realize that I was writing a 4-6 pages of information on wavelet transform all
over again every time someone asked for more information. Furthermore, since most
of those people were from the medical community and had little or no background
in signal processing, I had to start from the definition of a transform. Trying
to explain a relatively new signal processing technique backed with a highly
complex mathematical theory, starting from the definition of the transform was no
easy task.
One thing I suffered while I was learning the basics of the wavelet transform is
the fact that the majority of the articles and books (if not all of them) are
written by
math people
, for the
math people
, in a language which even most of the
math people themselves cannot understand what is going on. I remember that I got
frustrated with all those equations, trying to figure out how and where to use
them. I was so frustrated at that time that I decided to write my own book in
some day.
When I received so many mails about the wavelet transform, I thought that writing
a tutorial could be a starting point for my future dream of writing my own book
of wavelet trasforms. I knew that I had to put it in simple words to make it
understandable to those people. This is how this tutorial was first created.
In the first version of the tutorial, there were absolutely no equations, and it
simply consisted of basic concepts what wavelet transform is all about. I
received an unexpected number of replies from many people around all the world
who were pleasantly surprised in how simple words wavelet transform can be
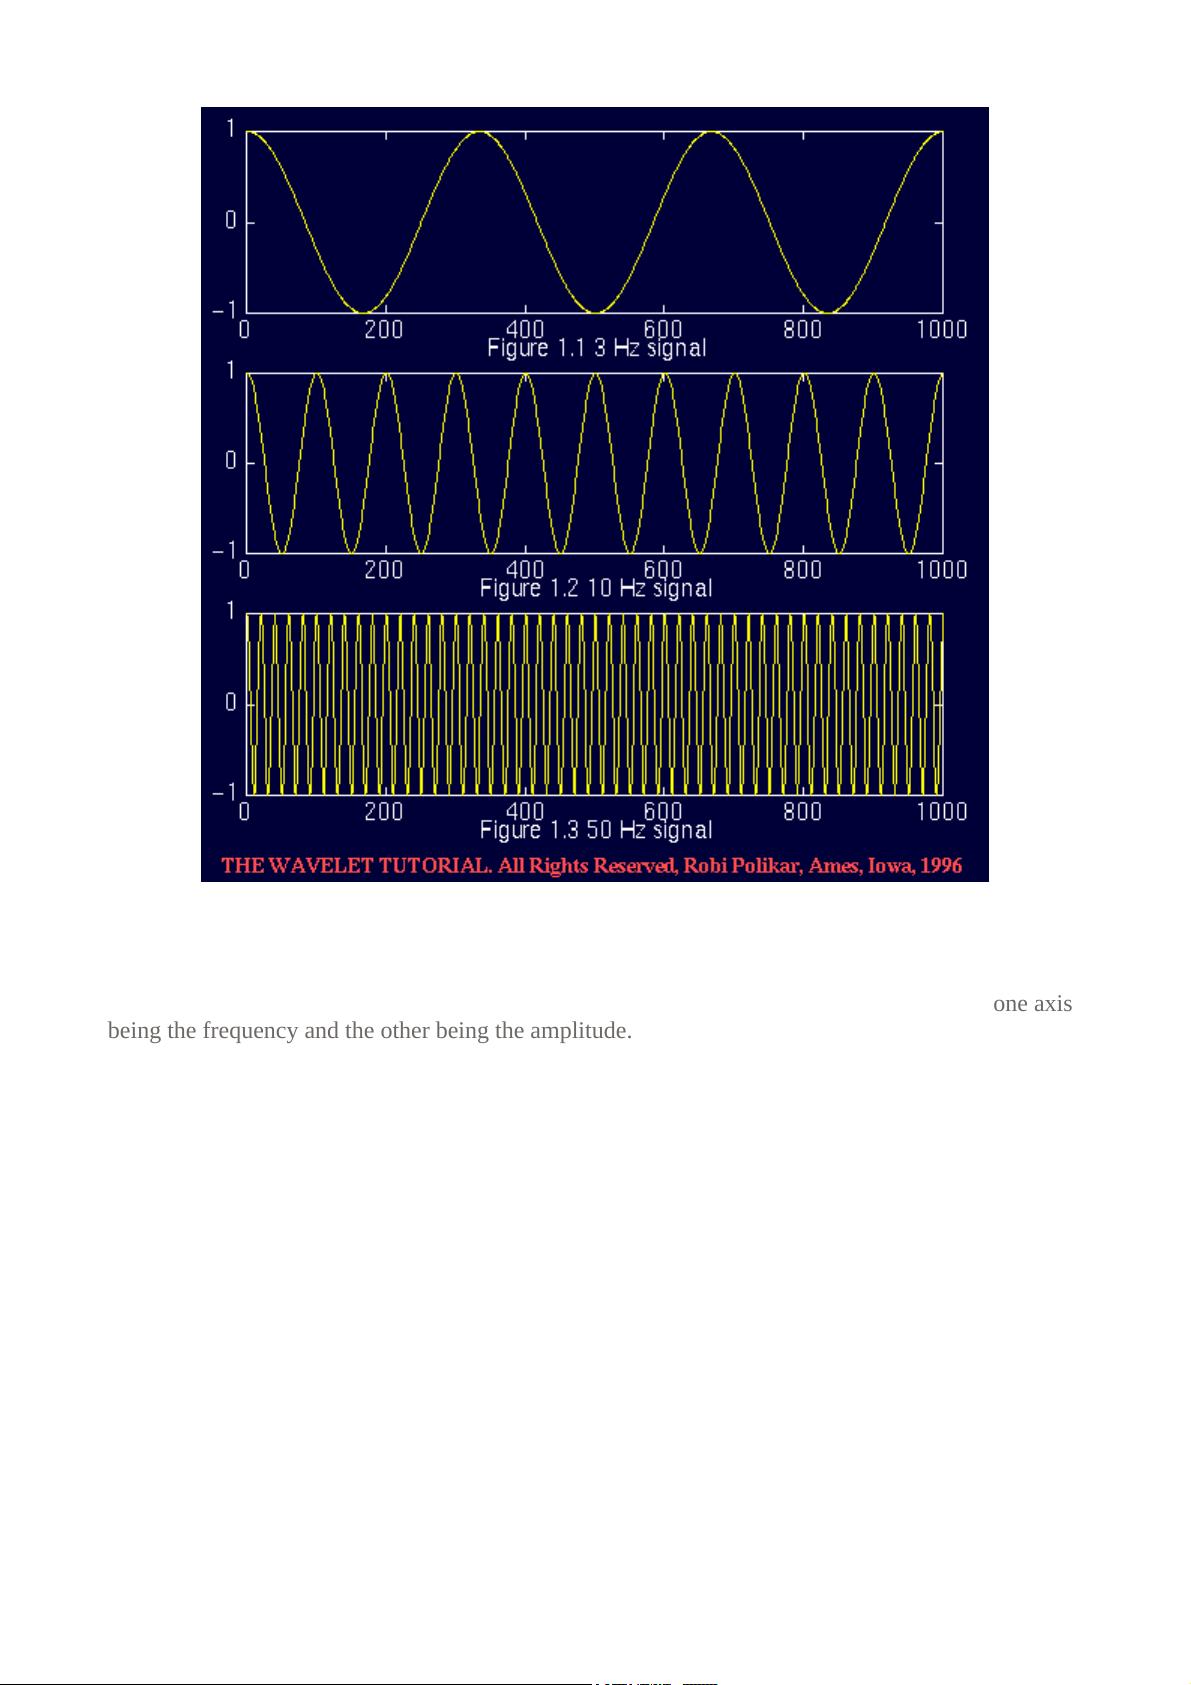
explained . They asked me to give more information, going into a little more
detail. I have then decided to write a complete tutorial covering everything from
Fourier transforms to short time Fourier transform and wavelet transforms.
Part I of this tutorial presents an overview of the basic concepts that are of
importance in understanding the wavelet theory. This part is strictly for those
who have no background in signal processing, somehow heard that some wavelet
thing or other is the way to go. This part summarizes the concept of
transforming, and talks about when and why Fourier transform, by far the most
often used transform in signal processing, might not be a suitable technique to
use.
Part II introduces the Short Term Fourier Transform (STFT), which has been used
to obtain time-frequency representations of non-stationary signals. I think it is
important to fully understand STFT, since wavelet transform was developed as an
alternative to the STFT, to overcome some problems that are inherent to it. By
the end of this part, the reader should be comfortable why and when wavelet
transform needs to be used.
Part III introduces the continuous wavelet transform (CWT), explaining how the
problems inherent to the STFT are solved. This part gives an introduction to the
mathematical backbone of the wavelet transform. Also given in this part are a
couple examples that actually show how WT of a signal look like, something I
could not find in any of the articles or books I have read on WT.
Part IV talks about the discrete wavelet transform, a very effective and fast
technique to compute the WT of a signal. Finally, a bibliography is included for
those who need more than what is given in this tutorial.
I would like to note that I am not an expert on wavelet transform, but just a
user of this method. It is therefore, possible that I might have missed some
important points, or even might have given false information. Should you find any
incomplete, inconsistent, or incorrect information please feel free to inform me.
I will appreciate any comments on this tutorial. This is absolutely necessary to
make this tutorial complete and accurate. I will be most grateful to those
sending their opinions and comments.
I will be throughly happy, if I can be of any service to anyone who would like to
learn wavelet transform with this tutorial.
Robi POLIKAR
06/06/1995,
329 Durham Computation Center,
Iowa State University
Ames, IOWA, 50011
THE WAVELET TUTORIAL
P
ART I
by
ROBI POLIKAR
FUNDAMENTAL CONCEPTS
&
AN OVERVIEW OF THE WAVELET THEORY
Second Edition
Welcome to this introductory tutorial on wavelet transforms. The wavelet transform is a relatively
new concept (about 10 years old), but yet there are quite a few articles and books written on them.
However, most of these books and articles are written by math people, for the other math people;
still most of the math people don't know what the other math people are talking about (a math
p
rofessor of mine made this confession). In other words, majority of the literature available on
wavelet transforms are of little help, if any, to those who are new to this subject (this is my personal
opinion).
When I first started working on wavelet transforms I have struggled for many hours and days to
figure out what was going on in this mysterious world of wavelet transforms, due to the lack of
introductory level text(s) in this subject. Therefore, I have decided to write this tutorial for the ones
who are new to the this topic. I consider myself quite new to the subject too, and I have to confess
that I have not fi
g
ured out all the theoretical details
y
et. However, as far as the en
g
ineerin
g
applications are concerned, I think all the theoretical details are not necessarily necessary (!).
In this tutorial I will try to give basic principles underlying the wavelet theory. The proofs of the
theorems and related equations will not be given in this tutorial due to the simple assumption that the
intended readers of this tutorial do not need them at this time. However, interested readers will be
directed to related references for further and in-depth information.
In this document I am assuming that you have no background knowledge, whatsoever. If you do
have this background, please disregard the following information, since it may be trivial.
Should you find any inconsistent, or incorrect information in the following tutorial, please feel free
to contact me. I will appreciate any comments on this page.
R
obi POLIKAR
************************************************************************
TRANS... WHAT?
First of all, why do we need a transform, or what is a transform anyway?
Mathematical transformations are applied to signals to obtain a further information from that signal
that is not readily available in the raw signal. In the following tutorial I will assume a time-domain
signal as a
raw
signal, and a signal that has been "transformed" by any of the available mathematical
transformations as a
processed
signal.
There are number of transformations that can be applied, among which the Fourier transforms are
p
robably by far the most popular.
Most of the signals in practice, are
TIME-DOMAIN
signals in their raw format. That is, whatever
that signal is measuring, is a function of time. In other words, when we plot the signal one of the
axes is time (independent variable), and the other (dependent variable) is usually the amplitude.
When we plot time-domain signals, we obtain a
time-amplitude representation
of the signal. This
representation is not always the best representation of the signal for most signal processing related
applications. In many cases, the most distinguished information is hidden in the frequency content of
the signal. The
frequency SPECTRUM
of a signal is basically the frequency components (spectral
components) of that signal. The frequency spectrum of a signal shows what frequencies exist in the
signal.
Intuitively, we all
know that the frequency is something to do with the change in rate of something.
If something ( a mathematical or physical variable, would be the technically correct term) changes
rapidly, we say that it is of high frequency, where as if this variable does not change rapidly, i.e., it
changes smoothly, we say that it is of low frequency. If this variable does not change at all, then we
say it has zero frequency, or no frequency. For example the publication frequency of a daily
newspaper is higher than that of a monthly magazine (it is published more frequently).
The frequency is measured in cycles/second, or with a more common name, in "Hertz". For example
the electric power we use in our daily life in the US is 60 Hz (50 Hz elsewhere in the world). This
means that if you try to plot the electric current, it will be a sine wave passing through the same point
50 times in 1 second. Now, look at the following figures. The first one is a sine wave at 3 Hz, the
second one at 10 Hz, and the third one at 50 Hz. Com
p
are them.
So how do we measure frequency, or how do we find the frequency content of a signal? The answer
is
FOURIER TRANSFORM (FT)
. If the FT of a signal in time domain is taken, the frequency-
amplitude representation of that signal is obtained.
In other words, we now have a plot with
one axis
being the frequency and the other being the amplitude. This plot
tells us how much of each
frequency exists in our signal.
The fr
equency axis starts from zero, and goes up to infinity. For every frequency, we have an
amplitude value. For example, if we take the FT of the electric current that we use in our houses, we
will have one spike at 50 Hz, and nothing elsewhere, since that signal has only 50 Hz frequency
component. No other signal, however, has a FT which is this simple. For most practical purposes,
signals contain more than one frequency component. The following shows the FT of the 50 Hz
si
g
nal:
剩余61页未读,继续阅读
资源评论
- zihanbuding2016-07-16经典文章,必须赞一个.多谢楼主分享!
- niannuo36572017-10-12经典文章,点个赞
zhaoroby
- 粉丝: 1
- 资源: 2
上传资源 快速赚钱
- 我的内容管理 展开
- 我的资源 快来上传第一个资源
- 我的收益 登录查看自己的收益
- 我的积分 登录查看自己的积分
- 我的C币 登录后查看C币余额
- 我的收藏
- 我的下载
- 下载帮助
安全验证
文档复制为VIP权益,开通VIP直接复制
信息提交成功