没有合适的资源?快使用搜索试试~ 我知道了~
电阻抗断层成像开源软件eidors3.8的使用方法
1星 需积分: 45 88 下载量 82 浏览量
2017-09-28
21:13:26
上传
评论 13
收藏 1.67MB PDF 举报
温馨提示
试读
64页
详细讲解了电阻抗断层成像开源软件eidors3.8的使用方法,包括各个模型的建立和仿真的MTLAB程序和结果
资源推荐
资源详情
资源评论
EIDORS Examples
To run these tutorials, you need to download and install EIDORS and then run this command in a matlab (or octave) session.
>>run /path/to/eidors3d/startup.m
EIDORS Image Reconstruction
EIDORS fwd_models
Create a simple 3D fwd_model structure
EIDORS has functions to create common FEM models.
% Create fwd models
% $Id: tutorial010a.m,v 1.1 2007/06/15 18:17:51 aadler Exp $
subplot(121);
% 2D Model
imdl_2d= mk_common_model('b2c',16);
show_fem(imdl_2d.fwd_model);
axis square
subplot(122);
% 3D Model
imdl_3d= mk_common_model('n3r2',16);
show_fem(imdl_3d.fwd_model);
axis square; view(-35,14);
%print -r75 -dpng tutorial010a.png;
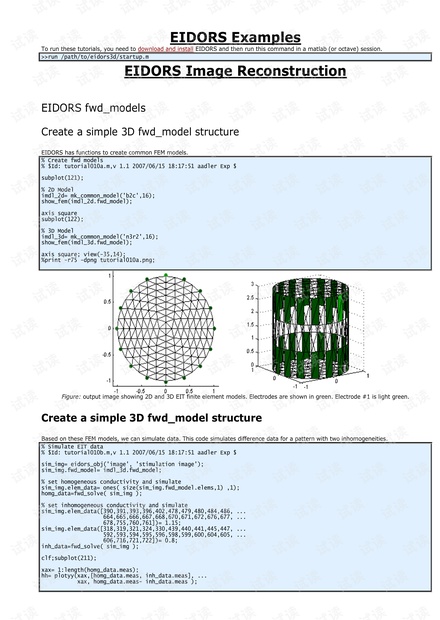
Figure: output image showing 2D and 3D EIT finite element models. Electrodes are shown in green. Electrode #1 is light green.
Create a simple 3D fwd_model structure
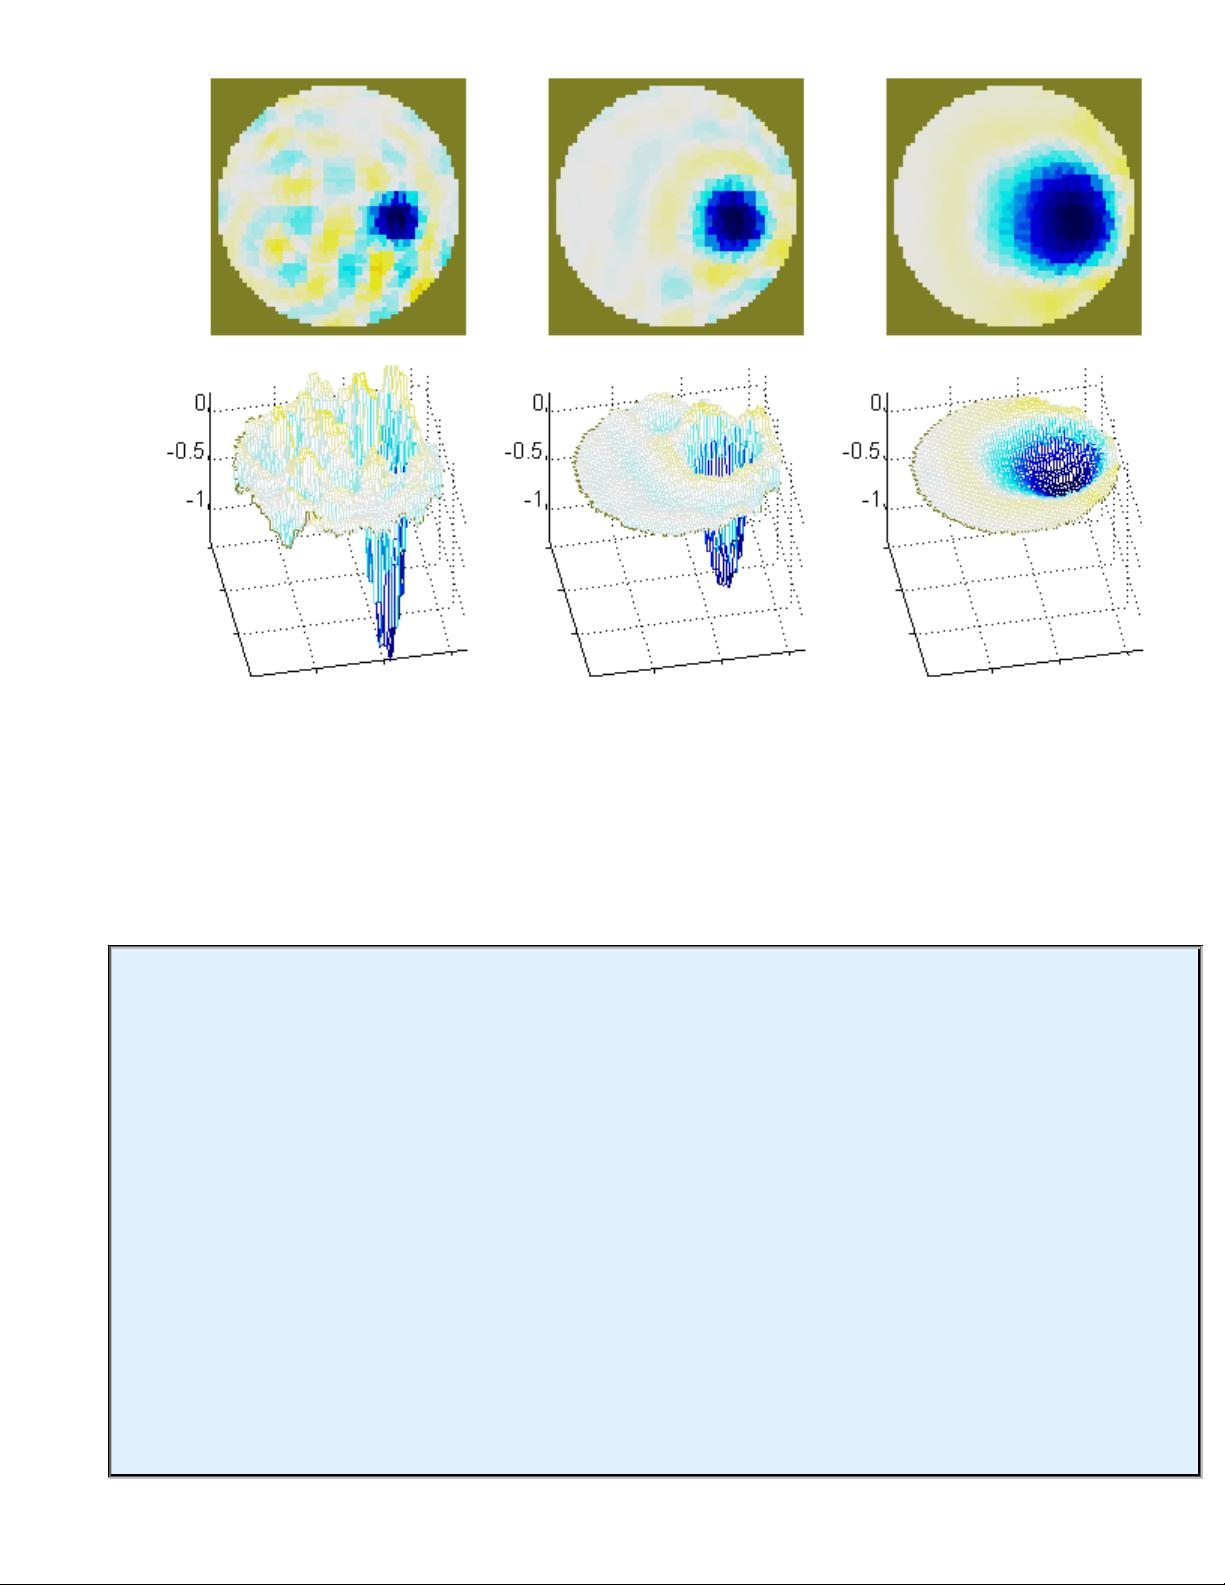
Based on these FEM models, we can simulate data. This code simulates difference data for a pattern with two inhomogeneities.
% Simulate EIT data
% $Id: tutorial010b.m,v 1.1 2007/06/15 18:17:51 aadler Exp $
sim_img= eidors_obj('image', 'stimulation image');
sim_img.fwd_model= imdl_3d.fwd_model;
% set homogeneous conductivity and simulate
sim_img.elem_data= ones( size(sim_img.fwd_model.elems,1) ,1);
homg_data=fwd_solve( sim_img );
% set inhomogeneous conductivity and simulate
sim_img.elem_data([390,391,393,396,402,478,479,480,484,486, ...
664,665,666,667,668,670,671,672,676,677, ...
678,755,760,761])= 1.15;
sim_img.elem_data([318,319,321,324,330,439,440,441,445,447, ...
592,593,594,595,596,598,599,600,604,605, ...
606,716,721,722])= 0.8;
inh_data=fwd_solve( sim_img );
clf;subplot(211);
xax= 1:length(homg_data.meas);
hh= plotyy(xax,[homg_data.meas, inh_data.meas], ...
xax, homg_data.meas- inh_data.meas );
2
set(hh,'Xlim',[1,max(xax)]);
print -r75 -dpng tutorial010b.png
Figure: Simulated voltages from 3D EIT mesh. Right axis (left) shows the difference signal due to an inhomogeneity.
Reconstruct images
Using these difference data sets, an image may be reconstructed.
% Reconstruct images
% $Id: tutorial010c.m,v 1.4 2007/08/30 03:58:27 aadler Exp $
subplot(131)
show_fem(sim_img);
%Add 20dB SNR noise to data
noise_level= std(inh_data.meas - homg_data.meas)/10^(20/20);
inh_data.meas = inh_data.meas + noise_level* ...
randn(size(inh_data.meas));
%reconstruct
rec_img= inv_solve(imdl_3d, homg_data, inh_data);
% Show reconstruction as a 3D mesh
subplot(132)
show_fem(rec_img)
subplot(133)
show_slices(rec_img,[inf,inf,2.0,1,1; ...
inf,inf,1.0,1,2]);
pp=get(gcf,'paperposition');
set(gcf,'paperposition',pp.*[1,1,1.4,1]);
print -r75 -dpng tutorial010c.png
set(gcf,'paperposition',pp.*[1,1,1,1]);
Figure: Left: Simulation image; Middle: Reconstructed image (as mesh); Right: Reconstructed image slices at z=1.0 and z=2.0.
3
EIDORS image reconstructions
EIDORS data structures: the inv_model
The EIDORS inv_model describes all the parameters as part of image reconstruction
% Basic Image reconstruction
% $Id: tutorial110a.m,v 1.4 2007/09/04 15:26:02 aadler Exp $
% Load some data
load iirc_data_2006
% grey background
calc_colours('greylev',-.1);
% Get a 2D image reconstruction model
imdl= mk_common_model('c2c');
vi= real(v_rotate(:,9))/1e4; vh= real(v_reference)/1e4;
for idx= 1:3
if idx==1
imdl.hyperparameter.value= 1e-4;
elseif idx==2
imdl.hyperparameter.value= 3e-3;
elseif idx==3
imdl.hyperparameter.value= 1e-1;
end
img= inv_solve(imdl, vh, vi);
subplot(2,3,idx);
show_slices(img);
subplot(2,3,idx+3);
z=calc_slices(img);
c=calc_colours(z);
h=mesh(z,c); view(-11,44);
set(h,'CDataMapping','Direct');
set(gca,{'XLim','YLim','ZLim','XTickLabel','YTickLabel'}, ...
{[1 64],[1 64],[-1.3,0.2],[],[]})
end
print -r100 -dpng tutorial110a.png;
4
Figure: Image reconstructions shown as images (top) or meshes (bottom) for different hyperparameter values.
GN reconstruction vs Backprojection
This tutorial shows how one can approximate backprojection image reconstruction with EIDORS.
Calculate the nodal voltage field
%$Id: backproj_solve01.m,v 1.1 2007/10/15 20:32:47 aadler Exp $
imdl= mk_common_model('c2c',16);
fmdl= imdl.fwd_model;
ee= fmdl.elems';
xx= reshape( fmdl.nodes(ee,1),3, []);
yy= reshape( fmdl.nodes(ee,2),3, []);
homog= ones(size(fmdl.elems,1),1);
img= eidors_obj('image','','elem_data',homog);
for i=1:4
if i==1; stim= [0,1];
elseif i==2; stim= [0,2];
elseif i==3; stim= [0,4];
elseif i==4; stim= [0,8];
end
fmdl.stimulation = mk_stim_patterns(16,1,stim,[0 1], {}, 1);
img.fwd_model= fmdl;
node_v= calc_all_node_voltages( img );
% show voltages at measurement 2
zz= reshape( node_v(ee,4),3, []);
subplot(2,4,i); cla
patch(xx,yy,zz,zz); view(0, 4); axis off
subplot(2,4,i+4); cla
patch(xx,yy,zz,zz); view(0,34); axis off
end
print -r125 -dpng backproj_solve01a.png;
5
Figure: Nodal voltages in a mesh with different stimulation patterns. From Left to right: Adjacent stimulation ([0 1]), 45° stimulation ([0 2]),
90° stimulation ([0 4]), 180° stimulation ([0 8])
Calculate Equipotential lines
% $Id: backproj_solve02.m,v 1.4 2007/10/16 01:18:40 aadler Exp $
for idx=1:3
if idx==1; mdltype= 'b2c';
elseif idx==2; mdltype= 'd2c2';
elseif idx==3; mdltype= 'd2t2';
end
imdl= mk_common_model(mdltype,16);
fmdl= imdl.fwd_model;
params= aa_fwd_parameters( fmdl );
homog= ones(size(fmdl.elems,1),1);
img= eidors_obj('image','','elem_data',homog);
img.fwd_model= fmdl;
node_v= calc_all_node_voltages( img );
elem_v= reshape(node_v( fmdl.elems',:),3,[],16);
elem_v= squeeze(mean(elem_v,1));
meas_v= params.N2E * node_v;
sel= 4;
ed= elem_v(:,sel);
img.elem_data= ed;
subplot(2,3,idx);
show_fem(img);
ej = zeros(size(ed));
for i=1:16
ej= ej + ( ed < meas_v(i,sel) );
end
img.elem_data= ej;
subplot(2,3,idx+3);
show_fem(img);
end
print -r125 -dpng backproj_solve02a.png;
剩余63页未读,继续阅读
资源评论
- zhu04162017-11-06显示文档打不开啊,说文档错误
zyk1120102464
- 粉丝: 67
- 资源: 1
上传资源 快速赚钱
- 我的内容管理 展开
- 我的资源 快来上传第一个资源
- 我的收益 登录查看自己的收益
- 我的积分 登录查看自己的积分
- 我的C币 登录后查看C币余额
- 我的收藏
- 我的下载
- 下载帮助
最新资源
- Allegro CIS 用的Access MDB库,用于CIS配置
- 状态估计-融合GPS+IMU+编码器传感器实现的准确的状态估计-附项目源码-优质项目实战.zip
- 基于FPGA深度学习的液晶屏 7 寸 LCD 显示测试,适合FPGA初学者
- 05-13 周一 量化是什么
- Hikyuu 2.0.6 高性能量研究框架 Python 离线帮助文档
- 实体门店店铺便利小程序
- 基于深度学习pytorch框架的单通道EEG睡眠分期项目Python源码.zip
- Screenshot_20240424_135712.jpg
- AW869A-User-Manual-V1.0.pdf
- Hikyuu 2.0.6 高性能量研究框架 C++ 离线帮助文档
资源上传下载、课程学习等过程中有任何疑问或建议,欢迎提出宝贵意见哦~我们会及时处理!
点击此处反馈
安全验证
文档复制为VIP权益,开通VIP直接复制
信息提交成功