没有合适的资源?快使用搜索试试~ 我知道了~
VPIphotonicsAnalyzer.pdf
需积分: 0 17 下载量 66 浏览量
2022-12-14
16:20:54
上传
评论
收藏 1.01MB PDF 举报
温馨提示
试读
74页
VPIphotonicsAnalyzer.pdf
资源推荐
资源详情
资源评论
User Interface Reference 107
C hapte r 2
VPIphotonicsAnalyzer
VPIphotonicsAnalyzer™ is a powerful data visualization and analysis tool that works with
optical, electrical and numerical inputs. This chapter describes the VPIphotonicsAnalyzer
user interface, explains the purpose of each panel and provides detailed information on
the commands and options you can use to adjust the presentation of your simulation data.
The following topics are covered:
• User Interface Overview
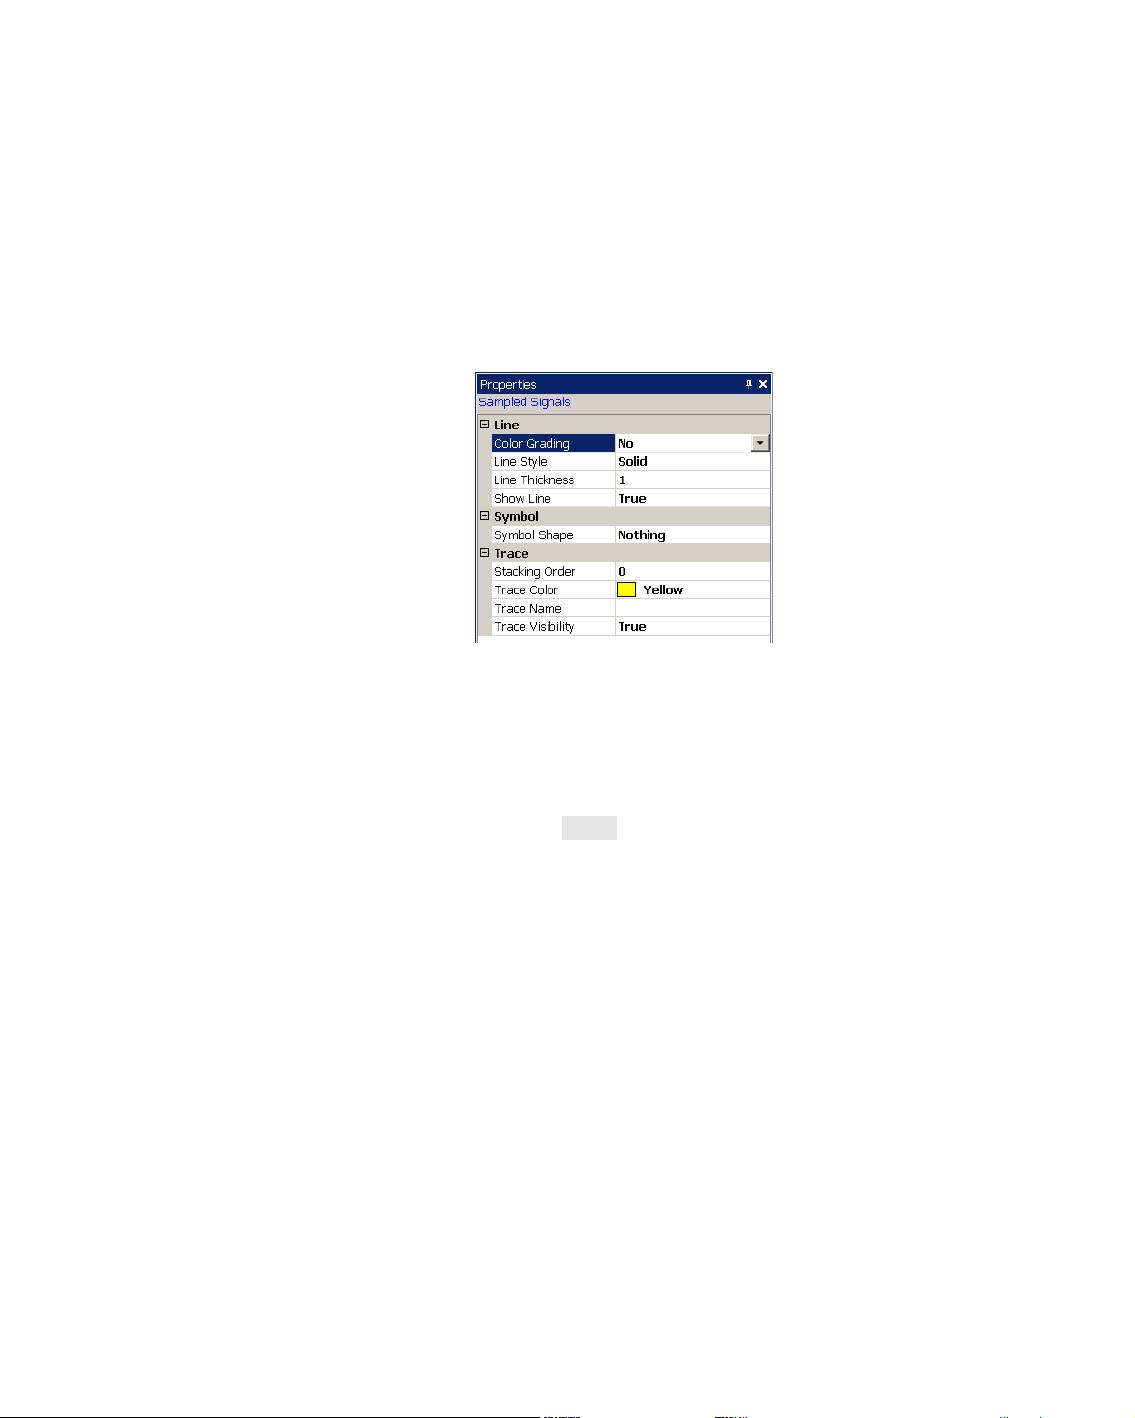
• Properties of Objects on the Chart
• Analyzer Manager
• Analyzer Settings
• Exporting and Importing Data
• Copying Traces
The signal can be shown and analyzed in eight modes: OSA, Scope, Eye, RFSA, Poincare,
Numerical, Constellation and Slice. The first five modes are designed to work with optical
and electrical signals as provided by the VPI Design Suite products. Numerical mode is
designed to work with ordinary numerical data in integer and float form. Constellation and
Slice mode are designed for quadrature-modulated signal analysis.
For optical input, you can switch between OSA, Scope, Eye and Poincare modes. The RFSA,
Scope and Eye modes are available for electrical inputs. VPIphotonicsAnalyzer works with
signals in both block and sample modes.
For information on how to use each analyzer mode, see Chapter 10, “Analyzing Simulation
Results” in the VPIphotonics Design Suite™ Simulation Guide.
Chapter 2 VPIphotonicsAnalyzer
108 VPIphotonics Design Suite™
User Interface Overview
The VPIphotonicsAnalyzer application window includes the areas shown in Figure 2-1.
Figure 2-1 VPIphotonicsAnalyzer User Interface (in Eye mode)
Menu Bar
Window Bar
Panels
Panel
Iteration
Results
Selector
Panels
Docked
Toolbars
Chart
User Interface Overview
User Interface Reference 109
Panels
The following panels are available in the VPIphotonicsAnalyzer window:
• Control Panel
• Analyzer Manager
• Properties Panel
• Input Selector
• Iteration Selector
• Window Bar
• Marker Readings Panel
• Message Window
Panels can be moved anywhere in the VPIphotonicsAnalyzer window. When you drag and
drop one panel onto another, they join into a single panel with tabs and you can select the
desired panel by clicking on the corresponding tab.
A panel can be docked to the window edge by dragging it close to the border. When a panel
is docked, it can be pinned/unpinned by clicking the button in the title bar.
When a panel is in the “pinned” state, it is always shown. In the “unpinned” state, it is
automatically hidden after a short delay — to see it again, hover over its name near the
window border with the mouse. By default, the Message Window and Input Selector are in
the unpinned state.
A detailed description of each panel is provided in the sections below.
Control Panel
The Control Panel contains a set of different panels for settings and analysis. The panel
can be opened or closed by clicking the corresponding toolbar button. For example,
Figure 2-1 on page 108 shows the Amplitude Analysis control panel with the Mean Ones
and Mean Zeros options selected. If the BER Analysis button is pressed, the BER Analysis
control panel will appear with the settings available for BER analysis.
Note: Each Analyzer mode provides a different set of panels. The Common Settings
panel is available in all modes.
Chapter 2 VPIphotonicsAnalyzer
110 VPIphotonics Design Suite™
Analyzer Manager
The Analyzer Manager is a tool that allows you to view and select objects presented on the
chart. The Analyzer Manager is organized in the tree form as shown in Figure 2-2.
Figure 2-2 Sample Analyzer Manager contents
The first (top) level of the tree contains the names of simulations for which analyzer
entries are available. Simulations are shown in the same order in which they have been
executed in VPI Design Suite.
The tree contains all objects available on the chart. You can select one or more objects in
the Analyzer Manager and switch to the Properties panel to edit their properties.
You can switch between available VPIphotonicsAnalyzer modes by double-clicking a
corresponding object in the Analyzer Manager. To switch between the various
VPIphotonicsAnalyzer modes, make sure that the Show inactive analyzer tool option is
enabled under Tools > Options > Analyzer Manager. This provides an alternative way to
navigate between different modes of the current simulation (you can also use the Analysis
menu or the toolbar buttons).
If you closed any of the windows visualizing a signal, they can be reopened by
double-clicking the corresponding objects in the Analyzer Manager. For example, a closed
OSA chart will be shown again when you double-click the OSA node in the Analyzer
Manager tree.
For details, see “Analyzer Manager” on page 159.
User Interface Overview
User Interface Reference 111
Properties Panel
The Properties panel is used to change the settings of objects on the chart. It can be
accessed by choosing Properties panel from the View menu or by double-clicking an
object on the chart. You can also choose an object in the Analyzer Manager and then
switch to the Properties panel to access the settings for the selected object (the properties
of some objects can be accessed only in this way).
Figure 2-3 shows an example of the Properties panel for a sampled signal trace object.
Figure 2-3 Properties panel for a simple object (line)
Each entry in the Properties panel corresponds to an attribute of the selected object.
These attributes include color, line width, font size, symbol shape, content of text lines,
and so on.
The Properties panel does not have Apply, OK, or Cancel buttons. Your changes are
applied automatically when you press
ENTER or change focus.
Parameters are divided into groups, as shown in Figure 2-3.
Input Selector
When there are several inputs, the Input Selector is used to choose the inputs you want to
show in the chart. For example, in Figure 2-4 the Input Selector is shown with three of five
inputs selected. When an input is not selected, it will not be displayed in the chart and no
analysis will be performed for the data it contains. The input name forms the common part
of the legend for multiple traces that belong to the same input. The name can be edited
directly in the Input Selector.
剩余73页未读,继续阅读
资源评论
瘦尽灯花813
- 粉丝: 1
- 资源: 7
上传资源 快速赚钱
- 我的内容管理 展开
- 我的资源 快来上传第一个资源
- 我的收益 登录查看自己的收益
- 我的积分 登录查看自己的积分
- 我的C币 登录后查看C币余额
- 我的收藏
- 我的下载
- 下载帮助
最新资源
- 论文(最终)_20240430235101.pdf
- 基于python编写的Keras深度学习框架开发,利用卷积神经网络CNN,快速识别图片并进行分类
- 最全空间计量实证方法(空间杜宾模型和检验以及结果解释文档).txt
- 5uonly.apk
- 蓝桥杯Python组的历年真题
- 2023-04-06-项目笔记 - 第一百十九阶段 - 4.4.2.117全局变量的作用域-117 -2024.04.30
- 前端开发技术实验报告:内含4四实验&实验报告
- Highlight Plus v20.0.1
- 林周瑜-论文.docx
资源上传下载、课程学习等过程中有任何疑问或建议,欢迎提出宝贵意见哦~我们会及时处理!
点击此处反馈
安全验证
文档复制为VIP权益,开通VIP直接复制
信息提交成功