pca_lecture.pdf
版权申诉
136 浏览量
2023-06-18
13:15:15
上传
评论
收藏 231KB PDF 举报

Principal Component Analysis
ML 2022: Machine Learning
Location: https://people.sc.fsu.edu/∼jburkardt/classes/ml 2022/pca lecture/pca lecture.pdf
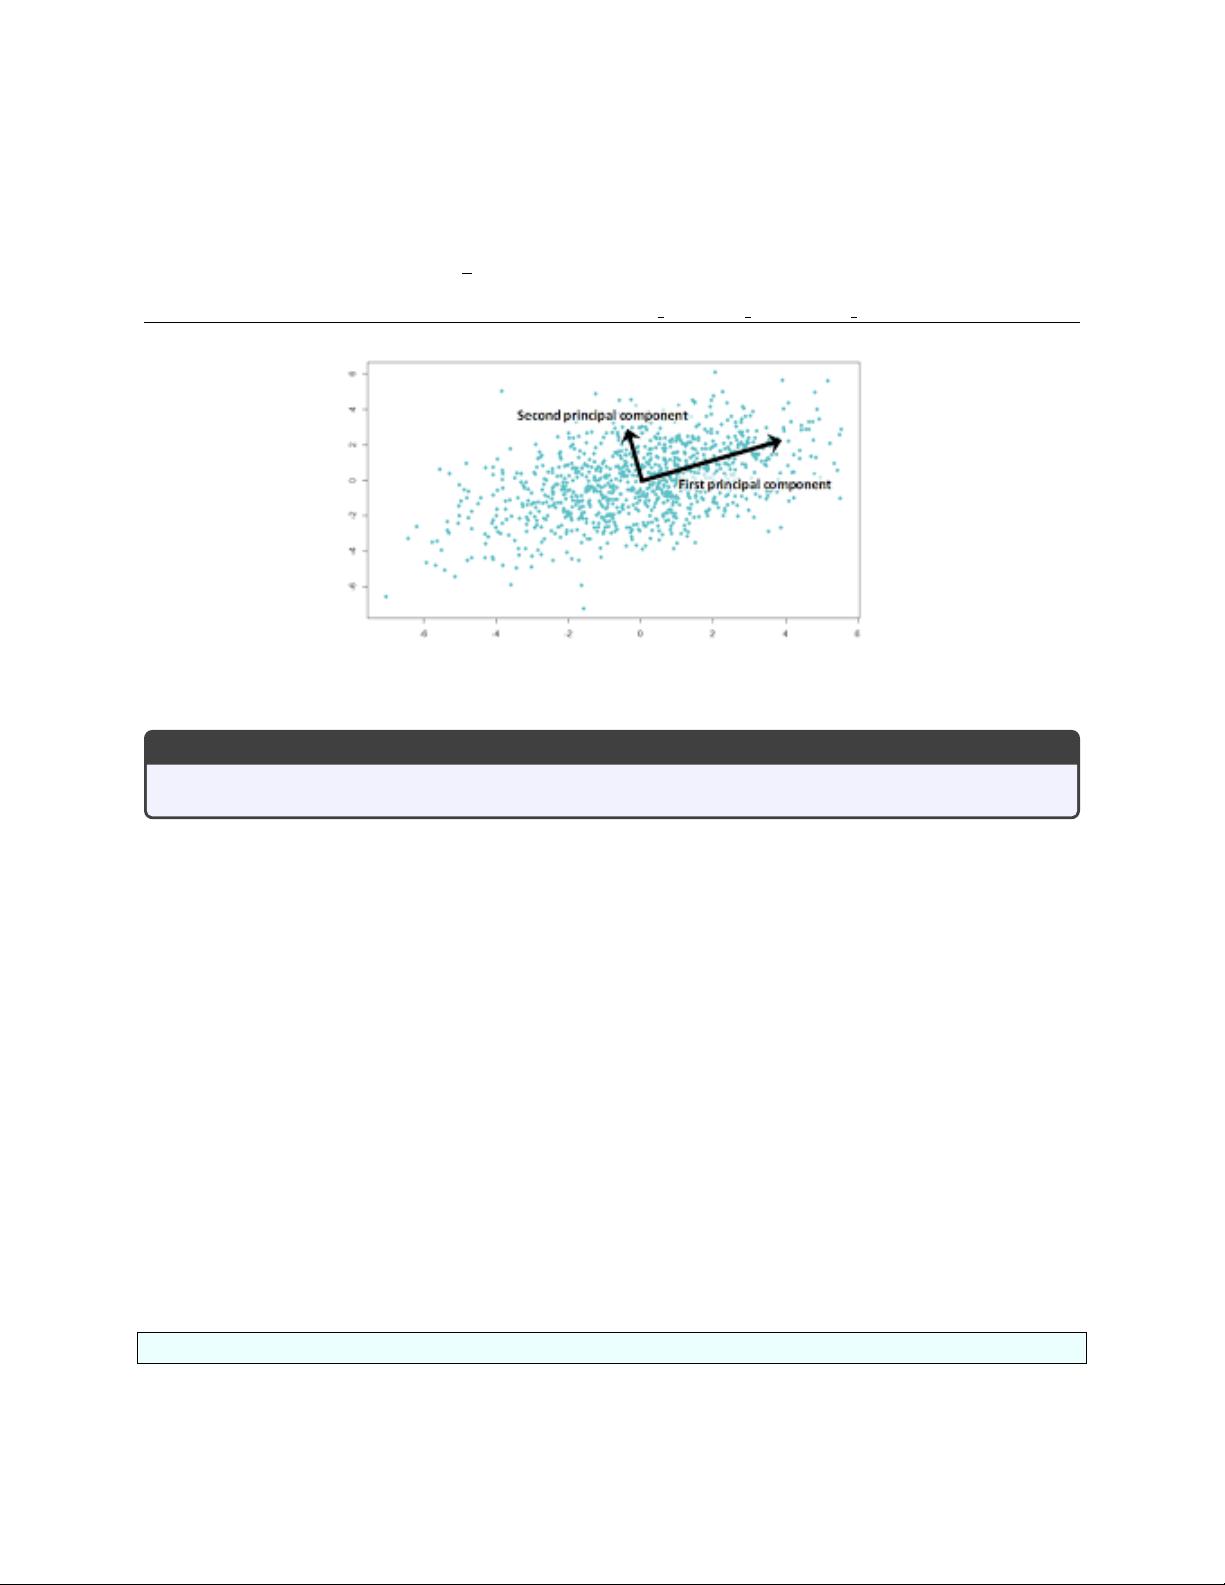
What are the top two trends in my data?
Principal Component Analysis
Find a small set of orthogonal basis vectors that approximate a large data set.
If we ask 1,000 people to fill out a survey of 50 questions, it’s likely that every survey will be different.
However, it may also be the case that distinct patterns can be observed, corresponding to differences in men
and women, young and old, conservative and liberal. Identifying these patterns will help us to understand
the data, to replace the raw data by a simpler model that explains much of the results.
We can use principal component analysis (PCA) to search for these patterns. We try to boil down our data
to reveal the most information in the fewest number of components.
If there was only one question on the survey, it would make sense to compute the average answer, and then
the variance to report how much answers can deviate from it. Now, however, our task is more complicated.
We will think of our data as a big, rectangular, numerical matrix, and we will see that the singular value
decomposition (SVD) can give us useful answers.
1 A = U * S * V
The SVD factorization of an m × n matrix A (as computed in Python) has the form A = USV where the
matrix S has the shape of A, but is nonzero only on the diagonal, while the m × m matrix U and the n × n
matrix V are orthogonal.
In Python, if A is an np.array(), then we can request the SVD factorization by:
1 U, s , V = np . l i n a l g . svd ( A ) ;
Instead of returning the matrix S, we get back a vector s, of length mn = min(m, n), containing the diagonal
entries of S. We can build S by
1
资源评论


