Drought evolution, severity and trends in mainland China
over 1961–2013
Ning Yao
a,b
,YiLi
a,b,
⁎
, Tianjie Lei
c,
⁎⁎
,LinglingPeng
a,b
a
College of Water Resources and Architectural Engineering, Northwest Agriculture and Forestry University, Yangling, Shaanxi 712100, China
b
Institute of Water Saving Agriculture in Arid Areas of China, Northwest Agriculture and Forestry University, Yangling, Shaanxi 712100, China
c
China Institute of Water Resources and Hydropower Research (IWHR), Beijing 100038, China.
HIGHLIGHTS
• The Pa, SPI, SPEI and EDDI consistently
implied an overall relief of drought con-
ditions.
• Droughts evolutions were site-, region-
al-specific and complicated although re-
lieved in recent 53 years in mainland
China.
• The Pa, SPI and SPEI are used for deter-
mining continuous droughts and EDDI
for identifying flash droughts.
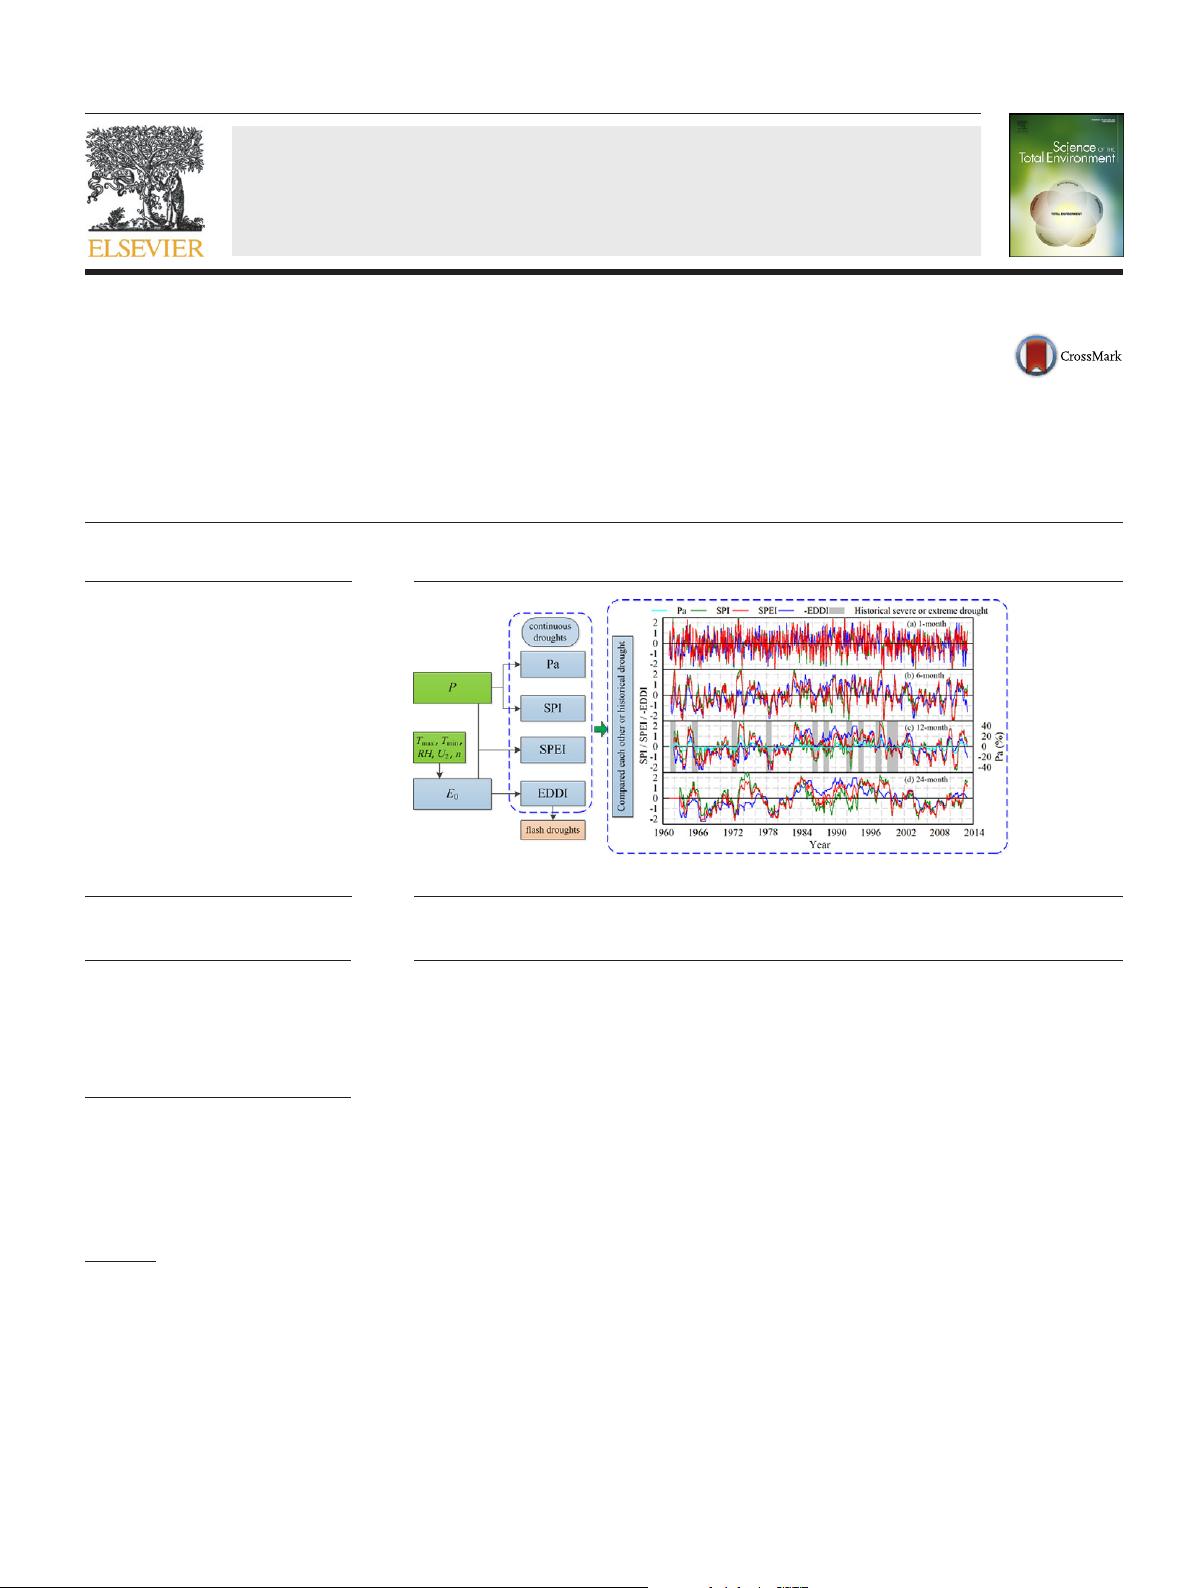
GRAPHICAL ABSTRACT
abstractarticle info
Article history:
Received 22 August 2017
Received in revised form 31 October 2017
Accepted 31 October 2017
Available online 16 November 2017
Editor: Ouyang Wei
Droughts have destructive impacts on crop yields and water supplies, and researching droughts is vital for societal
stability and human life. This work aimed to assess the spatiotemporal evolution of droughts in mainland China
over 1961–2013 using four drought indices. These indices were the percentage of precipitation anomaly (Pa), stan-
dard precipitation index (SPI), standard precipitation evapotranspiration index (SPEI) and evaporative demand
drought index (EDDI) at multiple timescales ranging from 1-week to 24-month. The variations of the SPI, SPEI
and EDDI were compared with historical severe or extreme droughts. The general increases of the Pa, SPI and
SPEI, and general decrease of the EDDI, consistently implied an overall relief of drought conditions over 1961–
2013. The different drought indices revealed historical drought conditions, including the national extreme
droughts in 1961, 1965, 1972, 1978, 1986, 1988, 1992, 1994, 1997, 1999 and 2000, but various drought severity
levels were classified for each drought event since the classification standards differed. Although the SPI and
SPEI performed better than the EDDI and there were higher correlations between the SPI and the SPEI, all the in-
dices were regional- or station-specific and have identified historical severe or extreme drought events. At shorter
timescales, the EDDI revealed earlier onsets and ends of flash droughts, unlike those indicated by the SPI and SPEI.
Keywords:
Drought index
Historical extreme drought event
Trend test
Timescale
Science of the Total Environment 616–617 (2018) 73–89
Abbreviations: E
0
, evaporative demand; EDDI, Evaporative Demand Drought Index; EMC, Entire mainland China; FAO56-PM, FAO56 Penma n-Monteith equation; InsigDec,
insignificant decrease; InsigInc, insignificant increase; METRIC, Mapping evapotranspiration with Internalized Calibration; MMK, modified Mann–Kendall; M, month; P, precipitation;
Pa, percentage of precipitation anomaly; PDSI, Palmer Drought Severity Index; R, Correlation coefficient; RDTTA, ratio of drought-threatened area to total arable land area; RH,relative
humidity; sc-PDSI, self-calibrating PDSI; SEBAL, Surface Energy Balance Algorithm for Land; SEBS, Surface Energy Balance System; SigDec, significant increase; SigInc, significant
increase; SPEI, Standardized Precipitation Evapotranspiration Index; SPI, Standardized Precipitation Index; T
max
, maximum temperature; T
mean
, mean temperature; T
min
, minimum
temperature; U
2
, wind speed; W, week.
⁎ Correspondence to: Y. Li, College of Water Resources and Architectural Engineering, Northwest Agriculture and Forestry University, Yangling, Shaanxi 712100, China.
⁎⁎ Corresponding author.
E-mail addresses: liyi@nwsuaf.edu.cn (Y. Li), leitj@iwhr.com (T. Lei).
https://doi.org/10.1016/j.scitotenv.2017.10.327
0048-9697/© 2017 Elsevier B.V. All rights reserved.
Contents lists available at ScienceDirect
Science of the Total Environment
journal homepage: www.elsevier.com/locate/scitotenv