没有合适的资源?快使用搜索试试~ 我知道了~
资源推荐
资源详情
资源评论
编号:
时间:2021 年 x 月 x 日
书山有路勤为径,学海无涯苦作舟
页码:第 1 页 共 33 页
第 1 页 共 33 页
China-Africa Trade and Investment Report
1. Sino-Africa Trade
1.1 Trade Scale
Sino-Africa trade started at $12.14 million in 1950. At present, China is the largest business partner
with Africa, and Africa is one of the most decisive import sources of China.
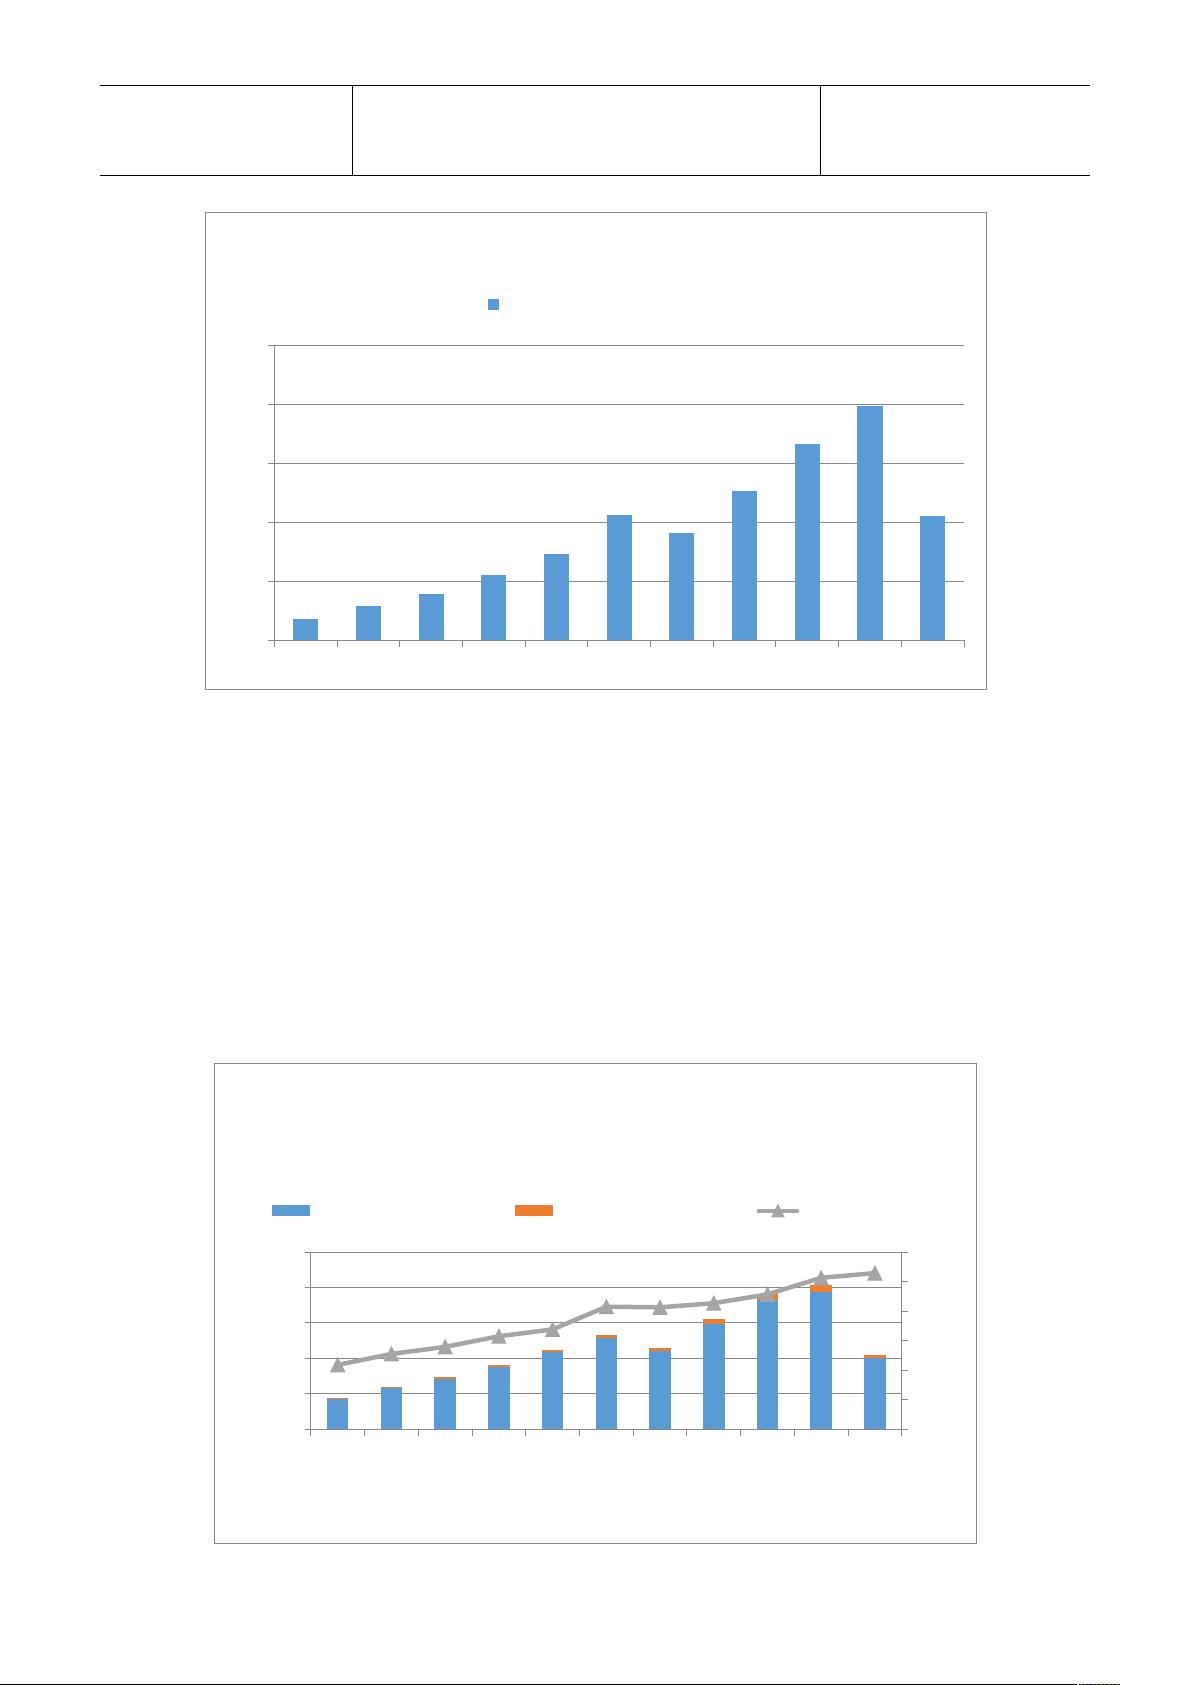
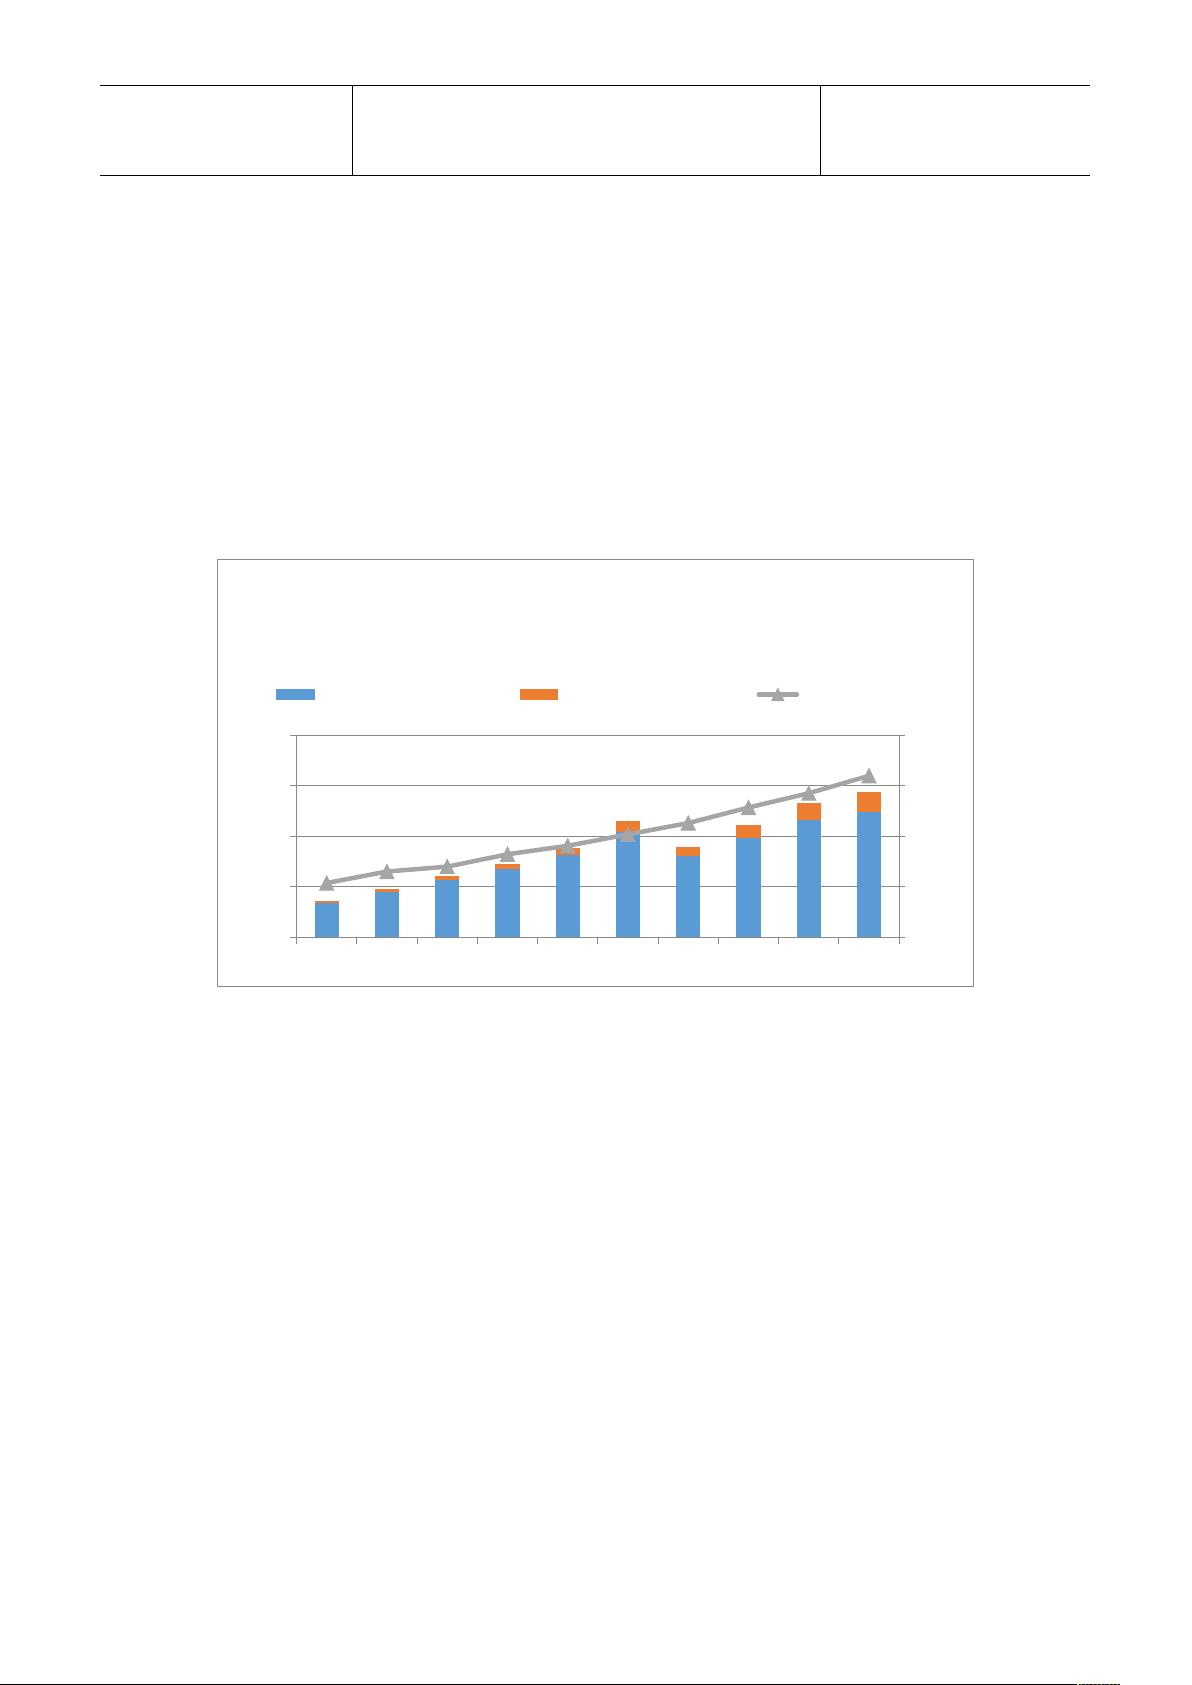
During 2003 to 1H2013, Sino-Africa trade kept rising despite of slight fluctuations. In 2006 it
exceeded $50 billion for the first time. Furthermore, in 2008, $100 billion trade volume benchmark
was broke through. In 2009, China became Africa's No. 1 trade partner.
Even during the slack global economic recovery in 2012, the quantity jumped to $198.48 billion,
increasing 19.3% year-on year. Of this, US$85.319 billion consisted of China's exports to Africa, up
16.7%, and US$113.171 billion was contributed by China's imports from Africa, up 21.4%. Total
China-Africa trade volume, China's export volume to Africa and China's import volume from Africa
all reached new highs.
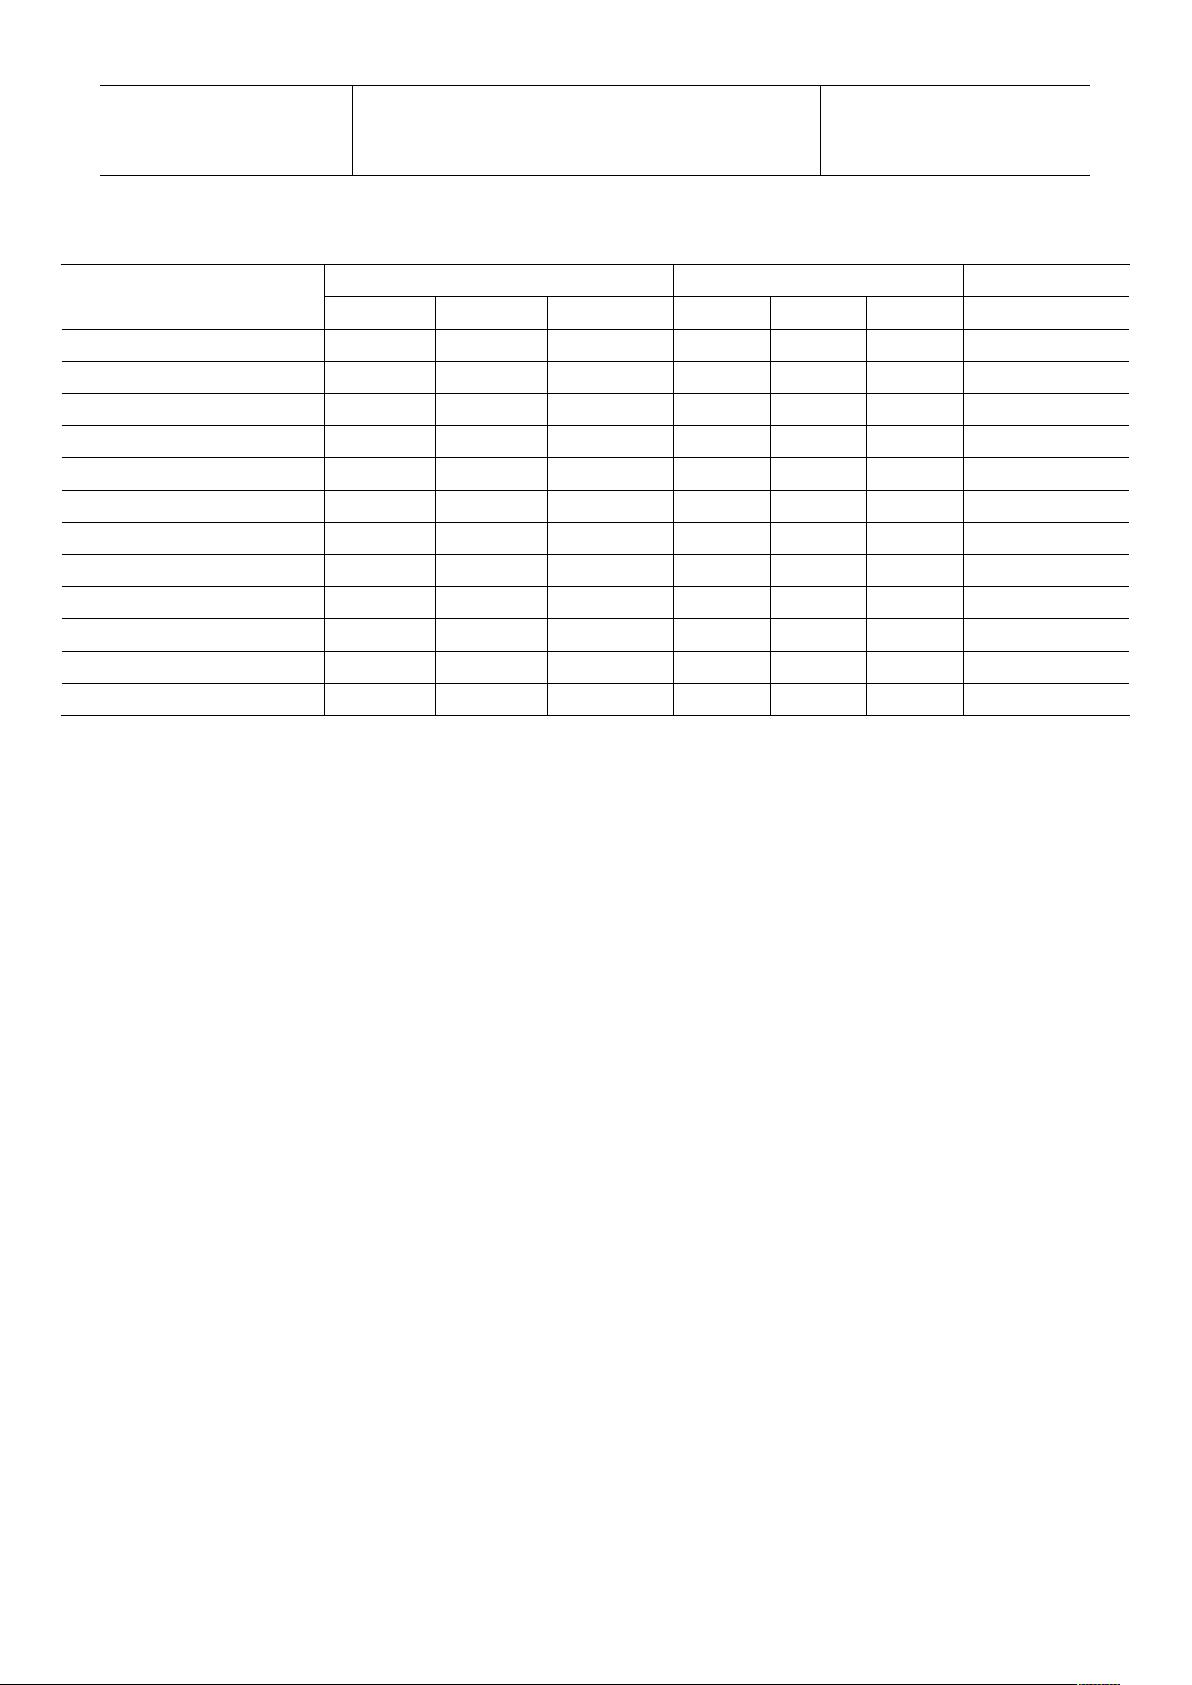
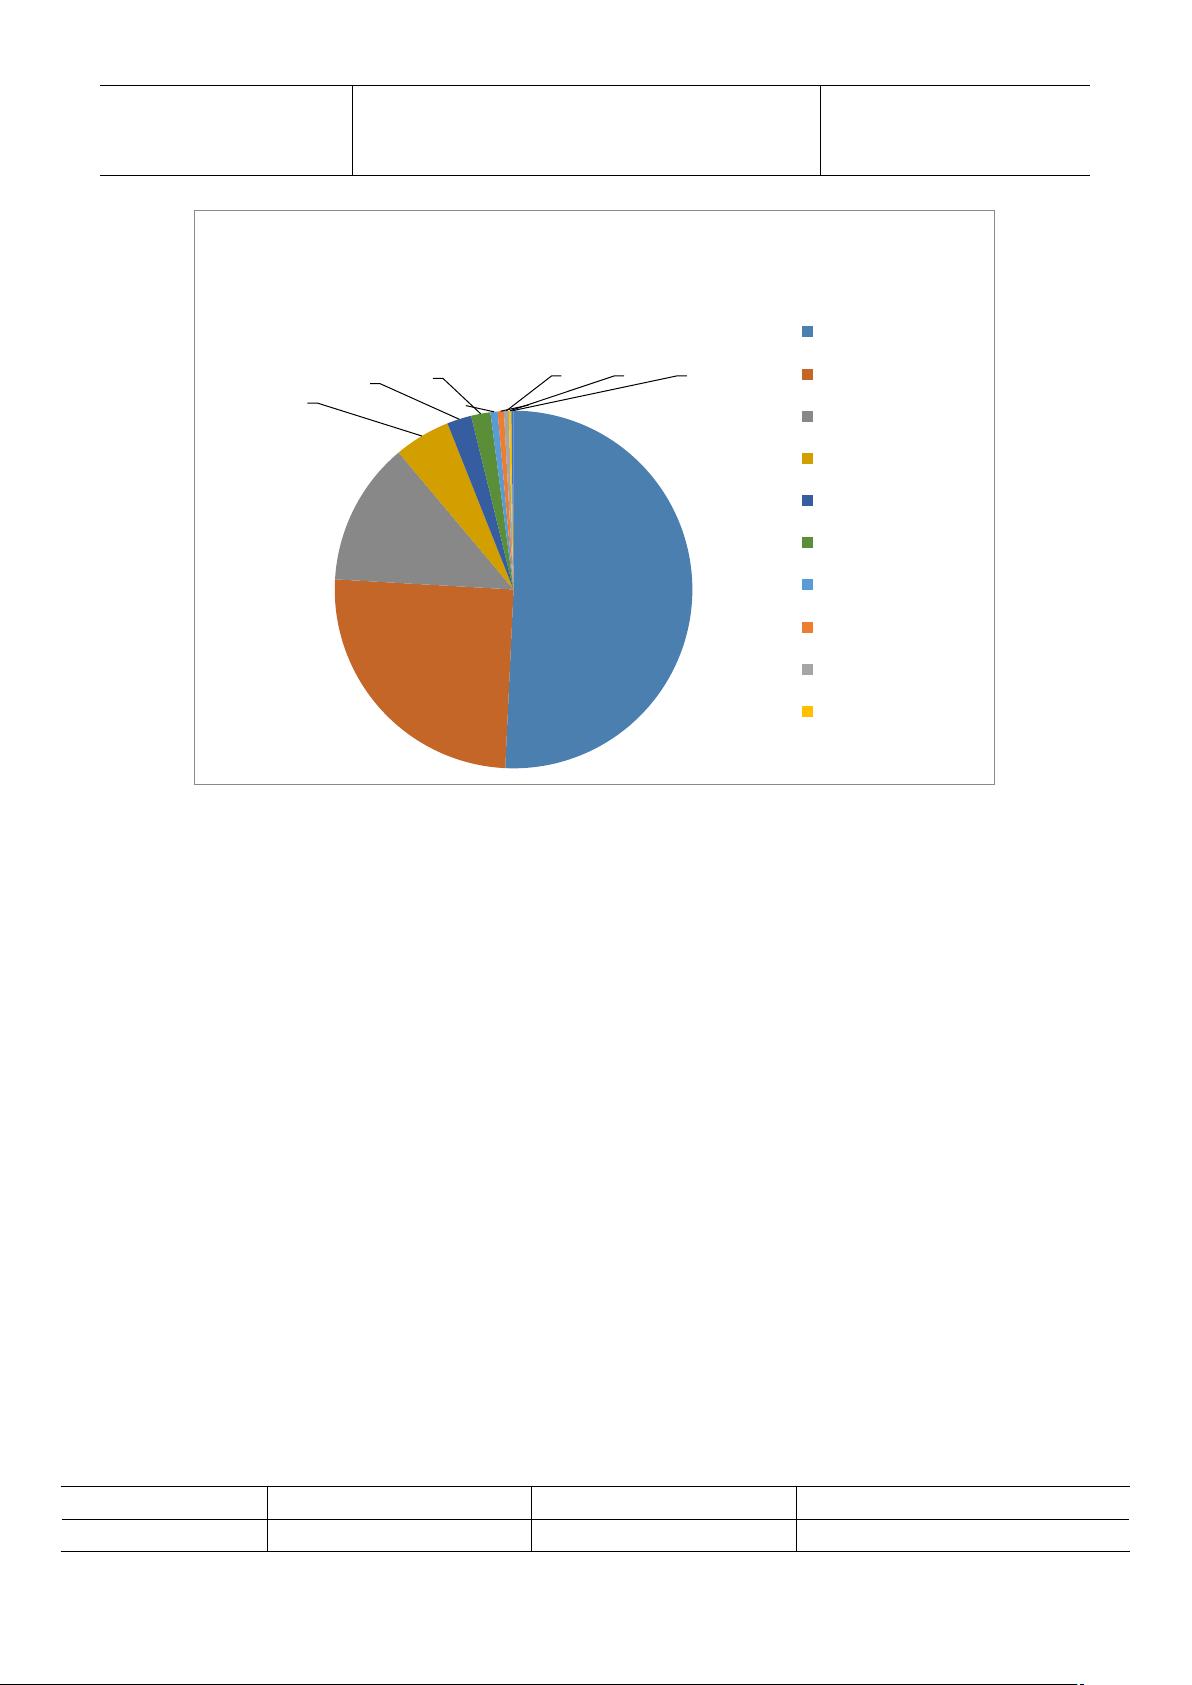
2012 China Trade with World Major Regions
Trade Volume ($100 Mil.)
Year-on-year growth Rate (%)
Total
Export
Import
Total
Export
Import
gross
38667.6
20489.35
18178.26
6.2
7.9
4.3
Asia
20449.3
10069.63
10379.67
7.5
12
3.4
Africa
1984.8
853.9
1131.71
19.3
16.7
21.4
Europe
6830.6
3964.24
2866.36
-2.5
-4.1
-0.2
Latin America
2612.43
1352.17
1260.26
8.2
11.1
5.3
North America
5363.2
3801.3
1561.9
8.5
8.06
8.2
Oceania
1364.87
448.8
916.07
5.1
9.07
3
ASEAN
400029.29
20427.19
19582.09
10.2
20.1
1.5
EU
5460.43
3339.88
2120.55
-3.7
-6.2
0.4
APEC
24687.44
13062.61
11624.83
8.1
12.3
3.7
Source: China Custom Statistics.
In the first half of 2013, the Sino-Africa trade amount was $105.65 billion, unprecedentedly
penetrating $100 billion in 6 months, increasing 7.1% year-on-year.
编号:
时间:2021 年 x 月 x 日
书山有路勤为径,学海无涯苦作舟
页码:第 2 页 共 33 页
第 2 页 共 33 页
Source: China Custom Statistics.
Though the Sino-Africa trade amount does not dominate China’s foreign trade market, it grows fast
and steady. During the 10 years period, the percentage Sino-Africa trade accounted for total
Chinese foreign trade grew from 2.2% to 5.3%, increasing by more than 2%
Specifically, the proportion consisting of China's imports from Africa up from 2.47% to 6.23%, and
that of China's exports to Africa from 2.02% to 4.16% from 2000 to 2013, according to China-Africa
Economic and Trade Cooperation (2013).
185.45
294.62
397.47
554.64
735.73
1064.82
910.8
1269.1
1663.19
1984.8
1056.5
0
500
1000
1500
2000
2500
2003
2004
2005
2006
2007
2008
2009
2010
2011
2012
1H2013
Total Trade ($100 Million)
2003-1H2013 China-Africa Trade Volume
2.2
2.6
2.8
3.2
3.4
4.2
4.1
4.3
4.6
5.1
5.3
0
10000
20000
30000
40000
50000
0.0
1.0
2.0
3.0
4.0
5.0
6.0
2003
2004
2005
2006
2007
2008
2009
2010
2011
2012
1H2013
Total China($100 Mil.)
Sino-Africa ($100 Mil.)
Percentage (%)
Sino-African Trade vs. China's Total
trade
编号:
时间:2021 年 x 月 x 日
书山有路勤为径,学海无涯苦作舟
页码:第 3 页 共 33 页
第 3 页 共 33 页
Source: China's National Bureau of Statistics.
On the African side, the changes are even more remarkable. From 2003 to 2012, the proportion of
China-Africa trade volume as a part of Africa's total foreign trade volume increased from 5.38% to
16%, increasing more than 10%.
According to China-Africa Economic and Trade Cooperation (2013), from 2000 to 2012, the
proportion contributed by Africa's exports to China up from 3.76% to 18.07%, and that by Africa's
imports from China from 3.88% to 14.11%.
Source: China's National Bureau of Statistics; World Trade Organization Statistics.
1.2 China’s Import from Africa
In general, China-Africa trade figures are relatively balanced since China’s trade adverse balance
is negligible compared with total trade volume. However, China-Africa trade structure remains
considerably uneven both in terms of products structure and geographical distribution.
1.2.1 Imported Products from Africa to China
Resource and primary products still dominate China’s imports from Africa, and the commodities
structure is generally sustained and steady.
The top 10 products imported from Africa in 2012 were mineral fuel, ores, slag and ash, copper,
noble metal, wood, cotton, steel, grains, tobacco and others, accounting for 97.07% of all imports
from Africa (see chart2).
5.38
6.52
7.00
8.23
9.07
10.20
11.32
12.86
14.28
16.00
0
5000
10000
15000
20000
0.00
5.00
10.00
15.00
20.00
2003
2004
2005
2006
2007
2008
2009
2010
2011
2012
Total Africa($100 Mil.)
Sino-Africa($100 Mil.)
Percentage(%)
Sino-Africa Trade vs. African Total
Trade
编号:
时间:2021 年 x 月 x 日
书山有路勤为径,学海无涯苦作舟
页码:第 4 页 共 33 页
第 4 页 共 33 页
Top 10 Products Imported from Africa
Export($100 Mil.)
Percentage (%)
Growth (%)
Products
2010
2011
2012
2010
2011
2012
2012/2011
All African Products
668.96
931.40
1130.87
4.80
5.35
6.22
21.42
Mineral Fuel
414.75
490.73
560.84
62.00
52.69
49.59
14.29
Other
34.01
159.26
289.41
5.08
17.10
25.59
81.72
Ores, Slag and Ash
88.64
126.20
113.20
13.25
13.55
10.01
-10.30
Copper
40.87
45.24
49.24
6.11
4.86
4.35
8.83
Noble Metal
24.07
34.72
38.90
3.60
3.73
3.44
12.04
Wood
12.08
11.50
14.48
1.81
1.24
1.28
25.90
Cotton
4.64
8.17
12.48
0.69
0.88
1.10
52.64
Steel
11.64
14.22
9.68
1.74
1.53
0.86
-31.95
Grains
4.38
5.02
5.16
0.66
0.54
0.46
2.71
Tobacco
1.62
3.33
4.42
0.24
0.36
0.39
32.53
Total
636.70
898.41
1097.80
95.18
96.48
97.07
22.19
Source: China Custom.
In 2012, mineral fuel, mainly crude oil, constituted 49.59%, almost half of all the imports. Crude oil
imported from Africa valued $53.8 billion, accounting for 24.41% of China's total crude oil imports,
overtaking America to become the no.1 destination of Africa's oil exports.
In terms of metallic ore imports, China’s amount was $11.32 billion, occupying 8.47% of the total
mineral imports of China. Iron ore, the major component, accounted for 63.36% in 2012. Follow
behind were manganese, chrome ore and copper, occupying 8.85%, 8.09% and 5.95%
respectively.
编号:
时间:2021 年 x 月 x 日
书山有路勤为径,学海无涯苦作舟
页码:第 5 页 共 33 页
第 5 页 共 33 页
Source: China Custom.
It is notable that Sino-African trade in agricultural products has grown quickly in recent years. From
2009 to 2012, China's agricultural imports from Africa grew from US$1.16 billion to US$2.86 billion,
a 146% increase. Most imported agricultural products are non-food items, including cotton, hemp,
silk, oilseeds and other such products.
A major reason for the rapid increase in Chinese imports of African agricultural products is the
zero-tariff policy that the Chinese government adopted in 2005 for some African products.
Agricultural products are a major category benefiting from this policy and, as a result, the export of
specialty African agricultural products to China has grown rapidly.
1.2.2 African Exporters to China
At the country level, China-Africa trade is highly intensive.In 2012, top 10 African exporters to China,
in order, were South Africa, Angola, Libya, Congo (Brazzaville), Congo (DRC), Zambia, Algeria,
Sudan, Equatorial Guinea and Mauritania, accounting for 90.89% of Africa total exports to China,
which indicated a high level of geographical concentration.
Top10 African Export Countries to China in 2012
Rank
Country
Share of Trade (%)
Year-on-year Growth (%)
1
South Africa
39.42
39.14
1131
50.74%
561
25.16%
289
12.99%
113
5.08%
49
2.21%
39
1.75%
14
0.65%
12
0.56%
10
0.43%
5
0.23%
4
0.20%
Mineral Fuel
Other
Ores, Slag and Ash
Copper
Noble Metal
Wood
Cotton
Steel
Grains
Tobacco
Structure of the Top 10 Imported
Products from Africa($100 Mil.)
剩余32页未读,继续阅读
资源评论
拉拉庸
- 粉丝: 19
- 资源: 66万+
上传资源 快速赚钱
- 我的内容管理 展开
- 我的资源 快来上传第一个资源
- 我的收益 登录查看自己的收益
- 我的积分 登录查看自己的积分
- 我的C币 登录后查看C币余额
- 我的收藏
- 我的下载
- 下载帮助
安全验证
文档复制为VIP权益,开通VIP直接复制
信息提交成功