


Simpleperf Introduction
Yabin Cui
android-llvm-dev

Outline
● What is simpleperf
● How simpleperf works
● Simpleperf commands

What is simpleperf
● A replacement for linux/tools/perf in Android
● A cpu-profiler using linux kernel support and PMU (performance monitor unit)
hardware support
● Source code is in
https://android.googlesource.com/platform/system/extras/+/master/simpleperf/
● Doc is in
https://android.googlesource.com/platform/system/extras/+/master/simpleperf/doc/
● Prebuilt is release in
https://android.googlesource.com/platform/prebuilts/simpleperf/
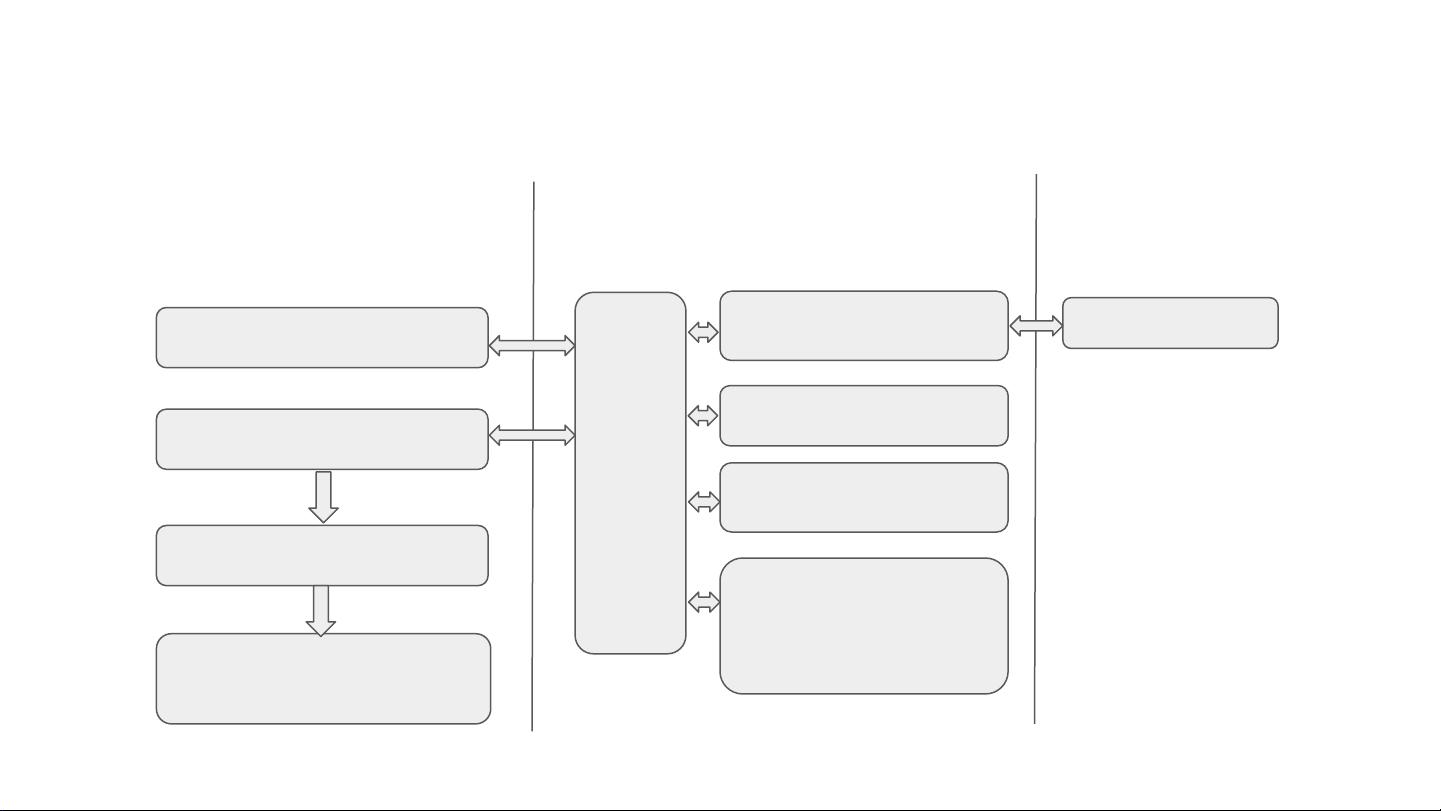
How simpleperf works
simpleperf stat cmd
simpleperf record cmd
profile data file
simpleperf report cmd
and other report
methods
perf
event
driver
cpu pmu driver
software pmu driver
tracepoint pmu
driver
device specific pmu
drivers
ARM PMU
Userspace
Kernel
Hardware

ARM PMU
● Described in ARM manual, D7 The Performance Monitors Extension
● PMU counter: Each cpu core has several PMU counters. Each counter is 32-bit, can monitor one
PMU event. When the monitored event happens, the counter value increases by one. When a
counter overflows, it can trigger an interrupt.
● PMU event: like CPU_CYCLES, BR_PRED (predictable branch), L1D_CACHE (Level 1 data cache
access). ARM lists common events and how to interpret them. And the events can be used together
to get indirect information, like cache miss rate = cache refill count / cache_access_count.
● The PMU events are growing in newer architectures.


